2010 Municipal Census - Regional Municipality of Wood Buffalo
2010 Municipal Census - Regional Municipality of Wood Buffalo
2010 Municipal Census - Regional Municipality of Wood Buffalo
- No tags were found...

Create successful ePaper yourself
Turn your PDF publications into a flip-book with our unique Google optimized e-Paper software.
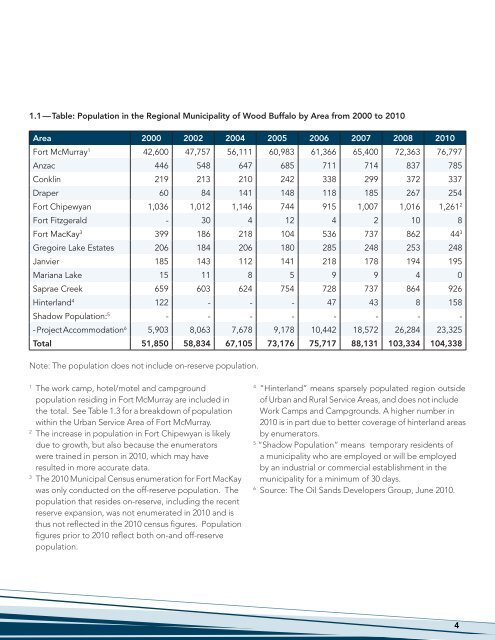
1.1 — Table: Population in the <strong>Regional</strong> <strong>Municipal</strong>ity <strong>of</strong> <strong>Wood</strong> <strong>Buffalo</strong> by Area from 2000 to <strong>2010</strong>Area 2000 2002 2004 2005 2006 2007 2008 <strong>2010</strong>Fort McMurray 1 42,600 47,757 56,111 60,983 61,366 65,400 72,363 76,797Anzac 446 548 647 685 711 714 837 785Conklin 219 213 210 242 338 299 372 337Draper 60 84 141 148 118 185 267 254Fort Chipewyan 1,036 1,012 1,146 744 915 1,007 1,016 1,261 2Fort Fitzgerald - 30 4 12 4 2 10 8Fort MacKay 3 399 186 218 104 536 737 862 44 3Gregoire Lake Estates 206 184 206 180 285 248 253 248Janvier 185 143 112 141 218 178 194 195Mariana Lake 15 11 8 5 9 9 4 0Saprae Creek 659 603 624 754 728 737 864 926Hinterland 4 122 - - - 47 43 8 158Shadow Population: 5 - - - - - - - -- Project Accommodation 6 5,903 8,063 7,678 9,178 10,442 18,572 26,284 23,325Total 51,850 58,834 67,105 73,176 75,717 88,131 103,334 104,338Note: The population does not include on-reserve population.1The work camp, hotel/motel and campgroundpopulation residing in Fort McMurray are included inthe total. See Table 1.3 for a breakdown <strong>of</strong> populationwithin the Urban Service Area <strong>of</strong> Fort McMurray.2The increase in population in Fort Chipewyan is likelydue to growth, but also because the enumeratorswere trained in person in <strong>2010</strong>, which may haveresulted in more accurate data.3The <strong>2010</strong> <strong>Municipal</strong> <strong>Census</strong> enumeration for Fort MacKaywas only conducted on the <strong>of</strong>f-reserve population. Thepopulation that resides on-reserve, including the recentreserve expansion, was not enumerated in <strong>2010</strong> and isthus not reflected in the <strong>2010</strong> census figures. Populationfigures prior to <strong>2010</strong> reflect both on-and <strong>of</strong>f-reservepopulation.4“Hinterland” means sparsely populated region outside<strong>of</strong> Urban and Rural Service Areas, and does not includeWork Camps and Campgrounds. A higher number in<strong>2010</strong> is in part due to better coverage <strong>of</strong> hinterland areasby enumerators.5“Shadow Population” means temporary residents <strong>of</strong>a municipality who are employed or will be employedby an industrial or commercial establishment in themunicipality for a minimum <strong>of</strong> 30 days.6Source: The Oil Sands Developers Group, June <strong>2010</strong>.4