Conservation of giant panda habitat in South Minshan, China, after ...
Conservation of giant panda habitat in South Minshan, China, after ...
Conservation of giant panda habitat in South Minshan, China, after ...

You also want an ePaper? Increase the reach of your titles
YUMPU automatically turns print PDFs into web optimized ePapers that Google loves.
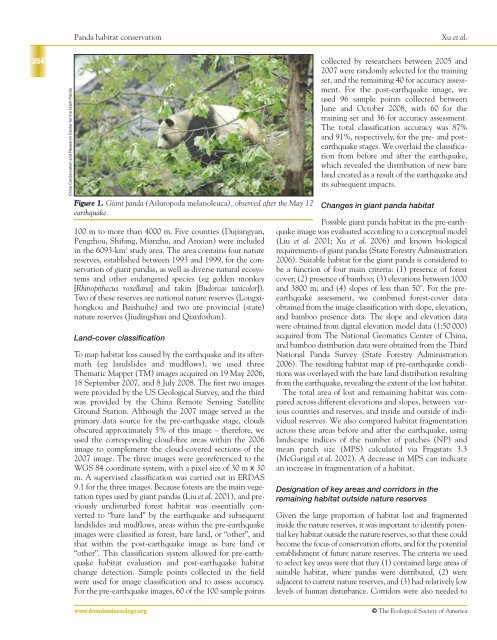
Panda <strong>habitat</strong> conservationXu et al.354Ch<strong>in</strong>a <strong>Conservation</strong> and Research Center for the Giant PandaFigure 1. Giant <strong>panda</strong> (Ailuropoda melanoleuca), observed <strong>after</strong> the May 12earthquake.100 m to more than 4000 m. Five counties (Dujiangyan,Pengzhou, Shifang, Mianzhu, and Anxian) were <strong>in</strong>cluded<strong>in</strong> the 6093-km 2 study area. The area conta<strong>in</strong>s four naturereserves, established between 1993 and 1999, for the conservation<strong>of</strong> <strong>giant</strong> <strong>panda</strong>s, as well as diverse natural ecosystemsand other endangered species (eg golden monkey[Rh<strong>in</strong>opithecus roxellana] and tak<strong>in</strong> [Budorcas taxicolor]).Two <strong>of</strong> these reserves are national nature reserves (Longxihongkouand Baishuihe) and two are prov<strong>in</strong>cial (state)nature reserves (Jiud<strong>in</strong>gshan and Qianfoshan).Land-cover classificationTo map <strong>habitat</strong> loss caused by the earthquake and its <strong>after</strong>math(eg landslides and mudflows), we used threeThematic Mapper (TM) images acquired on 19 May 2006,18 September 2007, and 8 July 2008. The first two imageswere provided by the US Geological Survey, and the thirdwas provided by the Ch<strong>in</strong>a Remote Sens<strong>in</strong>g SatelliteGround Station. Although the 2007 image served as theprimary data source for the pre-earthquake stage, cloudsobscured approximately 5% <strong>of</strong> this image – therefore, weused the correspond<strong>in</strong>g cloud-free areas with<strong>in</strong> the 2006image to complement the cloud-covered sections <strong>of</strong> the2007 image. The three images were georeferenced to theWGS 84 coord<strong>in</strong>ate system, with a pixel size <strong>of</strong> 30 m x 30m. A supervised classification was carried out <strong>in</strong> ERDAS9.1 for the three images. Because forests are the ma<strong>in</strong> vegetationtypes used by <strong>giant</strong> <strong>panda</strong>s (Liu et al. 2001), and previouslyundisturbed forest <strong>habitat</strong> was essentially convertedto “bare land” by the earthquake and subsequentlandslides and mudflows, areas with<strong>in</strong> the pre-earthquakeimages were classified as forest, bare land, or “other”, andthat with<strong>in</strong> the post-earthquake image as bare land or“other”. This classification system allowed for pre-earthquake<strong>habitat</strong> evaluation and post-earthquake <strong>habitat</strong>change detection. Sample po<strong>in</strong>ts collected <strong>in</strong> the fieldwere used for image classification and to assess accuracy.For the pre-earthquake images, 60 <strong>of</strong> the 100 sample po<strong>in</strong>tscollected by researchers between 2005 and2007 were randomly selected for the tra<strong>in</strong><strong>in</strong>gset, and the rema<strong>in</strong><strong>in</strong>g 40 for accuracy assessment.For the post-earthquake image, weused 96 sample po<strong>in</strong>ts collected betweenJune and October 2008, with 60 for thetra<strong>in</strong><strong>in</strong>g set and 36 for accuracy assessment.The total classification accuracy was 87%and 91%, respectively, for the pre- and postearthquakestages. We overlaid the classificationfrom before and <strong>after</strong> the earthquake,which revealed the distribution <strong>of</strong> new bareland created as a result <strong>of</strong> the earthquake andits subsequent impacts.Changes <strong>in</strong> <strong>giant</strong> <strong>panda</strong> <strong>habitat</strong>Possible <strong>giant</strong> <strong>panda</strong> <strong>habitat</strong> <strong>in</strong> the pre-earthquakeimage was evaluated accord<strong>in</strong>g to a conceptual model(Liu et al. 2001; Xu et al. 2006) and known biologicalrequirements <strong>of</strong> <strong>giant</strong> <strong>panda</strong>s (State Forestry Adm<strong>in</strong>istration2006). Suitable <strong>habitat</strong> for the <strong>giant</strong> <strong>panda</strong> is considered tobe a function <strong>of</strong> four ma<strong>in</strong> criteria: (1) presence <strong>of</strong> forestcover; (2) presence <strong>of</strong> bamboo; (3) elevations between 1000and 3800 m; and (4) slopes <strong>of</strong> less than 50˚. For the preearthquakeassessment, we comb<strong>in</strong>ed forest-cover dataobta<strong>in</strong>ed from the image classification with slope, elevation,and bamboo presence data. The slope and elevation datawere obta<strong>in</strong>ed from digital elevation model data (1:50 000)acquired from The National Geomatics Center <strong>of</strong> Ch<strong>in</strong>a,and bamboo distribution data were obta<strong>in</strong>ed from the ThirdNational Panda Survey (State Forestry Adm<strong>in</strong>istration2006). The result<strong>in</strong>g <strong>habitat</strong> map <strong>of</strong> pre-earthquake conditionswas overlayed with the bare land distribution result<strong>in</strong>gfrom the earthquake, reveal<strong>in</strong>g the extent <strong>of</strong> the lost <strong>habitat</strong>.The total area <strong>of</strong> lost and rema<strong>in</strong><strong>in</strong>g <strong>habitat</strong> was comparedacross different elevations and slopes, between variouscounties and reserves, and <strong>in</strong>side and outside <strong>of</strong> <strong>in</strong>dividualreserves. We also compared <strong>habitat</strong> fragmentationacross these areas before and <strong>after</strong> the earthquake, us<strong>in</strong>glandscape <strong>in</strong>dices <strong>of</strong> the number <strong>of</strong> patches (NP) andmean patch size (MPS) calculated via Fragstats 3.3(McGarigal et al. 2002). A decrease <strong>in</strong> MPS can <strong>in</strong>dicatean <strong>in</strong>crease <strong>in</strong> fragmentation <strong>of</strong> a <strong>habitat</strong>.Designation <strong>of</strong> key areas and corridors <strong>in</strong> therema<strong>in</strong><strong>in</strong>g <strong>habitat</strong> outside nature reservesGiven the large proportion <strong>of</strong> <strong>habitat</strong> lost and fragmented<strong>in</strong>side the nature reserves, it was important to identify potentialkey <strong>habitat</strong> outside the nature reserves, so that these couldbecome the focus <strong>of</strong> conservation efforts, and for the potentialestablishment <strong>of</strong> future nature reserves. The criteria we usedto select key areas were that they (1) conta<strong>in</strong>ed large areas <strong>of</strong>suitable <strong>habitat</strong>, where <strong>panda</strong>s were distributed, (2) wereadjacent to current nature reserves, and (3) had relatively lowlevels <strong>of</strong> human disturbance. Corridors were also needed towww.frontiers<strong>in</strong>ecology.org© The Ecological Society <strong>of</strong> America