Panda <strong>habitat</strong> conservationXu et al.354Ch<strong>in</strong>a <strong>Conservation</strong> and Research Center for the Giant PandaFigure 1. Giant <strong>panda</strong> (Ailuropoda melanoleuca), observed <strong>after</strong> the May 12earthquake.100 m to more than 4000 m. Five counties (Dujiangyan,Pengzhou, Shifang, Mianzhu, and Anxian) were <strong>in</strong>cluded<strong>in</strong> the 6093-km 2 study area. The area conta<strong>in</strong>s four naturereserves, established between 1993 and 1999, for the conservation<strong>of</strong> <strong>giant</strong> <strong>panda</strong>s, as well as diverse natural ecosystemsand other endangered species (eg golden monkey[Rh<strong>in</strong>opithecus roxellana] and tak<strong>in</strong> [Budorcas taxicolor]).Two <strong>of</strong> these reserves are national nature reserves (Longxihongkouand Baishuihe) and two are prov<strong>in</strong>cial (state)nature reserves (Jiud<strong>in</strong>gshan and Qianfoshan).Land-cover classificationTo map <strong>habitat</strong> loss caused by the earthquake and its <strong>after</strong>math(eg landslides and mudflows), we used threeThematic Mapper (TM) images acquired on 19 May 2006,18 September 2007, and 8 July 2008. The first two imageswere provided by the US Geological Survey, and the thirdwas provided by the Ch<strong>in</strong>a Remote Sens<strong>in</strong>g SatelliteGround Station. Although the 2007 image served as theprimary data source for the pre-earthquake stage, cloudsobscured approximately 5% <strong>of</strong> this image – therefore, weused the correspond<strong>in</strong>g cloud-free areas with<strong>in</strong> the 2006image to complement the cloud-covered sections <strong>of</strong> the2007 image. The three images were georeferenced to theWGS 84 coord<strong>in</strong>ate system, with a pixel size <strong>of</strong> 30 m x 30m. A supervised classification was carried out <strong>in</strong> ERDAS9.1 for the three images. Because forests are the ma<strong>in</strong> vegetationtypes used by <strong>giant</strong> <strong>panda</strong>s (Liu et al. 2001), and previouslyundisturbed forest <strong>habitat</strong> was essentially convertedto “bare land” by the earthquake and subsequentlandslides and mudflows, areas with<strong>in</strong> the pre-earthquakeimages were classified as forest, bare land, or “other”, andthat with<strong>in</strong> the post-earthquake image as bare land or“other”. This classification system allowed for pre-earthquake<strong>habitat</strong> evaluation and post-earthquake <strong>habitat</strong>change detection. Sample po<strong>in</strong>ts collected <strong>in</strong> the fieldwere used for image classification and to assess accuracy.For the pre-earthquake images, 60 <strong>of</strong> the 100 sample po<strong>in</strong>tscollected by researchers between 2005 and2007 were randomly selected for the tra<strong>in</strong><strong>in</strong>gset, and the rema<strong>in</strong><strong>in</strong>g 40 for accuracy assessment.For the post-earthquake image, weused 96 sample po<strong>in</strong>ts collected betweenJune and October 2008, with 60 for thetra<strong>in</strong><strong>in</strong>g set and 36 for accuracy assessment.The total classification accuracy was 87%and 91%, respectively, for the pre- and postearthquakestages. We overlaid the classificationfrom before and <strong>after</strong> the earthquake,which revealed the distribution <strong>of</strong> new bareland created as a result <strong>of</strong> the earthquake andits subsequent impacts.Changes <strong>in</strong> <strong>giant</strong> <strong>panda</strong> <strong>habitat</strong>Possible <strong>giant</strong> <strong>panda</strong> <strong>habitat</strong> <strong>in</strong> the pre-earthquakeimage was evaluated accord<strong>in</strong>g to a conceptual model(Liu et al. 2001; Xu et al. 2006) and known biologicalrequirements <strong>of</strong> <strong>giant</strong> <strong>panda</strong>s (State Forestry Adm<strong>in</strong>istration2006). Suitable <strong>habitat</strong> for the <strong>giant</strong> <strong>panda</strong> is considered tobe a function <strong>of</strong> four ma<strong>in</strong> criteria: (1) presence <strong>of</strong> forestcover; (2) presence <strong>of</strong> bamboo; (3) elevations between 1000and 3800 m; and (4) slopes <strong>of</strong> less than 50˚. For the preearthquakeassessment, we comb<strong>in</strong>ed forest-cover dataobta<strong>in</strong>ed from the image classification with slope, elevation,and bamboo presence data. The slope and elevation datawere obta<strong>in</strong>ed from digital elevation model data (1:50 000)acquired from The National Geomatics Center <strong>of</strong> Ch<strong>in</strong>a,and bamboo distribution data were obta<strong>in</strong>ed from the ThirdNational Panda Survey (State Forestry Adm<strong>in</strong>istration2006). The result<strong>in</strong>g <strong>habitat</strong> map <strong>of</strong> pre-earthquake conditionswas overlayed with the bare land distribution result<strong>in</strong>gfrom the earthquake, reveal<strong>in</strong>g the extent <strong>of</strong> the lost <strong>habitat</strong>.The total area <strong>of</strong> lost and rema<strong>in</strong><strong>in</strong>g <strong>habitat</strong> was comparedacross different elevations and slopes, between variouscounties and reserves, and <strong>in</strong>side and outside <strong>of</strong> <strong>in</strong>dividualreserves. We also compared <strong>habitat</strong> fragmentationacross these areas before and <strong>after</strong> the earthquake, us<strong>in</strong>glandscape <strong>in</strong>dices <strong>of</strong> the number <strong>of</strong> patches (NP) andmean patch size (MPS) calculated via Fragstats 3.3(McGarigal et al. 2002). A decrease <strong>in</strong> MPS can <strong>in</strong>dicatean <strong>in</strong>crease <strong>in</strong> fragmentation <strong>of</strong> a <strong>habitat</strong>.Designation <strong>of</strong> key areas and corridors <strong>in</strong> therema<strong>in</strong><strong>in</strong>g <strong>habitat</strong> outside nature reservesGiven the large proportion <strong>of</strong> <strong>habitat</strong> lost and fragmented<strong>in</strong>side the nature reserves, it was important to identify potentialkey <strong>habitat</strong> outside the nature reserves, so that these couldbecome the focus <strong>of</strong> conservation efforts, and for the potentialestablishment <strong>of</strong> future nature reserves. The criteria we usedto select key areas were that they (1) conta<strong>in</strong>ed large areas <strong>of</strong>suitable <strong>habitat</strong>, where <strong>panda</strong>s were distributed, (2) wereadjacent to current nature reserves, and (3) had relatively lowlevels <strong>of</strong> human disturbance. Corridors were also needed towww.frontiers<strong>in</strong>ecology.org© The Ecological Society <strong>of</strong> America
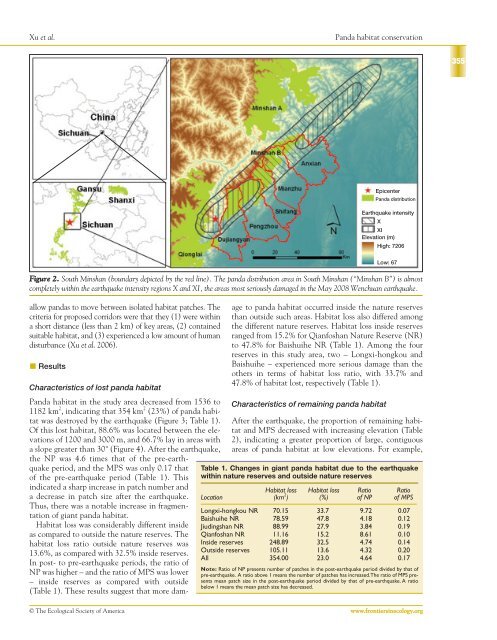
Xu et al.Panda <strong>habitat</strong> conservation355EpicenterPanda distributionEarthquake <strong>in</strong>tensityXXIElevation (m)High: 7206Figure 2. <strong>South</strong> M<strong>in</strong>shan (boundary depicted by the red l<strong>in</strong>e). The <strong>panda</strong> distribution area <strong>in</strong> <strong>South</strong> M<strong>in</strong>shan (“M<strong>in</strong>shan B”) is almostcompletely with<strong>in</strong> the earthquake <strong>in</strong>tensity regions X and XI, the areas most seriously damaged <strong>in</strong> the May 2008 Wenchuan earthquake.allow <strong>panda</strong>s to move between isolated <strong>habitat</strong> patches. Thecriteria for proposed corridors were that they (1) were with<strong>in</strong>a short distance (less than 2 km) <strong>of</strong> key areas, (2) conta<strong>in</strong>edsuitable <strong>habitat</strong>, and (3) experienced a low amount <strong>of</strong> humandisturbance (Xu et al. 2006). ResultsCharacteristics <strong>of</strong> lost <strong>panda</strong> <strong>habitat</strong>Panda <strong>habitat</strong> <strong>in</strong> the study area decreased from 1536 to1182 km 2 , <strong>in</strong>dicat<strong>in</strong>g that 354 km 2 (23%) <strong>of</strong> <strong>panda</strong> <strong>habitat</strong>was destroyed by the earthquake (Figure 3; Table 1).Of this lost <strong>habitat</strong>, 88.6% was located between the elevations<strong>of</strong> 1200 and 3000 m, and 66.7% lay <strong>in</strong> areas witha slope greater than 30˚ (Figure 4). After the earthquake,the NP was 4.6 times that <strong>of</strong> the pre-earthquakeperiod, and the MPS was only 0.17 that<strong>of</strong> the pre-earthquake period (Table 1). This<strong>in</strong>dicated a sharp <strong>in</strong>crease <strong>in</strong> patch number anda decrease <strong>in</strong> patch size <strong>after</strong> the earthquake.Thus, there was a notable <strong>in</strong>crease <strong>in</strong> fragmentation<strong>of</strong> <strong>giant</strong> <strong>panda</strong> <strong>habitat</strong>.Habitat loss was considerably different <strong>in</strong>sideas compared to outside the nature reserves. The<strong>habitat</strong> loss ratio outside nature reserves was13.6%, as compared with 32.5% <strong>in</strong>side reserves.In post- to pre-earthquake periods, the ratio <strong>of</strong>NP was higher – and the ratio <strong>of</strong> MPS was lower– <strong>in</strong>side reserves as compared with outside(Table 1). These results suggest that more dam-age to <strong>panda</strong> <strong>habitat</strong> occurred <strong>in</strong>side the nature reservesthan outside such areas. Habitat loss also differed amongthe different nature reserves. Habitat loss <strong>in</strong>side reservesranged from 15.2% for Qianfoshan Nature Reserve (NR)to 47.8% for Baishuihe NR (Table 1). Among the fourreserves <strong>in</strong> this study area, two – Longxi-hongkou andBaishuihe – experienced more serious damage than theothers <strong>in</strong> terms <strong>of</strong> <strong>habitat</strong> loss ratio, with 33.7% and47.8% <strong>of</strong> <strong>habitat</strong> lost, respectively (Table 1).Characteristics <strong>of</strong> rema<strong>in</strong><strong>in</strong>g <strong>panda</strong> <strong>habitat</strong>Low: 67After the earthquake, the proportion <strong>of</strong> rema<strong>in</strong><strong>in</strong>g <strong>habitat</strong>and MPS decreased with <strong>in</strong>creas<strong>in</strong>g elevation (Table2), <strong>in</strong>dicat<strong>in</strong>g a greater proportion <strong>of</strong> large, contiguousareas <strong>of</strong> <strong>panda</strong> <strong>habitat</strong> at low elevations. For example,Table 1. Changes <strong>in</strong> <strong>giant</strong> <strong>panda</strong> <strong>habitat</strong> due to the earthquakewith<strong>in</strong> nature reserves and outside nature reservesHabitat loss Habitat loss Ratio RatioLocation (km 2 ) (%) <strong>of</strong> NP <strong>of</strong> MPSLongxi-hongkou NR 70.15 33.7 9.72 0.07Baishuihe NR 78.59 47.8 4.18 0.12Jiud<strong>in</strong>gshan NR 88.99 27.9 3.84 0.19Qianfoshan NR 11.16 15.2 8.61 0.10Inside reserves 248.89 32.5 4.74 0.14Outside reserves 105.11 13.6 4.32 0.20All 354.00 23.0 4.64 0.17Note: Ratio <strong>of</strong> NP presents number <strong>of</strong> patches <strong>in</strong> the post-earthquake period divided by that <strong>of</strong>pre-earthquake. A ratio above 1 means the number <strong>of</strong> patches has <strong>in</strong>creased.The ratio <strong>of</strong> MPS presentsmean patch size <strong>in</strong> the post-earthquake period divided by that <strong>of</strong> pre-earthquake. A ratiobelow 1 means the mean patch size has decreased.© The Ecological Society <strong>of</strong> America www.frontiers<strong>in</strong>ecology.org