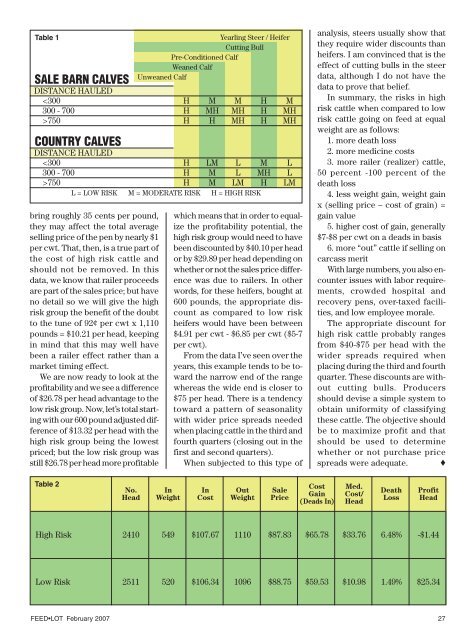
The “Risks” in High Risk CattleThe term high risk cattle is nearly as old as the feedingindustry itself and yet its definition or componentsare vague to many. While we could probably get agreementin the general definition that high risk denotesan expectation of an increased animal health challenge,we would find divergence if asking questionssuch as “Which cattle are high risk?” or “What are thecosts associated with high risk cattle?”If we are in the feeding business, then we are alsoin the business of deciding what animals to put onfeed. We look at the relationships between weight, sex,price, futures markets, season, and expected productioncosts. We likely have a mental adjustment for salebarn vs country origin and perhaps others; but do wehave the true value difference? What are our criteria?Is it maximizing profit potential or do certain biasescome into the equation – heifers, horns, Holsteins, etc?Everyone’s first answer to the question “What costsare associated with high risk cattle?” is more deathloss; then comes more medicine costs, more labor, etc.There are other equally important costs which are seldomidentified. Among these are the number of railers,the difference in cost of gain and total weightThe All-Natural Pelleted CottonseedFeed for Beef CattleA flowable, high bulk density source of fat, fiber,and protein in an easy to handle form. No needto stock separate fat (yellow grease/tallow),protein (meals), and fiber when you can get it allin an easy to mix form! Successful feedlot studiesat Texas Tech and Oklahoma State availableon request – Excellent feed-to-gain and meatquality results and many other benefits! Wholecottonseed in a pellet – what a great idea!FUZ Z TMPELLETS(ALL IN ONE PACKAGE)For Information call: Bob Lundy 901-320-8633For ordering call:North Carolina Plant 252-536-0829Georgia Plant 229-388-8008www.cottonfloz.comby Marc Roth, M.S. P.A.S.gained and differences in market value.The premise of this article is that we have too manyhigh risk cattle in the system and that the reason is thatwe don’t send the correct pricing incentive back to theproducers of these cattle.There’s an old adage which goes, “You won’t improvewhat you don’t measure,” and I believe that summarizesthe situation surrounding high risk cattle. Mostoperators have not actually measured to knowwhether or not their front end price discount actuallyresulted in equalizing the profitability potential on theback end. In order to begin to accumulate this information,it is necessary to have a consistent method ofclassifying the risk status of the cattle. This is the onlyway in which your information will be meaningful. Visualobservation as cattle arrive at the feedyard hasbeen the most common method and is probably theleast useful. While visual observation will tell us if wealready have a “wreck” in progress, it offers little orno assurance as to what will happen in the next fewweeks. Additionally, the buying (i.e., pricing) decisionhas already occurred. We need to know how to classifythe cattle before we bid on them.Table 1 offers an example of how this can be done.These are parameters that you know at purchase. Youcan modify the parameters to better fit your operationor your experience. The point is to cover the bases andhave a template for consistency. Don’t worry a lotabout the intermediate risk cattle. Begin by learningthe differences between the value of those cattle thatare solidly in your high risk and low risk groups. I suggestthat you group your data into close-outs in calendarquarters. This will take out some seasonal variationwhile still leaving large enough numbers to be meaningful.Refer to Table 2 for a typical data set.There are now adjustments to be made. The cattlecome in at different weights, so that must be standardized.Let’s agree to adjust both groups to 600 pounds usinga 5¢ per pound slide. This will have the high riskgroup costing $105.12 per cwt ($107.67 – (51 pounds x5¢)) and the low risk group costing $107.34 per cwt($106.34 + (20 pounds x 5¢)). This tells us that basis 600#the high risk cattle were delivered $2.22 per cwt or$13.32 per head cheaper than the low risk cattle.We next need to look at the sales price. Markets canmove significantly during a quarter and as the distributionof sales, over the quarter, will likely be different,selling price should be standardized. One note ofcaution here – if you know the sales price effect of railers,don’t standardize that away. The number of railer(realizer) cattle will be between 50 percent to 100 percentof the number of dead cattle. Since these railersCircle No. 128 on Reply26 FEED•LOT <strong>February</strong> 2007
Table 1SALE BARN CALVESDISTANCE HAULED750 H H MH H MHCOUNTRY CALVESDISTANCE HAULED750 H M LM H LML = LOW RISK M = MODERATE RISK H = HIGH RISKbring roughly 35 cents per pound,they may affect the total averageselling price of the pen by nearly $1per cwt. That, then, is a true part ofthe cost of high risk cattle andshould not be removed. In thisdata, we know that railer proceedsare part of the sales price; but haveno detail so we will give the highrisk group the benefit of the doubtto the tune of 92¢ per cwt x 1,110pounds = $10.21 per head, keepingin mind that this may well havebeen a railer effect rather than amarket timing effect.We are now ready to look at theprofitability and we see a differenceof $26.78 per head advantage to thelow risk group. Now, let’s total startingwith our 600 pound adjusted differenceof $13.32 per head with thehigh risk group being the lowestpriced; but the low risk group wasstill $26.78 per head more profitableYearling Steer / HeiferCutting BullPre-Conditioned CalfWeaned CalfUnweaned Calfwhich means that in order to equalizethe profitability potential, thehigh risk group would need to havebeen discounted by $40.10 per heador by $29.89 per head depending onwhether or not the sales price differencewas due to railers. In otherwords, for these heifers, bought at600 pounds, the appropriate discountas compared to low riskheifers would have been between$4.91 per cwt - $6.85 per cwt ($5-7per cwt).From the data I’ve seen over theyears, this example tends to be towardthe narrow end of the rangewhereas the wide end is closer to$75 per head. There is a tendencytoward a pattern of seasonalitywith wider price spreads neededwhen placing cattle in the third andfourth quarters (closing out in thefirst and second quarters).When subjected to this type ofanalysis, steers usually show thatthey require wider discounts thanheifers. I am convinced that is theeffect of cutting bulls in the steerdata, although I do not have thedata to prove that belief.In summary, the risks in highrisk cattle when compared to lowrisk cattle going on feed at equalweight are as follows:1. more death loss2. more medicine costs3. more railer (realizer) cattle,50 percent -100 percent of thedeath loss4. less weight gain, weight gainx (selling price – cost of grain) =gain value5. higher cost of gain, generally$7-$8 per cwt on a deads in basis6. more “out” cattle if selling oncarcass meritWith large numbers, you also encounterissues with labor requirements,crowded hospital andrecovery pens, over-taxed facilities,and low employee morale.The appropriate discount forhigh risk cattle probably rangesfrom $40-$75 per head with thewider spreads required whenplacing during the third and fourthquarter. These discounts are withoutcutting bulls. Producersshould devise a simple system toobtain uniformity of classifyingthese cattle. The objective shouldbe to maximize profit and thatshould be used to determinewhether or not purchase pricespreads were adequate. ♦Table 2No. In In Out SaleHead Weight Cost Weight PriceCostGain(Deads In)Med.Cost/HeadDeathLossProfitHeadHigh Risk 2410 549 $107.67 1110 $87.83 $65.78 $33.76 6.48% -$1.44Low Risk 2511 520 $106.34 1096 $88.75 $59.53 $10.98 1.49% $25.34FEED•LOT <strong>February</strong> 2007 27