Arid West Data Form Version 2 - U.S. Army Corps of Engineers
Arid West Data Form Version 2 - U.S. Army Corps of Engineers
Arid West Data Form Version 2 - U.S. Army Corps of Engineers

You also want an ePaper? Increase the reach of your titles
YUMPU automatically turns print PDFs into web optimized ePapers that Google loves.
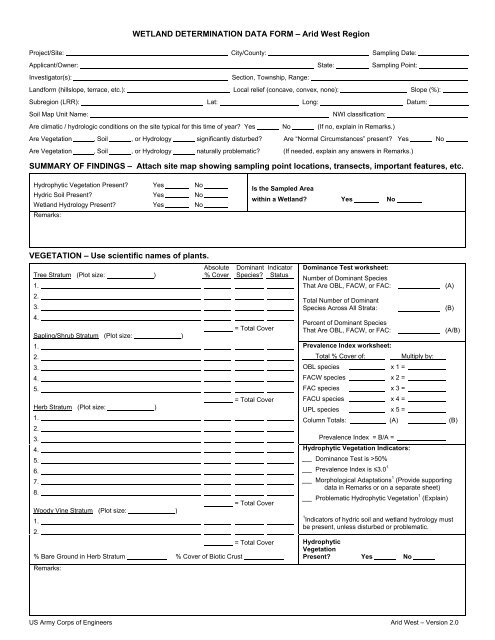
WETLAND DETERMINATION DATA FORM – <strong>Arid</strong> <strong>West</strong> RegionProject/Site: City/County: Sampling Date:Applicant/Owner: State: Sampling Point:Investigator(s):Section, Township, Range:Landform (hillslope, terrace, etc.): Local relief (concave, convex, none): Slope (%):Subregion (LRR): Lat: Long: Datum:Soil Map Unit Name:NWI classification:Are climatic / hydrologic conditions on the site typical for this time <strong>of</strong> year? Yes No (If no, explain in Remarks.)Are Vegetation , Soil , or Hydrology significantly disturbed? Are “Normal Circumstances” present? Yes NoAre Vegetation , Soil , or Hydrology naturally problematic? (If needed, explain any answers in Remarks.)SUMMARY OF FINDINGS – Attach site map showing sampling point locations, transects, important features, etc.Hydrophytic Vegetation Present? Yes NoHydric Soil Present? Yes NoWetland Hydrology Present? Yes NoRemarks:Is the Sampled Areawithin a Wetland? Yes NoVEGETATION – Use scientific names <strong>of</strong> plants.Absolute Dominant IndicatorTree Stratum (Plot size: ) % Cover Species? Status1.2.3.4.= Total CoverSapling/Shrub Stratum (Plot size: )1.2.3.4.5.= Total CoverHerb Stratum (Plot size: )1.2.3.4.5.6.7.8.= Total CoverWoody Vine Stratum (Plot size: )1.2.= Total Cover% Bare Ground in Herb Stratum % Cover <strong>of</strong> Biotic CrustRemarks:Dominance Test worksheet:Number <strong>of</strong> Dominant SpeciesThat Are OBL, FACW, or FAC:Total Number <strong>of</strong> DominantSpecies Across All Strata:Percent <strong>of</strong> Dominant SpeciesThat Are OBL, FACW, or FAC:(A)(B)(A/B)Prevalence Index worksheet:Total % Cover <strong>of</strong>:Multiply by:OBL species x 1 =FACW species x 2 =FAC species x 3 =FACU species x 4 =UPL species x 5 =Column Totals: (A) (B)Prevalence Index = B/A =Hydrophytic Vegetation Indicators:Dominance Test is >50%Prevalence Index is ≤3.0 1Morphological Adaptations 1 (Provide supportingdata in Remarks or on a separate sheet)Problematic Hydrophytic Vegetation 1 (Explain)1Indicators <strong>of</strong> hydric soil and wetland hydrology mustbe present, unless disturbed or problematic.HydrophyticVegetationPresent? Yes NoUS <strong>Army</strong> <strong>Corps</strong> <strong>of</strong> <strong>Engineers</strong> <strong>Arid</strong> <strong>West</strong> – <strong>Version</strong> 2.0
SOILSampling Point:Pr<strong>of</strong>ile Description: (Describe to the depth needed to document the indicator or confirm the absence <strong>of</strong> indicators.)Depth Matrix Redox Features(inches) Color (moist) % Color (moist) % Type 1 Loc 2 Texture Remarks1Type: C=Concentration, D=Depletion, RM=Reduced Matrix, CS=Covered or Coated Sand Grains.2 Location: PL=Pore Lining, M=Matrix.Hydric Soil Indicators: (Applicable to all LRRs, unless otherwise noted.) Indicators for Problematic Hydric Soils 3 :Histosol (A1) Sandy Redox (S5) 1 cm Muck (A9) (LRR C)Histic Epipedon (A2) Stripped Matrix (S6) 2 cm Muck (A10) (LRR B)Black Histic (A3) Loamy Mucky Mineral (F1) Reduced Vertic (F18)Hydrogen Sulfide (A4) Loamy Gleyed Matrix (F2) Red Parent Material (TF2)Stratified Layers (A5) (LRR C) Depleted Matrix (F3) Other (Explain in Remarks)1 cm Muck (A9) (LRR D) Redox Dark Surface (F6)Depleted Below Dark Surface (A11)Depleted Dark Surface (F7)Thick Dark Surface (A12)Redox Depressions (F8)3 Indicators <strong>of</strong> hydrophytic vegetation andSandy Mucky Mineral (S1) Vernal Pools (F9) wetland hydrology must be present,Sandy Gleyed Matrix (S4)unless disturbed or problematic.Restrictive Layer (if present):Type:Depth (inches): Hydric Soil Present? Yes NoRemarks:HYDROLOGYWetland Hydrology Indicators:Primary Indicators (minimum <strong>of</strong> one required; check all that apply)Secondary Indicators (2 or more required)Surface Water (A1) Salt Crust (B11) Water Marks (B1) (Riverine)High Water Table (A2) Biotic Crust (B12) Sediment Deposits (B2) (Riverine)Saturation (A3) Aquatic Invertebrates (B13) Drift Deposits (B3) (Riverine)Water Marks (B1) (Nonriverine) Hydrogen Sulfide Odor (C1) Drainage Patterns (B10)Sediment Deposits (B2) (Nonriverine) Oxidized Rhizospheres along Living Roots (C3) Dry-Season Water Table (C2)Drift Deposits (B3) (Nonriverine) Presence <strong>of</strong> Reduced Iron (C4) Crayfish Burrows (C8)Surface Soil Cracks (B6) Recent Iron Reduction in Tilled Soils (C6) Saturation Visible on Aerial Imagery (C9)Inundation Visible on Aerial Imagery (B7) Thin Muck Surface (C7) Shallow Aquitard (D3)Water-Stained Leaves (B9) Other (Explain in Remarks) FAC-Neutral Test (D5)Field Observations:Surface Water Present? Yes No Depth (inches):Water Table Present? Yes No Depth (inches):Saturation Present? Yes No Depth (inches):Wetland Hydrology Present? Yes No(includes capillary fringe)Describe Recorded <strong>Data</strong> (stream gauge, monitoring well, aerial photos, previous inspections), if available:Remarks:US <strong>Army</strong> <strong>Corps</strong> <strong>of</strong> <strong>Engineers</strong> <strong>Arid</strong> <strong>West</strong> – <strong>Version</strong> 2.0