Hawaii and the Pacific Islands - U.S. Army Corps of Engineers
Hawaii and the Pacific Islands - U.S. Army Corps of Engineers
Hawaii and the Pacific Islands - U.S. Army Corps of Engineers

You also want an ePaper? Increase the reach of your titles
YUMPU automatically turns print PDFs into web optimized ePapers that Google loves.
ERDC/EL TR-12-5Wetl<strong>and</strong>s Regulatory Assistance ProgramRegional Supplement to <strong>the</strong> <strong>Corps</strong><strong>of</strong> <strong>Engineers</strong> Wetl<strong>and</strong> Delineation Manual:Hawai‘i <strong>and</strong> <strong>Pacific</strong> Isl<strong>and</strong>s Region(Version 2.0)U.S. <strong>Army</strong> <strong>Corps</strong> <strong>of</strong> <strong>Engineers</strong> February 2012Environmental LaboratoryApproved for public release; distribution is unlimited.
Wetl<strong>and</strong>s Regulatory Assistance ProgramERDC/EL TR-12-5February 2012Regional Supplement to <strong>the</strong> <strong>Corps</strong> <strong>of</strong> <strong>Engineers</strong>Wetl<strong>and</strong> Delineation Manual: Hawai‘i <strong>and</strong><strong>Pacific</strong> Isl<strong>and</strong>s Region(Version 2.0)U.S. <strong>Army</strong> <strong>Corps</strong> <strong>of</strong> <strong>Engineers</strong>U.S. <strong>Army</strong> Engineer Research <strong>and</strong> Development Center3909 Halls Ferry RoadVicksburg, MS 39180-6199Final reportApproved for public release; distribution is unlimited.Prepared forHeadquarters, U.S. <strong>Army</strong> <strong>Corps</strong> <strong>of</strong> <strong>Engineers</strong>Washington, DC 20314-1000
ERDC/EL TR-12-5iiAbstract: This document is one <strong>of</strong> a series <strong>of</strong> Regional Supplements to<strong>the</strong> <strong>Corps</strong> <strong>of</strong> <strong>Engineers</strong> Wetl<strong>and</strong> Delineation Manual, which providestechnical guidance <strong>and</strong> procedures for identifying <strong>and</strong> delineating wetl<strong>and</strong>sthat may be subject to regulatory jurisdiction under Section 404 <strong>of</strong><strong>the</strong> Clean Water Act or Section 10 <strong>of</strong> <strong>the</strong> Rivers <strong>and</strong> Harbors Act. Thedevelopment <strong>of</strong> Regional Supplements is part <strong>of</strong> a nationwide effort toaddress regional wetl<strong>and</strong> characteristics <strong>and</strong> improve <strong>the</strong> accuracy <strong>and</strong>efficiency <strong>of</strong> wetl<strong>and</strong>-delineation procedures. This supplement is applicableto <strong>the</strong> Hawai‘i <strong>and</strong> <strong>Pacific</strong> Isl<strong>and</strong>s Region, which consists <strong>of</strong> <strong>the</strong> state<strong>of</strong> Hawai‘i, <strong>the</strong> Territory <strong>of</strong> Guam, <strong>the</strong> Commonwealth <strong>of</strong> <strong>the</strong> Nor<strong>the</strong>rnMariana Isl<strong>and</strong>s, <strong>and</strong> <strong>the</strong> Territory <strong>of</strong> American Samoa.DISCLAIMER: The contents <strong>of</strong> this report are not to be used for advertising, publication, or promotional purposes.Citation <strong>of</strong> trade names does not constitute an <strong>of</strong>ficial endorsement or approval <strong>of</strong> <strong>the</strong> use <strong>of</strong> such commercial products.All product names <strong>and</strong> trademarks cited are <strong>the</strong> property <strong>of</strong> <strong>the</strong>ir respective owners. The findings <strong>of</strong> this report are not tobe construed as an <strong>of</strong>ficial Department <strong>of</strong> <strong>the</strong> <strong>Army</strong> position unless so designated by o<strong>the</strong>r authorized documents.DESTROY THIS REPORT WHEN NO LONGER NEEDED. DO NOT RETURN IT TO THE ORIGINATOR.
ERDC/EL TR-12-5iiiContentsFigures <strong>and</strong> Tables ................................................................................................................................. viPreface ....................................................................................................................................................ix1 Introduction ..................................................................................................................................... 1Purpose <strong>and</strong> use <strong>of</strong> this regional supplement ........................................................................ 1Applicable region ...................................................................................................................... 3Physical <strong>and</strong> biological characteristics <strong>of</strong> <strong>the</strong> region ............................................................. 3The <strong>Hawaii</strong>an Isl<strong>and</strong>s ................................................................................................................... 6Guam <strong>and</strong> <strong>the</strong> Nor<strong>the</strong>rn Mariana Isl<strong>and</strong>s ................................................................................... 7American Samoa .......................................................................................................................... 9Types <strong>and</strong> distribution <strong>of</strong> wetl<strong>and</strong>s .......................................................................................... 92 Hydrophytic Vegetation Indicators ............................................................................................. 13Introduction ............................................................................................................................ 13Guidance on vegetation sampling <strong>and</strong> analysis ................................................................... 14Definitions <strong>of</strong> strata ................................................................................................................... 17Hydrophytic vegetation indicators ......................................................................................... 17Procedure ................................................................................................................................... 18Indicator 1: Rapid test for hydrophytic vegetation ................................................................... 19Indicator 2: Dominance test ...................................................................................................... 19Indicator 3: Prevalence index .................................................................................................... 223 Hydric Soil Indicators ................................................................................................................... 25Introduction ............................................................................................................................ 25Concepts ................................................................................................................................. 26Iron <strong>and</strong> manganese reduction, translocation, <strong>and</strong> accumulation ......................................... 26Sulfate reduction ........................................................................................................................ 27Organic matter accumulation .................................................................................................... 27Cautions .................................................................................................................................. 30Procedures for sampling soils ............................................................................................... 30Observe <strong>and</strong> document <strong>the</strong> site ................................................................................................ 30Observe <strong>and</strong> document <strong>the</strong> soil ................................................................................................ 32Use <strong>of</strong> existing soil data ......................................................................................................... 34Soil surveys ................................................................................................................................. 34Hydric soils lists .......................................................................................................................... 34Hydric soil indicators .............................................................................................................. 35All soils ........................................................................................................................................ 37Indicator A1: Histosol ..................................................................................................... 38Indicator A2: Histic Epipedon ........................................................................................ 39Indicator A3: Black Histic ............................................................................................... 40Indicator A4: Hydrogen Sulfide ...................................................................................... 40Indicator A8: Muck Presence ......................................................................................... 41
ERDC/EL TR-12-5ivIndicator A11: Depleted Below Dark Surface ............................................................... 41Indicator A12: Thick Dark Surface ................................................................................ 42S<strong>and</strong>y soils .................................................................................................................................. 44Indicator S4: S<strong>and</strong>y Gleyed Matrix ................................................................................ 44Indicator S5: S<strong>and</strong>y Redox............................................................................................. 45Indicator S7: Dark Surface ............................................................................................ 46Loamy <strong>and</strong> clayey soils .............................................................................................................. 47Indicator F2: Loamy Gleyed Matrix ................................................................................ 47Indicator F3: Depleted Matrix ........................................................................................ 48Indicator F6: Redox Dark Surface ................................................................................. 50Indicator F7: Depleted Dark Surface ............................................................................. 51Indicator F8: Redox Depressions .................................................................................. 52Hydric soil indicators for problem soils ................................................................................. 52Indicator A5: Stratified Layers ....................................................................................... 53Indicator S1: S<strong>and</strong>y Mucky Mineral .............................................................................. 54Indicator F21: Red Parent Material ............................................................................... 54Indicator TF12: Very Shallow Dark Surface .................................................................. 554 Wetl<strong>and</strong> Hydrology Indicators ..................................................................................................... 56Introduction ............................................................................................................................ 56Growing season ...................................................................................................................... 58Wetl<strong>and</strong> hydrology indicators ................................................................................................. 58Group A – Observation <strong>of</strong> Surface Water or Saturated Soils ................................................... 60Indicator A1: Surface water ........................................................................................... 60Indicator A2: High water table ....................................................................................... 61Indicator A3: Saturation ................................................................................................. 62Group B – Evidence <strong>of</strong> Recent Inundation ............................................................................... 63Indicator B1: Water marks ............................................................................................. 63Indicator B2: Sediment deposits ................................................................................... 64Indicator B3: Drift deposits ............................................................................................ 65Indicator B4: Algal mat or crust ..................................................................................... 66Indicator B5: Iron deposits ............................................................................................ 68Indicator B7: Inundation visible on aerial imagery ....................................................... 68Indicator B9: Water-stained leaves ............................................................................... 70Indicator B13: Aquatic fauna ......................................................................................... 72Indicator B17: Tilapia nests ........................................................................................... 74Indicator B6: Surface soil cracks ................................................................................... 75Indicator B8: Sparsely vegetated concave surface ...................................................... 76Indicator B10: Drainage patterns .................................................................................. 77Group C – Evidence <strong>of</strong> Current or Recent Soil Saturation ....................................................... 78Indicator C1: Hydrogen sulfide odor .............................................................................. 78Indicator C3: Oxidized rhizospheres along living roots................................................. 79Indicator C4: Presence <strong>of</strong> reduced iron ........................................................................ 80Indicator C6: Recent iron reduction in tilled soils ........................................................ 81Indicator C7: Thin muck surface ................................................................................... 83Indicator C10: Fiddler crab burrows .............................................................................. 83Indicator C2: Dry-season water table ............................................................................ 84Indicator C5: Salt deposits ............................................................................................. 85Group D – Evidence from O<strong>the</strong>r Site Conditions or Data ......................................................... 86
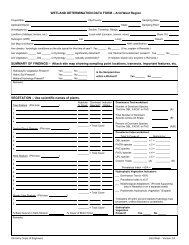
ERDC/EL TR-12-5vIndicator D1: Stunted or stressed plants ...................................................................... 86Indicator D2: Geomorphic position ............................................................................... 87Indicator D3: Shallow aquitard ...................................................................................... 88Indicator D5: FAC-neutral test ....................................................................................... 895 Difficult Wetl<strong>and</strong> Situations in <strong>the</strong> Hawai‘i <strong>and</strong> <strong>Pacific</strong> Isl<strong>and</strong>s Region ................................ 91Introduction ............................................................................................................................ 91L<strong>and</strong>s used for agriculture ..................................................................................................... 92Problematic hydrophytic vegetation ...................................................................................... 95Description <strong>of</strong> <strong>the</strong> problem ........................................................................................................ 95Procedure ................................................................................................................................... 95Problematic hydric soils ....................................................................................................... 100Description <strong>of</strong> <strong>the</strong> problem ...................................................................................................... 100Soils with faint or no indicators ................................................................................... 100Soils with relict or induced hydric soil indicators ....................................................... 102Procedure ................................................................................................................................. 104Wetl<strong>and</strong>s that periodically lack indicators <strong>of</strong> wetl<strong>and</strong> hydrology ....................................... 107Description <strong>of</strong> <strong>the</strong> problem ...................................................................................................... 107Procedure ................................................................................................................................. 108Wetl<strong>and</strong>/non-wetl<strong>and</strong> mosaics ............................................................................................ 113Description <strong>of</strong> <strong>the</strong> problem ...................................................................................................... 113Procedure ................................................................................................................................. 114References ......................................................................................................................................... 116Appendix A: Glossary ........................................................................................................................ 120Appendix B: Point-Intercept Sampling Procedure for Determining HydrophyticVegetation .................................................................................................................................. 126Appendix C: Data Form .................................................................................................................... 128Report Documentation Page
ERDC/EL TR-12-5viFigures <strong>and</strong> TablesFiguresFigure 1. Location map <strong>of</strong> <strong>the</strong> Hawai‘i <strong>and</strong> <strong>Pacific</strong> Isl<strong>and</strong>s Region. ....................................................... 4Figure 2. Principal isl<strong>and</strong>s <strong>of</strong> <strong>the</strong> Hawai‘i <strong>and</strong> <strong>Pacific</strong> Isl<strong>and</strong>s Region. .................................................. 5Figure 3. Coastal wetl<strong>and</strong> on Kaua‘i dominated by Batis maritima <strong>and</strong> mangroves. Photocourtesy <strong>of</strong> <strong>the</strong> U.S. Fish <strong>and</strong> Wildlife Service. ...................................................................................... 10Figure 4. Aerial view <strong>of</strong> <strong>the</strong> Alakai Swamp, Kaua‘i, showing both forested <strong>and</strong> montanebog wetl<strong>and</strong>s. Photo courtesy <strong>of</strong> <strong>the</strong> U.S. Fish <strong>and</strong> Wildlife Service. ................................................... 12Figure 5. A soil sample from <strong>the</strong> Isl<strong>and</strong> <strong>of</strong> Hawai‘i containing structured (subangularblocky) sapric, folistic material at <strong>the</strong> surface <strong>and</strong> unstructured (homogeneous) sapricmaterial below. Only <strong>the</strong> unstructured sapric material (muck) indicates soil saturation. ................. 28Figure 6. Divergent slopes (A) disperse surface water, whereas convergent slopes (B)concentrate water. Surface flow paths are indicated by <strong>the</strong> arrows. .................................................. 31Figure 7. At <strong>the</strong> toe <strong>of</strong> a hill slope, <strong>the</strong> gradient is only slightly inclined or nearly level. Bluearrows represent flow paths <strong>of</strong> surface water <strong>and</strong> groundwater ......................................................... 32Figure 8. Example <strong>of</strong> a Histosol, in which muck (sapric soil material) is greater than 3 ft(0.9 m) thick.............................................................................................................................................. 38Figure 9. Thin organic soils (primarily Folists) are common over lava bedrock on <strong>the</strong> Isl<strong>and</strong><strong>of</strong> Hawai‘i. However, saturated Histosols can be found on pāhoehoe flows in scattereddepressions that trap <strong>and</strong> hold water. ................................................................................................... 39Figure 10. In this soil, <strong>the</strong> organic surface layer is about 9 in. (23 cm) thick. Scale is incentimeters. .............................................................................................................................................. 39Figure 11. In this soil, a depleted matrix starts immediately below <strong>the</strong> black surface layerat approximately 11 in. (28 cm). Scale is in centimeters. .................................................................... 42Figure 12. Deep observations may be necessary to identify <strong>the</strong> depleted or gleyed matrixbelow a thick, dark surface layer. In this example, <strong>the</strong> depleted matrix starts at 20 in. ................... 43Figure 13. In this example, <strong>the</strong> gleyed matrix begins at <strong>the</strong> soil surface. Scale is in incheson <strong>the</strong> right. ............................................................................................................................................... 44Figure 14. Redox concentrations (orange areas) in loamy fine s<strong>and</strong> on <strong>the</strong> Isl<strong>and</strong> <strong>of</strong> O‘ahu. .......... 45Figure 15. This s<strong>and</strong>y soil has a dark surface approximately 6 in. (15 cm) thick (bottomindicated by <strong>the</strong> arrow). Scale is in inches on <strong>the</strong> right side <strong>of</strong> <strong>the</strong> ruler. ............................................ 46Figure 16. In this soil, a gleyed matrix begins immediately below <strong>the</strong> dark surface layer. ................ 48Figure 17. Example <strong>of</strong> indicator F3 (Depleted Matrix), in which redox concentrationsextend nearly to <strong>the</strong> surface. ................................................................................................................... 49Figure 18. This soil has a depleted matrix with redox concentrations in a low-chromamatrix. ........................................................................................................................................................ 49Figure 19. Redox features can be small <strong>and</strong> difficult to see within a dark soil layer. ........................ 50Figure 20. Redox depletions (lighter colored areas) are scattered within <strong>the</strong> darker matrix.Scale is in centimeters. ............................................................................................................................ 51Figure 21. In this example, <strong>the</strong> layer <strong>of</strong> redox concentrations begins at <strong>the</strong> soil surface<strong>and</strong> is slightly more than 2 in. (5 cm) thick. ........................................................................................... 52
ERDC/EL TR-12-5viiFigure 22. Stratified layers in loamy material. Scale is in inches on <strong>the</strong> right. ................................... 53Figure 23. Stratified layers in s<strong>and</strong>y material. Scale is in inches on <strong>the</strong> right side <strong>of</strong> ruler. .............. 53Figure 24. This mucky modified, s<strong>and</strong>y surface layer is approximately 3 in. (7.5 cm) thick.Scale in inches on <strong>the</strong> right side <strong>of</strong> ruler. ............................................................................................... 54Figure 25. A wetl<strong>and</strong> with surface water present, Waipi‘o Valley, Hawai‘i. ......................................... 60Figure 26. High water table observed in a soil pit. ................................................................................ 61Figure 27. Water glistens on <strong>the</strong> surface <strong>of</strong> a saturated soil sample. ................................................. 62Figure 28. Water marks on rocks in a seasonally ponded depression. .............................................. 63Figure 29. Water marks (dark stains) on trees in a seasonally inundated wetl<strong>and</strong>. The top<strong>of</strong> one water mark is indicated by <strong>the</strong> arrow. ......................................................................................... 64Figure 30. Silt deposit left after a recent high-water event forms a tan coating on <strong>the</strong>setree trunks. ................................................................................................................................................ 64Figure 31. Drift material caught on a fence <strong>and</strong> in low vegetation in a coastal wetl<strong>and</strong>. ................. 65Figure 32. Algal mat in a recently ponded depression, Kawainui Marsh, O‘ahu. .............................. 66Figure 33. Drying algal mat surrounding a ponded depression near <strong>the</strong> Saddle Road,Isl<strong>and</strong> <strong>of</strong> Hawai‘i. ...................................................................................................................................... 67Figure 34. Dried crust <strong>of</strong> blue-green algae that has cracked <strong>and</strong> curled. .......................................... 67Figure 35. Iron sheen on <strong>the</strong> water surface may be deposited as an orange or yellow crustafter dewatering. ...................................................................................................................................... 68Figure 36. Iron deposit (reddish area) in a taro patch. ......................................................................... 69Figure 37. Aerial photograph showing inundation within an emergent wetl<strong>and</strong> in <strong>the</strong>Ko‘olau Mountains on O‘ahu. ................................................................................................................. 69Figure 38. Water-stained leaves in a coastal wetl<strong>and</strong>. ......................................................................... 71Figure 39. Water-stained hau (Hibiscus tiliaceus) leaves at Kawainui Marsh, O‘ahu. ...................... 71Figure 40. Remains <strong>of</strong> fiddler crabs (Uca spp.) in a coastal wetl<strong>and</strong>. Fiddler crabs arefound in American Samoa, Guam, <strong>and</strong> <strong>the</strong> Nor<strong>the</strong>rn Mariana Isl<strong>and</strong>s, <strong>and</strong> are not knownto occur in <strong>the</strong> <strong>Hawaii</strong>an Isl<strong>and</strong>s. ............................................................................................................ 72Figure 41. Aquatic snails in a coastal wetl<strong>and</strong>. ..................................................................................... 73Figure 42. Dead fish in a dried pool near Wai‘anae, O‘ahu. ................................................................ 73Figure 43. Cluster <strong>of</strong> tilapia nests in a shallow pond. ............................................................................74Figure 44. Tilapia nest along <strong>the</strong> fringe <strong>of</strong> a drying pool near Wai‘anae, O‘ahu. ............................... 75Figure 45. Surface soil cracks (<strong>and</strong> drift material) in a coastal wetl<strong>and</strong>. ........................................... 76Figure 46. A sparsely vegetated depression in Batis-dominated coastal flats, nor<strong>the</strong>rnO‘ahu. ........................................................................................................................................................ 77Figure 47. Vegetation bent over in <strong>the</strong> direction <strong>of</strong> water flow across a stream terrace. .................. 78Figure 48. Iron-oxide plaque (orange coating) on a living root. Iron also coats <strong>the</strong> channelor pore from which <strong>the</strong> root was removed. ............................................................................................ 79Figure 49. Soil with oxidized rhizospheres surrounding many fine roots. ........................................... 80Figure 50. When alpha, alpha-dipyridyl is applied to a soil containing reduced iron, apositive reaction is indicated by a pink or red coloration to <strong>the</strong> treated area. ................................... 81Figure 51. Redox concentrations in <strong>the</strong> tilled surface layer <strong>of</strong> a recently cultivated soil. .................. 82Figure 52. Fiddler crab burrows <strong>and</strong> excavated soil. ............................................................................ 84Figure 53. Salt deposits (light-colored areas) on coastal flats near Wai‘anae, O‘ahu. ..................... 85
ERDC/EL TR-12-5viiiFigure 54. Salt deposit at Kanahā Ponds, Maui. .................................................................................. 86Figure 55. Stunted ‘ōhi‘a in Lehua Bog, Kaua‘i..................................................................................... 87Figure 56. Low areas behind coastal beach berms <strong>of</strong>ten exhibit wetl<strong>and</strong> hydrology. ....................... 88Figure 57. Contact between surface soil <strong>and</strong> underlying saprolite for a soil on Guam. Saprolitecan be a physical barrier to roots <strong>and</strong> <strong>of</strong>ten acts as an aquitard, perching water above it. ..................... 89Figure 58. Procedure <strong>and</strong> example <strong>of</strong> <strong>the</strong> FAC-neutral test. This example uses <strong>the</strong> samevegetation data as in Table 3. ................................................................................................................. 90Figure 59. Effects <strong>of</strong> ditches (upper) <strong>and</strong> parallel subsurface drainage lines (lower) on <strong>the</strong>water table. ............................................................................................................................................... 92Figure 60. This soil exhibits colors associated with reducing conditions. Scale is 1 cm. ............... 106Figure 61. The same soil as in Figure 60 after exposure to <strong>the</strong> air <strong>and</strong> oxidation hasoccurred. ................................................................................................................................................. 106Figure A1. Illustration <strong>of</strong> values <strong>and</strong> chromas that require 2 percent or more distinct orprominent redox concentrations <strong>and</strong> those that do not, for hue 10YR, to meet <strong>the</strong>definition <strong>of</strong> a depleted matrix. Due to inaccurate color reproduction, do not use this pageto determine soil colors in <strong>the</strong> field. Background image from <strong>the</strong> Munsell Soil Color Chartsreprinted courtesy <strong>of</strong> Munsell Color Services Lab, a part <strong>of</strong> X-Rite, Inc. ........................................... 123Figure A2. For hydric soil determinations, a gleyed matrix has <strong>the</strong> hues <strong>and</strong> chromaidentified in this illustration with a value <strong>of</strong> 4 or more. Due to inaccurate colorreproduction, do not use this page to determine soil colors in <strong>the</strong> field. Background imagefrom <strong>the</strong> Munsell Soil Color Charts reprinted courtesy <strong>of</strong> Munsell Color Services Lab, apart <strong>of</strong> X-Rite, Inc. ................................................................................................................................... 124TablesTable 1. Sections <strong>of</strong> <strong>the</strong> <strong>Corps</strong> Manual replaced by this Regional Supplement forapplications in <strong>the</strong> Hawai‘i <strong>and</strong> <strong>Pacific</strong> Isl<strong>and</strong>s Region. ......................................................................... 2Table 2. Selected references to additional vegetation sampling approaches that could beused in wetl<strong>and</strong> delineation. ................................................................................................................... 16Table 3. Example <strong>of</strong> <strong>the</strong> selection <strong>of</strong> dominant species by <strong>the</strong> 50/20 rule <strong>and</strong>determination <strong>of</strong> hydrophytic vegetation by <strong>the</strong> dominance test. ....................................................... 21Table 4. Example <strong>of</strong> <strong>the</strong> prevalence index using <strong>the</strong> same data as in Table 3. ................................. 24Table 5. Proportion <strong>of</strong> sample consisting <strong>of</strong> fibers visible with a h<strong>and</strong> lens. ...................................... 28Table 6. Determination <strong>of</strong> degree <strong>of</strong> decomposition <strong>of</strong> organic materials. ........................................ 29Table 7. Minimum thickness requirements for commonly combined indicators in <strong>the</strong>Hawai‘i <strong>and</strong> <strong>Pacific</strong> Isl<strong>and</strong>s Region. ........................................................................................................ 36Table 8. Example <strong>of</strong> a soil that is hydric based on a combination <strong>of</strong> indicators F6 <strong>and</strong> F3. ............. 36Table 9. Example <strong>of</strong> a soil that is hydric based on a combination <strong>of</strong> indicators F6 <strong>and</strong> S5. ............. 37Table 10. Wetl<strong>and</strong> hydrology indicators for <strong>the</strong> Hawai‘i <strong>and</strong> <strong>Pacific</strong> Isl<strong>and</strong>s Region. ......................... 59Table A1. Tabular key for contrast determinations using Munsell notation...................................... 121
ERDC/EL TR-12-5ixPrefaceThis document is one <strong>of</strong> a series <strong>of</strong> Regional Supplements to <strong>the</strong> <strong>Corps</strong> <strong>of</strong><strong>Engineers</strong> Wetl<strong>and</strong> Delineation Manual. It was developed by <strong>the</strong> U.S. <strong>Army</strong>Engineer Research <strong>and</strong> Development Center (ERDC) at <strong>the</strong> request <strong>of</strong>Headquarters, U.S. <strong>Army</strong> <strong>Corps</strong> <strong>of</strong> <strong>Engineers</strong> (USACE), with fundingprovided through <strong>the</strong> Wetl<strong>and</strong>s Regulatory Assistance Program (WRAP).This is Version 2.0 <strong>of</strong> <strong>the</strong> Hawai‘i <strong>and</strong> <strong>Pacific</strong> Isl<strong>and</strong>s Regional Supplement;it replaces <strong>the</strong> “interim” version, which was published in May 2010.This document was developed in cooperation with <strong>the</strong> Hawai‘i <strong>and</strong> <strong>Pacific</strong>Isl<strong>and</strong>s Regional Working Group. Working Group meetings were held inHonolulu, HI, from 16-18 September 2008 <strong>and</strong> 11-12 February 2009.Members <strong>of</strong> <strong>the</strong> Regional Working Group <strong>and</strong> contributors to this documentwere:Jacob Berkowitz, Project Leader <strong>and</strong> Working Group Chair, EnvironmentalLaboratory (EL), ERDC, Vicksburg, MSRobert Lichvar, Chair, Vegetation Subcommittee, Cold RegionsResearch <strong>and</strong> Engineering Laboratory, ERDC, Hanover, NHChris Noble, Chair, Soils Subcommittee, EL, ERDC, Vicksburg, MSJames Wakeley, EL, ERDC, Vicksburg, MSGreg Brul<strong>and</strong>, University <strong>of</strong> Hawai‘i at Mānoa, Honolulu, HIBenton Ching, U.S. <strong>Army</strong> Engineer District, Honolulu, HIMichelle Clark, U.S. Fish <strong>and</strong> Wildlife Service, Kapa‘a, HIFrank Dayton, U.S. <strong>Army</strong> Engineer Honolulu District, GuamRegulatory Office, GUFern Duvall, Hawai‘i Department <strong>of</strong> L<strong>and</strong> <strong>and</strong> Natural Resources,Wailuku, HITerrell Erickson, U.S. Department <strong>of</strong> Agriculture (USDA) NaturalResources Conservation Service, Washington, DCRobert Gavenda, USDA Natural Resources Conservation Service,Mongmong, GUChris Jasper, USDA Natural Resources Conservation Service,Honolulu, HIGregory Koob, USDA Natural Resources Conservation Service,Honolulu, HIPaula Levin, U.S. Fish <strong>and</strong> Wildlife Service, Honolulu, HI
ERDC/EL TR-12-5xTony Rolfes, USDA Natural Resources Conservation Service, Honolulu,HILolly Silva, U.S. <strong>Army</strong> Engineer District, Honolulu, HIChristopher Smith, USDA Natural Resources Conservation Service,Washington, DCGordon Smith, U.S. Fish <strong>and</strong> Wildlife Service, Honolulu, HIWendy Wiltse, U.S. Environmental Protection Agency, Honolulu, HITechnical reviews were provided by <strong>the</strong> following members <strong>of</strong> <strong>the</strong> NationalAdvisory Team for Wetl<strong>and</strong> Delineation: Steve Eggers, U.S. <strong>Army</strong> Engineer(USAE) District, St. Paul, MN; David Howard, USDA Natural ResourcesConservation Service (NRCS), Washington, DC; Karl Hipple, NRCSNational Soil Survey Center, Lincoln, NE; Dan Martel, USAE District, SanFrancisco, CA; Jennifer McCarthy, USAE District, New Engl<strong>and</strong>, Concord,MA; Norman Melvin, NRCS National Wetl<strong>and</strong> Team, Fort Worth, TX; PaulMinkin, USAE District, New Engl<strong>and</strong>, Concord, MA; Stuart Santos, USAEDistrict, Jacksonville, FL; Ralph Spagnolo, U.S. Environmental ProtectionAgency (EPA) Region 3, Philadelphia, PA; Mary Anne Thiesing, EPA Region10, Seattle, WA; Ralph Tiner, U.S. Fish <strong>and</strong> Wildlife Service, Hadley, MA;<strong>and</strong> James Wood, USAE District, Albuquerque, NM. In addition, portions <strong>of</strong>this Regional Supplement addressing soils issues were reviewed <strong>and</strong>endorsed by <strong>the</strong> National Technical Committee for Hydric Soils(Christopher W. Smith, chair).Independent peer reviews were performed in accordance with Office <strong>of</strong>Management <strong>and</strong> Budget guidelines. The peer-review team consisted <strong>of</strong>Mike Lee, USAE Institute for Water Resources, Alex<strong>and</strong>ria, VA (Chair);Claudine Camacho, Dueñas, Camacho & Associates, Inc., Hagåtña, GU;Susan M. Carstenn, Hawai‘i <strong>Pacific</strong> University <strong>and</strong> Tetra Tech, Inc.,Honolulu, HI; Mark W. Defley, USDA Natural Resources ConservationService, Mongmong, GU; Eric B. Guin<strong>the</strong>r, AECOS, Inc., Kane‘ohe, HI;Robert W. Hobdy, Hawai‘i Department <strong>of</strong> L<strong>and</strong> <strong>and</strong> Natural Resources,Haiku, HI; Penny Levin, Wailuku, HI; <strong>and</strong> Ron Terry, GeometricianAssociates, LLC, Hilo, HI.Technical editors for this Regional Supplement were Jacob F. Berkowitz,Robert W. Lichvar, Chris V. Noble, <strong>and</strong> Dr. James S. Wakeley, ERDC.Karen C. Mulligan was <strong>the</strong> project proponent <strong>and</strong> coordinator atHeadquarters, USACE. During <strong>the</strong> conduct <strong>of</strong> this work, Pat O’Brien wasChief <strong>of</strong> <strong>the</strong> Wetl<strong>and</strong>s <strong>and</strong> Coastal Ecology Branch; Dr. Edmond Russo was
ERDC/EL TR-12-5xiChief, Ecosystem Evaluation <strong>and</strong> Engineering Division; Sally Yost wasProgram Manager, WRAP; <strong>and</strong> Dr. Elizabeth Fleming was Director, EL.COL Kevin J. Wilson was Comm<strong>and</strong>er <strong>of</strong> ERDC. Dr. Jeffery P. Holl<strong>and</strong>was Director.The correct citation for this document is:U.S. <strong>Army</strong> <strong>Corps</strong> <strong>of</strong> <strong>Engineers</strong>. 2012. Regional Supplement to <strong>the</strong> <strong>Corps</strong> <strong>of</strong><strong>Engineers</strong> Wetl<strong>and</strong> Delineation Manual: Hawai‘i <strong>and</strong> <strong>Pacific</strong> Isl<strong>and</strong>sRegion Version 2.0, ed. J. F. Berkowitz, J. S. Wakeley, R. W. Lichvar, <strong>and</strong>C. V. Noble. ERDC/EL TR-12-5. Vicksburg, MS: U.S. <strong>Army</strong> EngineerResearch <strong>and</strong> Development Center.
ERDC/EL TR-12-5 11 IntroductionPurpose <strong>and</strong> use <strong>of</strong> this regional supplementThis document is one <strong>of</strong> a series <strong>of</strong> Regional Supplements to <strong>the</strong> <strong>Corps</strong> <strong>of</strong><strong>Engineers</strong> Wetl<strong>and</strong> Delineation Manual (hereafter called <strong>the</strong> <strong>Corps</strong>Manual). The <strong>Corps</strong> Manual provides technical guidance <strong>and</strong> procedures,from a national perspective, for identifying <strong>and</strong> delineating wetl<strong>and</strong>s thatmay be subject to regulatory jurisdiction under Section 404 <strong>of</strong> <strong>the</strong> CleanWater Act (33 U.S.C. 1344) or Section 10 <strong>of</strong> <strong>the</strong> Rivers <strong>and</strong> Harbors Act(33 U.S.C. 403). According to <strong>the</strong> <strong>Corps</strong> Manual, identification <strong>of</strong> wetl<strong>and</strong>sis based on a three-factor approach involving indicators <strong>of</strong> hydrophyticvegetation, hydric soil, <strong>and</strong> wetl<strong>and</strong> hydrology. This Regional Supplementpresents wetl<strong>and</strong> indicators, delineation guidance, <strong>and</strong> o<strong>the</strong>r informationthat is specific to <strong>the</strong> Hawai‘i <strong>and</strong> <strong>Pacific</strong> Isl<strong>and</strong>s Region.This Regional Supplement is part <strong>of</strong> a nationwide effort to address regionalwetl<strong>and</strong> characteristics <strong>and</strong> improve <strong>the</strong> accuracy <strong>and</strong> efficiency <strong>of</strong> wetl<strong>and</strong>delineationprocedures. Regional differences in climate, geology, soils,hydrology, plant <strong>and</strong> animal communities, <strong>and</strong> o<strong>the</strong>r factors are importantto <strong>the</strong> identification <strong>and</strong> functioning <strong>of</strong> wetl<strong>and</strong>s. These differences cannotbe considered adequately in a single national manual. The development <strong>of</strong>this supplement follows National Academy <strong>of</strong> Sciences recommendations toincrease <strong>the</strong> regional sensitivity <strong>of</strong> wetl<strong>and</strong>-delineation methods (NationalResearch Council 1995). The intent <strong>of</strong> this supplement is to bring <strong>the</strong> <strong>Corps</strong>Manual up-to-date with current knowledge <strong>and</strong> practice in <strong>the</strong> region. Theprocedures given in <strong>the</strong> <strong>Corps</strong> Manual, in combination with wetl<strong>and</strong>indicators <strong>and</strong> guidance provided in this supplement, can be used toidentify wetl<strong>and</strong>s for a number <strong>of</strong> purposes, including resource inventories,management plans, <strong>and</strong> regulatory programs. The determination that awetl<strong>and</strong> is subject to regulatory jurisdiction under Section 404 or Section 10must be made independently <strong>of</strong> procedures described in this supplement.This Regional Supplement is designed for use with <strong>the</strong> current version <strong>of</strong><strong>the</strong> <strong>Corps</strong> Manual (Environmental Laboratory 1987) <strong>and</strong> all subsequentversions. Where differences in <strong>the</strong> two documents occur, this RegionalSupplement takes precedence over <strong>the</strong> <strong>Corps</strong> Manual for applications in<strong>the</strong> Hawai‘i <strong>and</strong> <strong>Pacific</strong> Isl<strong>and</strong>s Region. Table 1 identifies specific sections<strong>of</strong> <strong>the</strong> <strong>Corps</strong> Manual that are replaced by this supplement. O<strong>the</strong>r guidance
ERDC/EL TR-12-5 2ItemTable 1. Sections <strong>of</strong> <strong>the</strong> <strong>Corps</strong> Manual replaced by this Regional Supplementfor applications in <strong>the</strong> Hawai‘i <strong>and</strong> <strong>Pacific</strong> Isl<strong>and</strong>s Region.Hydrophytic VegetationIndicatorsHydric Soil IndicatorsWetl<strong>and</strong> HydrologyIndicatorsGrowing Season Definition GlossaryHydrology St<strong>and</strong>ard forHighly Disturbed orProblematic Wetl<strong>and</strong>SituationsReplaced Portions <strong>of</strong> <strong>the</strong> <strong>Corps</strong>Manual (EnvironmentalLaboratory 1987)Paragraph 35, all subparts, <strong>and</strong>all references to specificindicators in Part IVParagraphs 44 <strong>and</strong> 45, allsubparts, <strong>and</strong> all references tospecific indicators in Part IVParagraph 49(b), all subparts,<strong>and</strong> all references to specificindicators in Part IVParagraph 48, including Table 5<strong>and</strong> <strong>the</strong> accompanying UserNote in <strong>the</strong> online version <strong>of</strong> <strong>the</strong>ManualReplacement Guidance(this Supplement)Chapter 2Chapter 3Chapter 4Chapter 4, Growing Season;GlossaryChapter 5, Wetl<strong>and</strong>s thatPeriodically Lack Indicators<strong>of</strong> Wetl<strong>and</strong> Hydrology,Procedure item 3(g)<strong>and</strong> procedures given in this supplement <strong>and</strong> not listed in Table 1 areintended to augment <strong>the</strong> <strong>Corps</strong> Manual but not necessarily to replace it.The <strong>Corps</strong> <strong>of</strong> <strong>Engineers</strong> has final authority over <strong>the</strong> use <strong>and</strong> interpretation<strong>of</strong> <strong>the</strong> <strong>Corps</strong> Manual <strong>and</strong> this supplement in <strong>the</strong> Hawai‘i <strong>and</strong> <strong>Pacific</strong>Isl<strong>and</strong>s Region.Indicators <strong>and</strong> procedures given in this Supplement are designed to identifywetl<strong>and</strong>s as defined jointly by <strong>the</strong> <strong>Corps</strong> <strong>of</strong> <strong>Engineers</strong> (33 CFR 328.3) <strong>and</strong>Environmental Protection Agency (40 CFR 230.3). Wetl<strong>and</strong>s are a subset <strong>of</strong><strong>the</strong> “waters <strong>of</strong> <strong>the</strong> United States” that may be subject to regulation underSection 404. One key feature <strong>of</strong> <strong>the</strong> definition <strong>of</strong> wetl<strong>and</strong>s is that, undernormal circumstances, <strong>the</strong>y support “a prevalence <strong>of</strong> vegetation typicallyadapted for life in saturated soil conditions.” Many waters <strong>of</strong> <strong>the</strong> UnitedStates are unvegetated <strong>and</strong> thus are excluded from <strong>the</strong> <strong>Corps</strong>/EPAdefinition <strong>of</strong> wetl<strong>and</strong>s, although <strong>the</strong>y may still be subject to Clean Water Actregulation. O<strong>the</strong>r potential waters <strong>of</strong> <strong>the</strong> United States in <strong>the</strong> Hawai‘i <strong>and</strong><strong>Pacific</strong> Isl<strong>and</strong>s Region include, but are not limited to, tidal flats <strong>and</strong>shorelines along <strong>the</strong> coast <strong>and</strong> in estuaries; coral reefs; lakes; rivers; ponds;anchialine pools; salt <strong>and</strong> mud flats; <strong>and</strong> perennial, intermittent, <strong>and</strong>ephemeral stream channels. Delineation <strong>of</strong> <strong>the</strong>se waters is based on <strong>the</strong>high tide line, <strong>the</strong> “ordinary high water mark” (33 CFR 328.3e), or o<strong>the</strong>rcriteria <strong>and</strong> is beyond <strong>the</strong> scope <strong>of</strong> this Regional Supplement.
ERDC/EL TR-12-5 3Amendments to this document will be issued periodically in response tonew scientific information <strong>and</strong> user comments. Between published versions,Headquarters, U.S. <strong>Army</strong> <strong>Corps</strong> <strong>of</strong> <strong>Engineers</strong>, may provide updatesto this document <strong>and</strong> any o<strong>the</strong>r supplemental information used to makewetl<strong>and</strong> determinations under Section 404 <strong>and</strong> Section 10. Wetl<strong>and</strong> delineatorsshould use <strong>the</strong> most recent approved versions <strong>of</strong> this document <strong>and</strong>supplemental information. See <strong>the</strong> <strong>Corps</strong> <strong>of</strong> <strong>Engineers</strong> Headquarters regulatoryweb site for information <strong>and</strong> updates (http://www.usace.army.mil/CECW/Pages/reg_supp.aspx). The <strong>Corps</strong> <strong>of</strong> <strong>Engineers</strong> has established an interagencyNational Advisory Team for Wetl<strong>and</strong> Delineation whose role is to reviewnew data <strong>and</strong> make recommendations for needed changes in wetl<strong>and</strong>delineationprocedures to Headquarters, U.S. <strong>Army</strong> <strong>Corps</strong> <strong>of</strong> <strong>Engineers</strong>.Items for consideration should include full documentation <strong>and</strong> supportingdata <strong>and</strong> should be submitted to:Applicable regionNational Advisory Team for Wetl<strong>and</strong> DelineationRegulatory Branch (Attn: CECW-CO)U.S. <strong>Army</strong> <strong>Corps</strong> <strong>of</strong> <strong>Engineers</strong>441 G Street, N.W.Washington, DC 20314-1000This supplement is applicable to <strong>the</strong> Hawai‘i <strong>and</strong> <strong>Pacific</strong> Isl<strong>and</strong>s Region,which consists <strong>of</strong> <strong>the</strong> state <strong>of</strong> Hawai‘i, <strong>the</strong> Territory <strong>of</strong> Guam, <strong>the</strong>Commonwealth <strong>of</strong> <strong>the</strong> Nor<strong>the</strong>rn Mariana Isl<strong>and</strong>s, <strong>and</strong> <strong>the</strong> Territory <strong>of</strong>American Samoa (Figure 1). The area includes L<strong>and</strong> Resource Region (LRR)V (Hawai‘i) <strong>and</strong> portions <strong>of</strong> LRR Q (<strong>Pacific</strong> Basin) recognized by <strong>the</strong>U.S. Department <strong>of</strong> Agriculture (USDA Natural Resources ConservationService 2006). Most <strong>of</strong> <strong>the</strong> wetl<strong>and</strong> indicators presented in this supplementare applicable throughout <strong>the</strong> entire Hawai‘i <strong>and</strong> <strong>Pacific</strong> Isl<strong>and</strong>s Region.However, some indicators are restricted to specified subregions.Physical <strong>and</strong> biological characteristics <strong>of</strong> <strong>the</strong> regionThe Hawai‘i <strong>and</strong> <strong>Pacific</strong> Isl<strong>and</strong>s Region consists <strong>of</strong> isl<strong>and</strong> complexes scatteredacross <strong>the</strong> <strong>Pacific</strong> Ocean (Figure 1). The Nor<strong>the</strong>rn Mariana Isl<strong>and</strong>s,Guam, <strong>and</strong> <strong>the</strong> <strong>Hawaii</strong>an archipelago are located in <strong>the</strong> nor<strong>the</strong>rn <strong>Pacific</strong>Ocean, while American Samoa is located in <strong>the</strong> sou<strong>the</strong>rn <strong>Pacific</strong>. Theseisl<strong>and</strong>s are separated by vast distances. The main isl<strong>and</strong>s <strong>of</strong> Hawai‘i areapproximately 2,400 mi (3,900 km) southwest <strong>of</strong> <strong>the</strong> United States
ERDC/EL TR-12-5 4Figure 1. Location map <strong>of</strong> <strong>the</strong> Hawai‘i <strong>and</strong> <strong>Pacific</strong> Isl<strong>and</strong>s Region.mainl<strong>and</strong>. Guam (<strong>the</strong> sou<strong>the</strong>rnmost <strong>of</strong> <strong>the</strong> Mariana isl<strong>and</strong> chain) is locatedan additional 3,800 mi (6,130 km) southwest <strong>of</strong> Hawai‘i. American Samoais located 2,300 mi (3,710 km) southwest <strong>of</strong> Hawai‘i <strong>and</strong> 4,150 mi(6,695 km) from <strong>the</strong> U.S. mainl<strong>and</strong>. Many <strong>of</strong> <strong>the</strong> isl<strong>and</strong>s are <strong>the</strong> exposedtops <strong>of</strong> partially submerged volcanic mountain ranges, although limestoneterraces <strong>and</strong> coral atolls, built on <strong>the</strong> tops <strong>of</strong> submerged volcanic peaks,make up some isl<strong>and</strong>s. The region contains approximately 6,890 mi 2(17,840 km 2 ) <strong>of</strong> l<strong>and</strong> area <strong>and</strong> includes <strong>the</strong> major isl<strong>and</strong>s <strong>of</strong> <strong>the</strong> <strong>Hawaii</strong>anchain (Ni‘ihau, Kaua‘i, O‘ahu, Moloka‘i, Lāna‘i, Kaho‘olawe, Maui, <strong>and</strong>Hawai‘i), <strong>the</strong> Isl<strong>and</strong> <strong>of</strong> Guam, <strong>the</strong> Nor<strong>the</strong>rn Mariana Isl<strong>and</strong>s (includingRota, Tinian, Aguijan, <strong>and</strong> Saipan), <strong>and</strong> American Samoa (including Ofu,Olosega, Ta‘u, <strong>and</strong> Tutuila) (Figure 2). Many smaller isl<strong>and</strong>s, some uninhabited,are also contained in <strong>the</strong> region. The Isl<strong>and</strong> <strong>of</strong> Hawai‘i, known as<strong>the</strong> Big Isl<strong>and</strong>, is <strong>the</strong> largest in <strong>the</strong> region <strong>and</strong> has <strong>the</strong> greatest topographicrelief. The volcanoes <strong>of</strong> Mauna Loa <strong>and</strong> Mauna Kea dominate <strong>the</strong> isl<strong>and</strong><strong>and</strong> rise to maximum elevations <strong>of</strong> 13,679 ft (4,169 m) <strong>and</strong> 13,796 ft(4,205 m) above sea level, respectively (Juvik <strong>and</strong> Juvik 1998; USDANatural Resources Conservation Service 2006).
ERDC/EL TR-12-5 5Figure 2. Principal isl<strong>and</strong>s <strong>of</strong> <strong>the</strong> Hawai‘i <strong>and</strong> <strong>Pacific</strong> Isl<strong>and</strong>s Region.Isl<strong>and</strong>s in <strong>the</strong> region lie within <strong>the</strong> Nor<strong>the</strong>ast or Sou<strong>the</strong>ast Trade Winds<strong>and</strong> have tropical to subtropical maritime climates, in which <strong>the</strong> averageannual variations in air temperature are generally less than daily tempera-
ERDC/EL TR-12-5 6ture fluctuations (USDA Natural Resources Conservation Service 2006).However, <strong>the</strong>re is considerable spatial variability in both temperature <strong>and</strong>rainfall, especially on <strong>the</strong> higher isl<strong>and</strong>s that have greater topographicdiversity <strong>and</strong> relief.The variety <strong>of</strong> topographic, soil, <strong>and</strong> climatic conditions across <strong>the</strong> region,along with geographic isolation, has encouraged <strong>the</strong> development <strong>of</strong> adiverse <strong>Pacific</strong> flora with many species endemic to particular isl<strong>and</strong>s <strong>and</strong>isl<strong>and</strong> groups. The natural climax communities in <strong>the</strong> region range fromhigh-elevation alpine <strong>and</strong> subalpine communities to wet, mesic, <strong>and</strong> dryhardwood forests, shrubl<strong>and</strong>s, grassl<strong>and</strong>s, coastal str<strong>and</strong>, <strong>and</strong> coral atollplant communities. Waves <strong>of</strong> human colonizers added large numbers <strong>of</strong>introduced <strong>and</strong> invasive plants to <strong>the</strong> flora, particularly in Hawai‘i. EarlyPolynesian settlers carried with <strong>the</strong>m a number <strong>of</strong> important food plants,including taro (Colocasia esculenta), sweet potatoes (Ipomoea batatas),breadfruit (Artocarpus altilis), bananas (Musa acuminata), <strong>and</strong> yams(Dioscorea spp.) (Juvik <strong>and</strong> Juvik 1998). However, prior to <strong>the</strong> arrival <strong>of</strong>Europeans, most <strong>of</strong> <strong>the</strong> isl<strong>and</strong>s remained dominated largely by a complex<strong>and</strong> unique native flora. Settlement by Europeans (<strong>and</strong>, later, by Americans,Japanese, <strong>and</strong> o<strong>the</strong>rs) led to large-scale agricultural development,primarily for sugarcane (Saccharum <strong>of</strong>ficinarum) production in <strong>the</strong><strong>Hawaii</strong>an Isl<strong>and</strong>s <strong>and</strong> coconut oil <strong>and</strong> copra (Cocos nucifera) in AmericanSamoa <strong>and</strong> <strong>the</strong> Marianas. Following World War II, l<strong>and</strong>s in sugarcaneproduction were converted to pasturel<strong>and</strong>, secondary agro-forestry, <strong>and</strong>subsistence agriculture (Nakamura 1984; Young 1989; USDA NaturalResources Conservation Service 2006). Large-scale agriculture (e.g., forpineapple [Ananas comosus] <strong>and</strong> c<strong>of</strong>fee [C<strong>of</strong>fea spp.]) remains prevalentin some areas, along with small commercial enterprises that grow food forlocal consumption. Many areas have become urbanized <strong>and</strong> industrializedwith large areas utilized for tourism <strong>and</strong> military purposes.The <strong>Hawaii</strong>an Isl<strong>and</strong>sIn <strong>the</strong> <strong>Hawaii</strong>an Isl<strong>and</strong>s, <strong>the</strong> average daily high temperature is about 84 °F(29 °C) <strong>and</strong> <strong>the</strong> average daily low temperature is 67 °F (19 °C) at sea level.However, temperatures at high elevations regularly dip below freezingduring <strong>the</strong> winter (Juvik <strong>and</strong> Juvik 1998). Average annual rainfall is about70 in. (1,780 mm), but varies greatly by location in relation to nor<strong>the</strong>asterlytrade winds <strong>and</strong> topography. Annual rainfall ranges from about10 to 60 in. (254 to 1,524 mm) on leeward slopes, <strong>and</strong> from 60 to morethan 400 in. (1,524 to more than 10,160 mm) on windward slopes. The
ERDC/EL TR-12-5 7summit <strong>of</strong> Mt. Wai‘ale‘ale on <strong>the</strong> Isl<strong>and</strong> <strong>of</strong> Kaua‘i receives some <strong>of</strong> <strong>the</strong>highest rainfall totals on earth, with about 445 in. (11,300 mm) <strong>of</strong>precipitation per year. The isl<strong>and</strong>s have two seasons – a warm summerseason with moderate rainfall from May through September <strong>and</strong> a cooler,rainy, winter season from October through April (Juvik <strong>and</strong> Juvik 1998;USDA Natural Resources Conservation Service 2006). The amount <strong>of</strong>winter rainfall varies on a four- to seven-year cycle due to <strong>the</strong> El NiñoSou<strong>the</strong>rn Oscillation (Juvik <strong>and</strong> Juvik 1998).Soil parent materials on <strong>the</strong> main <strong>Hawaii</strong>an Isl<strong>and</strong>s consist <strong>of</strong> lava flowsup to 5 million years old flanked by younger marine sediments <strong>and</strong> reefdeposits (Juvik <strong>and</strong> Juvik 1998; Deenik <strong>and</strong> McClellan 2007). Carbonates<strong>and</strong>s, derived from wea<strong>the</strong>red coral, shells, foraminifera, <strong>and</strong> corallinealgae, are common in coastal areas. Each <strong>of</strong> <strong>the</strong> isl<strong>and</strong>s consists <strong>of</strong> one ormore extinct volcanoes that have undergone significant erosion. Activevolcanoes are present on <strong>the</strong> Big Isl<strong>and</strong> <strong>and</strong> Maui, although Maui’sHaleakalā volcano has not erupted since 1790 (Juvik <strong>and</strong> Juvik 1998).Deeply incised valleys are common on most <strong>of</strong> <strong>the</strong> isl<strong>and</strong>s. Soils <strong>of</strong> <strong>the</strong><strong>Hawaii</strong>an Isl<strong>and</strong>s are extremely diverse, with 10 <strong>of</strong> <strong>the</strong> 12 soil ordersrepresented (Deenik <strong>and</strong> McClellan 2007).The most common forest trees in <strong>the</strong> <strong>Hawaii</strong>an Isl<strong>and</strong>s are <strong>the</strong> native ‘ōhi‘alehua (Metrosideros polymorpha) <strong>and</strong> koa (Acacia koa). More than1,000 species <strong>of</strong> non-native <strong>and</strong> invasive plants have become established on<strong>the</strong> <strong>Hawaii</strong>an Isl<strong>and</strong>s. Common introduced trees include eucalyptus (Eucalyptusspp.), common ironwood (Casuarina equisetifolia), rose apple(Syzygium jambos), albizia (Albizia spp.), <strong>and</strong> strawberry guava (Psidiumcattleianum). Nearly 300 native <strong>Hawaii</strong>an plant species are listed asthreatened or endangered under <strong>the</strong> U.S. Endangered Species Act, <strong>and</strong>ano<strong>the</strong>r 50 are proposed for listing.Guam <strong>and</strong> <strong>the</strong> Nor<strong>the</strong>rn Mariana Isl<strong>and</strong>sSeasonal nor<strong>the</strong>asterly trade winds dominate <strong>the</strong> climate <strong>of</strong> Guam <strong>and</strong> <strong>the</strong>Nor<strong>the</strong>rn Mariana Isl<strong>and</strong>s. Guam has a tropical maritime climate with airtemperatures ranging from an average daily high <strong>of</strong> about 86 °F (30 °C) toan average daily low <strong>of</strong> 76 °F (24 °C). Average annual rainfall is about86 in. (2,180 mm) <strong>and</strong> falls mainly during <strong>the</strong> rainy season from Julythrough November (Young 1988; USDA Natural Resources ConservationService 2006; U.S. Central Intelligence Agency [CIA] 2008). There is amoisture deficit (i.e., potential evapotranspiration typically exceeds pre-
ERDC/EL TR-12-5 8cipitation) from January to June (Young 1988). Occasional monsoonalstorms <strong>and</strong> typhoons can produce very heavy rainfall. Annual rainfalltotals are strongly influenced by <strong>the</strong> El Niño Sou<strong>the</strong>rn Oscillation; duringEl Niño events, regional drought conditions may develop across <strong>the</strong>western <strong>Pacific</strong>. The Nor<strong>the</strong>rn Mariana Isl<strong>and</strong>s have a similar climate withabout two-thirds <strong>of</strong> <strong>the</strong> average annual rainfall occurring during <strong>the</strong> rainyseason from July to November. Annual rainfall ranges from about 79 to98 in. (200 to 250 cm) depending upon location, aspect, <strong>and</strong> elevation.The average daily high temperature is about 86 °F (30 °C) <strong>and</strong> <strong>the</strong> averagedaily low temperature is about 68 °F (20 °C) (Young 1989).The nor<strong>the</strong>rn half <strong>of</strong> <strong>the</strong> isl<strong>and</strong> <strong>of</strong> Guam consists <strong>of</strong> a large limestoneplateau <strong>of</strong> Eocene to Pleistocene age, bounded by cliffs (Carroll <strong>and</strong>Hathaway 1963; Tracey et al. 1964). The sou<strong>the</strong>rn half <strong>of</strong> <strong>the</strong> isl<strong>and</strong> is adissected, Quaternary-age, volcanic upl<strong>and</strong> with interspersed limestonedeposits. Fringing reefs surround most <strong>of</strong> <strong>the</strong> isl<strong>and</strong> (Tracey et al. 1964).The soils <strong>of</strong> Guam are a diverse group <strong>of</strong> clays, silts, <strong>and</strong> s<strong>and</strong>s developedon limestone <strong>and</strong> volcanic substrates (Carroll <strong>and</strong> Hathaway 1963). In <strong>the</strong>Nor<strong>the</strong>rn Marianas, <strong>the</strong> isl<strong>and</strong>s <strong>of</strong> Saipan <strong>and</strong> Tinian are dominated bylimestone plateaus <strong>of</strong> Pliocene <strong>and</strong> Pleistocene age. The volcanic core isexposed on about 10 percent <strong>of</strong> Saipan <strong>and</strong> less on Tinian (USDA NaturalResources Conservation Service 2006). Aguijan <strong>and</strong> Rota consist <strong>of</strong> concentriclimestone plateaus with steep escarpments <strong>and</strong> a volcanic core thatis emerging in places (Young 1989).Common trees <strong>of</strong> limestone areas on Guam include <strong>the</strong> native kafu‘(P<strong>and</strong>anus tectorius), pago (Hibiscus tiliaceus), mapunao (Aglaiamariannensis), paipai (Guamia mariannae), nonak (Hern<strong>and</strong>ia sonora),fadang (Cycas micronesica), fagot (Neisosperma oppositifolia), gagu(Casuarina equisetifolia), <strong>and</strong> niyok (Cocos nucifera), <strong>and</strong> <strong>the</strong> introducedtangantangan (Leucaena leucocephala). On Saipan, in addition to <strong>the</strong>above, <strong>the</strong> native gulos (Cynometra ramiflora) <strong>and</strong> introduced sosugi(Acacia confusa) are also common. Volcanic substrates on Guam <strong>and</strong> <strong>the</strong>Nor<strong>the</strong>rn Marianas support patches <strong>of</strong> native pago, kafu‘, puting (Barringtoniaracemosa), ladda (Morinda citrifolia), <strong>and</strong> ahgao (Premna obtusifolia)in a largely fire-maintained savanna l<strong>and</strong>scape dominated bygrasses, such as Pennisetum polystachyon <strong>and</strong> Miscanthus floridulus(Young 1989; USDA Natural Resources Conservation Service 2006).
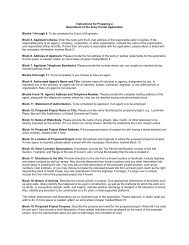
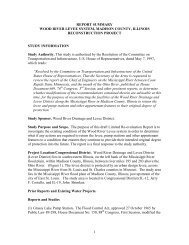
ERDC/EL TR-12-5 9American SamoaAmerican Samoa has a climate dominated by seasonal easterly <strong>and</strong>sou<strong>the</strong>asterly trade winds, which produce a wet season from November toApril. The territory receives abundant rainfall, averaging about 125 in.(3,175 mm) at sea level <strong>and</strong> more than 200 in. (5,100 mm) at higher elevations(Nakamura 1984; USDA Natural Resources Conservation Service2006; U.S. CIA 2008). The total l<strong>and</strong> area <strong>of</strong> American Samoa is about76 mi 2 (197 km 2 ). Tutuila, <strong>the</strong> largest isl<strong>and</strong>, has an area <strong>of</strong> 54 mi 2 (140 km 2 )<strong>and</strong> its highest peak, Mount Matafao, rises 2,142 ft (653 m) above <strong>the</strong>waters <strong>of</strong> Pago Pago Bay. The remaining 22 mi 2 (57 km 2 ) include <strong>the</strong> threeManu‘a Isl<strong>and</strong>s <strong>of</strong> Ofu, Olosega, <strong>and</strong> Ta‘u, which has <strong>the</strong> highest peak in <strong>the</strong>territory, Lata Mountain, at 3,050 ft (930 m). O<strong>the</strong>r isl<strong>and</strong>s in AmericanSamoa include <strong>the</strong> islet <strong>of</strong> Aunu‘u near <strong>the</strong> eastern tip <strong>of</strong> Tutuila; Rose Atoll,65 mi (105 km) east <strong>of</strong> <strong>the</strong> Manu‘as; <strong>and</strong> Swains Isl<strong>and</strong>, a small atoll located200 mi (322 km) north <strong>of</strong> Pago Pago. The larger isl<strong>and</strong>s are characterizedby steep volcanic mountainsides, small incised valleys, <strong>and</strong> a narrow coastalfringe. Soil characteristics vary widely between coastal fringes, mountains,<strong>and</strong> valleys (Nakamura 1984).Most <strong>of</strong> American Samoa is forested with a variety <strong>of</strong> tropical hardwoods<strong>and</strong> palms. Common indigenous species include maota mea (Dysoxylumhuntii), laga‘ali (Aglaia samoensis), mamalava (Planchonella samoensis),futu (Barringtonia asiatica), nui (Cocos nucifera), pu‘a (Hern<strong>and</strong>ianymphaeifolia), <strong>and</strong> fau (Hibiscus tiliaceus) (USDA Natural ResourcesConservation Service 2006; Ragone <strong>and</strong> Lorence 2006).Types <strong>and</strong> distribution <strong>of</strong> wetl<strong>and</strong>sThe interplay <strong>of</strong> hydrology, salinity, <strong>and</strong> geomorphic setting determines <strong>the</strong>types <strong>and</strong> distribution <strong>of</strong> wetl<strong>and</strong>s in <strong>Pacific</strong> isl<strong>and</strong> l<strong>and</strong>scapes. Wetl<strong>and</strong>water sources <strong>and</strong> flow regimes are varied <strong>and</strong> can be derived predominantlyfrom groundwater, surface water, or direct precipitation.Groundwater <strong>and</strong> surface water can be saline or brackish in coastal areas, orinfluenced by fresh water from higher elevations, precipitation, or clouddrip. The tidal range in <strong>the</strong> <strong>Hawaii</strong>an Isl<strong>and</strong>s is about 3.3 ft (1 m) (Juvik <strong>and</strong>Juvik 1998) <strong>and</strong> is similar on o<strong>the</strong>r <strong>Pacific</strong> isl<strong>and</strong>s; this range limits <strong>the</strong>areas subject to regular tidal inundation. In addition to <strong>the</strong>ir hydrologicregimes, wetl<strong>and</strong> types can be differentiated by vegetation type (<strong>of</strong>tendominated today by non-native or invasive plant species) <strong>and</strong> substratetype, which may include bedrock (limestone or basalt), organic soils, or
ERDC/EL TR-12-5 10mineral soils (Erickson <strong>and</strong> Puttock 2006). The principal wetl<strong>and</strong> types in<strong>the</strong> region are described briefly below.Depressional wetl<strong>and</strong>s occur on coastal plains behind beach or riverberms, <strong>and</strong> in historic fish ponds that have filled with sediment. Theirmain water source is groundwater, which can be fresh in <strong>the</strong> wet season tohypersaline in <strong>the</strong> dry season <strong>and</strong> may be influenced by storm surges. In<strong>the</strong> main <strong>Hawaii</strong>an Isl<strong>and</strong>s, <strong>the</strong>se wetl<strong>and</strong>s typically are found on mudflatsor in s<strong>and</strong>y areas, <strong>and</strong> support woody vegetation, such as saltwort (Batismaritima) <strong>and</strong> mangroves (Figure 3). In <strong>the</strong> Marianas <strong>and</strong> o<strong>the</strong>r <strong>Pacific</strong>isl<strong>and</strong>s, <strong>the</strong>y can also be forested with Nypa palms, Barringtonia racemosa,or o<strong>the</strong>r species. Examples <strong>of</strong> <strong>the</strong>se wetl<strong>and</strong>s can be found on <strong>the</strong>south shore <strong>of</strong> Moloka‘i, at Nukoli‘i on Kaua‘i, in <strong>the</strong> Kawainui Marsh <strong>and</strong>James Campbell National Wildlife Refuge on O‘ahu, <strong>and</strong> in <strong>the</strong> Kīheiwetl<strong>and</strong>s on Maui.Figure 3. Coastal wetl<strong>and</strong> on Kaua‘i dominated by Batis maritima <strong>and</strong> mangroves.Photo courtesy <strong>of</strong> <strong>the</strong> U.S. Fish <strong>and</strong> Wildlife Service.Sloped marshl<strong>and</strong>s or fern wetl<strong>and</strong>s obtain <strong>the</strong>ir hydrology from shallowgroundwater that may rise to <strong>the</strong> surface infrequently. They occur mainlyin volcanic areas on slopes greater than 10 percent, particularly in <strong>the</strong>
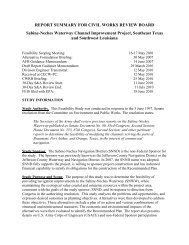
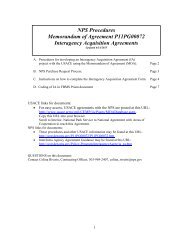
ERDC/EL TR-12-5 11Mariana Isl<strong>and</strong>s. They typically have mineral soils <strong>and</strong> support mainlyherbaceous vegetation (e.g., Nephrolepis ferns, Phragmites karka, <strong>and</strong>sedges), with scattered P<strong>and</strong>anus tectorius trees. Examples include <strong>the</strong>Shell wetl<strong>and</strong>s <strong>and</strong> Nimitz Hill marshl<strong>and</strong>s on Guam <strong>and</strong> <strong>the</strong> upper WaipāValley wetl<strong>and</strong>s on Kaua‘i.Hanging bogs occur in areas <strong>of</strong> abundant rainfall on steep volcanic slopes<strong>of</strong> 25 percent or more. Their hydrology is driven by groundwater perchedover an aquitard <strong>of</strong> ironstone sheath. The soils are <strong>of</strong>ten organic (e.g.,peats, mucks) <strong>and</strong> <strong>the</strong> vegetation is mainly herbaceous with stunted trees<strong>and</strong> shrubs (e.g., Metrosideros polymorpha). Examples can be found in<strong>the</strong> Waipā Valley <strong>of</strong> Kaua‘i <strong>and</strong> on high-elevation slopes in <strong>the</strong> Ko‘olauMountains on O‘ahu.Montane bogs are found mainly in volcanic areas that have flat to rollingtopography, abundant precipitation (up to 445 in. [11,300 mm] per year),<strong>and</strong> a high water table <strong>and</strong>/or surface flow. They are found in <strong>the</strong> AlakaiSwamp on Kaua‘i (Figure 4), on Mount Ka‘ala on O‘ahu, in <strong>the</strong> KamakouPreserve on Moloka‘i, on Mount ‘Eke <strong>and</strong> Hāna Ranch on Maui, <strong>and</strong> in <strong>the</strong>Mauna Loa bogs on Hawai‘i. Montane bogs are dominated by nativeherbaceous, fern, shrub, <strong>and</strong> stunted forest species.Forested wetl<strong>and</strong>s are found at middle to higher elevations on all <strong>of</strong> <strong>the</strong>larger <strong>Hawaii</strong>an Isl<strong>and</strong>s with <strong>the</strong> exception <strong>of</strong> Kaho‘olawe <strong>and</strong> Ni‘ihau. Theyoccupy slopes <strong>and</strong> depressions where <strong>the</strong> water table is <strong>of</strong>ten near <strong>the</strong>surface or where rainwater perches above a shallow aquitard or bedrock. In<strong>the</strong> Puna <strong>and</strong> South Hilo Districts on <strong>the</strong> Isl<strong>and</strong> <strong>of</strong> Hawai‘i, for example,many small wetl<strong>and</strong>s exist in scattered depressions created by cracks, folds,<strong>and</strong> undulating flow patterns in pāhoehoe lava flows (Wakeley et al. 1996).Riverine <strong>and</strong> open-water fringe wetl<strong>and</strong>s are present throughout <strong>the</strong> region.Their hydrology is derived mainly from <strong>the</strong> adjacent stream, lake, or pond.They are generally fresh water but may be brackish to saline at <strong>the</strong>irconfluence with marine waters. The vegetation <strong>of</strong> fringe wetl<strong>and</strong>s rangesfrom trees <strong>and</strong> shrubs (e.g., Rhizophora mangle, Xylocarpus moluccensis,<strong>and</strong> o<strong>the</strong>r mangroves; hau [Hibiscus tiliaceus]; <strong>and</strong> java plum [Syzygiumcumini = Eugenia cumini]) to herbaceous plants (e.g., para grass [Urochloamutica], sawgrass [Cladium mariscus ssp. jamaicense = C. jamaicense],<strong>and</strong> seashore paspalum [Paspalum vaginatum]). Throughout <strong>the</strong> region,this wetl<strong>and</strong> type represents <strong>the</strong> greatest acreage <strong>of</strong> remaining low-elevation
ERDC/EL TR-12-5 12Figure 4. Aerial view <strong>of</strong> <strong>the</strong> Alakai Swamp, Kaua‘i, showing both forested <strong>and</strong> montane bogwetl<strong>and</strong>s. Photo courtesy <strong>of</strong> <strong>the</strong> U.S. Fish <strong>and</strong> Wildlife Service.wetl<strong>and</strong>s. Hundreds <strong>of</strong> acres were used previously for <strong>the</strong> production <strong>of</strong> taroor rice (Oryza sativa); however, most wetl<strong>and</strong> agriculture has now beenphased out. Examples <strong>of</strong> riverine <strong>and</strong> open-water fringe wetl<strong>and</strong>s can befound at Lake Susupe on Saipan, <strong>the</strong> Masefau Wetl<strong>and</strong> on Tutuila, <strong>the</strong> lowerHanalei River on Kaua‘i, <strong>the</strong> Waipi‘o Valley on Hawai‘i, <strong>and</strong> KawainuiMarsh on O‘ahu.Salt-flat <strong>and</strong> mud-flat wetl<strong>and</strong>s are found along <strong>the</strong> immediate coastline<strong>and</strong> are subject to coastal overwash <strong>and</strong> spray. They have mineral substrates<strong>and</strong> vegetation <strong>of</strong>ten dominated by Batis maritima, Sporobolusvirginicus, <strong>and</strong> sometimes kiawe (Prosopis pallida). Examples includethose at Hanapēpē on Kaua‘i <strong>and</strong> Paikō Lagoon on O‘ahu.
ERDC/EL TR-12-5 132 Hydrophytic Vegetation IndicatorsIntroductionThe <strong>Corps</strong> Manual defines hydrophytic vegetation as <strong>the</strong> community <strong>of</strong>macrophytes that occurs in areas where inundation or soil saturation isei<strong>the</strong>r permanent or <strong>of</strong> sufficient frequency <strong>and</strong> duration to influence plantoccurrence. The manual uses a plant-community approach to evaluatevegetation. Hydrophytic vegetation decisions are based on <strong>the</strong> assemblage<strong>of</strong> plant species growing on a site, ra<strong>the</strong>r than <strong>the</strong> presence or absence <strong>of</strong>particular indicator species. Hydrophytic vegetation is present when <strong>the</strong>plant community is dominated by species that require or can tolerateprolonged inundation or soil saturation during <strong>the</strong> growing season.Hydrophytic vegetation in <strong>the</strong> Hawai‘i <strong>and</strong> <strong>Pacific</strong> Isl<strong>and</strong>s Region isidentified by using <strong>the</strong> indicators described in this chapter.Many factors besides site wetness affect <strong>the</strong> composition <strong>of</strong> <strong>the</strong> plantcommunity in an area, including regional climate, local wea<strong>the</strong>r patterns,topography, soils, natural <strong>and</strong> human-caused disturbances, <strong>and</strong> current<strong>and</strong> historical plant distributional patterns at various spatial scales. Theinsular floras <strong>of</strong> <strong>the</strong> <strong>Pacific</strong> basin are <strong>the</strong> result <strong>of</strong> development overdifferent time spans <strong>and</strong> under influences from different source regions.The native floras <strong>of</strong> <strong>the</strong> <strong>Hawaii</strong>an Isl<strong>and</strong>s <strong>and</strong> American Samoa, forexample, differ substantially from that <strong>of</strong> <strong>the</strong> Marianas, including Guam(Mueller-Dombois <strong>and</strong> Fosberg 1998). The <strong>Hawaii</strong>an <strong>and</strong> Samoan Isl<strong>and</strong>sare within <strong>the</strong> Polynesian Region <strong>and</strong> are influenced by an Indo-<strong>Pacific</strong>flora with strong representation <strong>of</strong> American, New Zeal<strong>and</strong>, <strong>and</strong> Antarcticcomponents (Takhtajan 1986). The Mariana isl<strong>and</strong> chain is within <strong>the</strong>Micronesian Region <strong>and</strong> its flora is influenced by an Indo-Malaysian florawith strong connections to those <strong>of</strong> <strong>the</strong> Philippines, Indonesia, <strong>and</strong> Asia.The flora <strong>of</strong> <strong>the</strong> Marianas lacks an American or boreal component. Unlikefloras in some o<strong>the</strong>r parts <strong>of</strong> <strong>the</strong> <strong>Pacific</strong> basin, those <strong>of</strong> <strong>the</strong> <strong>Hawaii</strong>anIsl<strong>and</strong>s, Samoan Isl<strong>and</strong>s, <strong>and</strong> Marianas are composed mainly <strong>of</strong> speciesderived from plant colonists that took advantage <strong>of</strong> new habitats createdby volcanic action. The regional floras <strong>of</strong> Polynesia <strong>and</strong> Micronesiahistorically were a mix <strong>of</strong> local endemics, <strong>Pacific</strong> regional endemics, <strong>and</strong>species associated with o<strong>the</strong>r nearby continental floras. All have suffered aheavy influx <strong>of</strong> invasive species resulting from human settlement, agriculture,<strong>and</strong> urban development. Many wetl<strong>and</strong>s in <strong>the</strong> region are
ERDC/EL TR-12-5 14dominated by hydrophytes that are not native to <strong>the</strong>se isl<strong>and</strong>s. Today <strong>the</strong>wetl<strong>and</strong> flora <strong>of</strong> <strong>the</strong> <strong>Hawaii</strong>an Isl<strong>and</strong>s includes about 1,400 taxa, while that<strong>of</strong> Guam <strong>and</strong> <strong>the</strong> Nor<strong>the</strong>rn Mariana Isl<strong>and</strong>s includes approximately800 taxa (U.S. <strong>Army</strong> <strong>Corps</strong> <strong>of</strong> <strong>Engineers</strong> 2009).Hydrophytic vegetation decisions are based on <strong>the</strong> wetl<strong>and</strong> indicatorstatus (Reed [1988] or current approved list) <strong>of</strong> species that make up <strong>the</strong>plant community. Species in <strong>the</strong> facultative categories (FACW, FAC, <strong>and</strong>FACU) are recognized as occurring in both wetl<strong>and</strong>s <strong>and</strong> upl<strong>and</strong>s to varyingdegrees. Although most wetl<strong>and</strong>s are dominated mainly by speciesrated OBL, FACW, <strong>and</strong> FAC, some wetl<strong>and</strong> communities may be dominatedprimarily by FACU species <strong>and</strong> cannot be identified by dominantspecies alone. In those cases, o<strong>the</strong>r indicators <strong>of</strong> hydrophytic vegetationmust also be considered, particularly where indicators <strong>of</strong> hydric soils <strong>and</strong>wetl<strong>and</strong> hydrology are present. This situation is not necessarily due toinaccurate wetl<strong>and</strong> indicator ratings; ra<strong>the</strong>r, it is due to <strong>the</strong> broad tolerances<strong>of</strong> certain plant species that allow <strong>the</strong>m to be widely distributedacross <strong>the</strong> moisture gradient.Hydrophytic vegetation indicators <strong>and</strong> procedures presented in this chapterare designed to identify <strong>the</strong> majority <strong>of</strong> wetl<strong>and</strong> plant communities in<strong>the</strong> region. However, some wetl<strong>and</strong> communities may lack any <strong>of</strong> <strong>the</strong>seindicators, at least at certain times. These situations are considered inChapter 5 (Difficult Wetl<strong>and</strong> Situations in <strong>the</strong> Hawai‘i <strong>and</strong> <strong>Pacific</strong> Isl<strong>and</strong>sRegion).Guidance on vegetation sampling <strong>and</strong> analysisGeneral guidance on sampling <strong>of</strong> vegetation for wetl<strong>and</strong>-delineation purposesis given in <strong>the</strong> <strong>Corps</strong> Manual. Those procedures are intended to beflexible <strong>and</strong> may need to be modified for application in a given region oron a particular site. Vegetation sampling done as part <strong>of</strong> a wetl<strong>and</strong> delineationis designed to characterize <strong>the</strong> site in question rapidly. A balancemust be established between <strong>the</strong> need to accomplish <strong>the</strong> work quickly <strong>and</strong><strong>the</strong> need to characterize <strong>the</strong> site’s heterogeneity accurately <strong>and</strong> at anappropriate scale. The following guidance on vegetation sampling isintended to supplement <strong>the</strong> <strong>Corps</strong> Manual for applications in <strong>the</strong> Hawai‘i<strong>and</strong> <strong>Pacific</strong> Isl<strong>and</strong>s Region.The first step is to identify <strong>the</strong> major l<strong>and</strong>scape units or vegetation communitieson a site so <strong>the</strong>y can be evaluated separately. This may be done in
ERDC/EL TR-12-5 15advance using an aerial photograph or topographic map, or by walking <strong>the</strong>site. In general, routine wetl<strong>and</strong> determinations are based on visual estimates<strong>of</strong> percent cover <strong>of</strong> plant species that can be made ei<strong>the</strong>r (1) within<strong>the</strong> vegetation community as a whole, or (2) within one or more samplingplots established in representative locations within each community.Percent cover estimates are more accurate <strong>and</strong> repeatable if taken within adefined plot. This also facilitates field verification <strong>of</strong> ano<strong>the</strong>r delineator’swork.The appropriate size <strong>and</strong> shape for a sample plot depend on <strong>the</strong> type <strong>of</strong>vegetation (i.e., trees, shrubs, herbaceous plants, etc.) <strong>and</strong> <strong>the</strong> size or shape<strong>of</strong> <strong>the</strong> plant community or patch being sampled. The plot should be largeenough to include adequate numbers <strong>of</strong> individuals in all strata, but smallenough so that plant species or individuals can be separated <strong>and</strong> measuredwithout duplication or omission, <strong>and</strong> <strong>the</strong> sampling can be done in a timelyfashion (Cox 1990; Barbour et al. 1999). For hydrophytic vegetationdeterminations, <strong>the</strong> abundance <strong>of</strong> each species is determined by using arealcover estimates. Plot sizes should make visual sampling both accurate <strong>and</strong>efficient. The sizes <strong>and</strong> shapes <strong>of</strong> sampling plots, if used, may be modified asappropriate to adapt to site conditions <strong>and</strong> should be recorded on <strong>the</strong> fielddata form if <strong>the</strong>y deviate from those recommended in <strong>the</strong> <strong>Corps</strong> Manual.When sampling near a plant-community boundary, <strong>and</strong> particularly near<strong>the</strong> wetl<strong>and</strong> boundary, it may be necessary to adjust plot size or shape toavoid overlapping <strong>the</strong> boundary <strong>and</strong> extending into an adjacent communityhaving different vegetation, soils, or hydrologic conditions.If it is not possible to locate one or a few plots in a way that adequatelyrepresents <strong>the</strong> vegetation unit being sampled, <strong>the</strong>n percent cover estimatesfor each species can be made during a me<strong>and</strong>ering survey <strong>of</strong> <strong>the</strong> broadercommunity. If additional quantification <strong>of</strong> cover estimates is needed, <strong>the</strong>n<strong>the</strong> optional procedure for point-intercept sampling along transects (seeAppendix B) or o<strong>the</strong>r sampling procedures may be used to characterize <strong>the</strong>vegetation unit. To use <strong>the</strong> methods described in this paragraph, soil <strong>and</strong>hydrologic conditions must be relatively uniform across <strong>the</strong> sampled area.Vegetation sampling guidance presented here <strong>and</strong> in <strong>the</strong> <strong>Corps</strong> Manualshould be adequate for hydrophytic vegetation determinations in mostsituations. However, many variations in vegetation structure, diversity,<strong>and</strong> spatial arrangement exist on <strong>the</strong> l<strong>and</strong>scape <strong>and</strong> cannot be addressedadequately in this supplement. A list <strong>of</strong> references is given in Table 2 for
ERDC/EL TR-12-5 16Table 2. Selected references to additional vegetation sampling approaches that could beused in wetl<strong>and</strong> delineation.ReferenceKent, M., <strong>and</strong> P. Coker. 1992. VegetationDescription <strong>and</strong> Analysis: A PracticalApproach. New York, NY: Wiley.Mueller-Dombois, D., <strong>and</strong> H. Ellenberg. 1974.Aims <strong>and</strong> Methods <strong>of</strong> Vegetation Ecology.New York, NY: Wiley.Tiner, R. W. 1999. Wetl<strong>and</strong> indicators: aguide to wetl<strong>and</strong> delineation, classification,<strong>and</strong> mapping. Boca Raton, FL: CRC Press.USDI Bureau <strong>of</strong> L<strong>and</strong> Management. 1996.Sampling vegetation attributes. BLM/RS/ST-96/002+1730. Denver, CO.USDI Bureau <strong>of</strong> L<strong>and</strong> Management. 1998.Measuring <strong>and</strong> monitoring plant populations.BLM/RS/ST-98/005+1730. Denver, CO.CommentContains simple <strong>and</strong> clear methods forsetting up a study, <strong>and</strong> collecting <strong>and</strong>analyzing <strong>the</strong> data. Initial chapters arehelpful for data collection <strong>and</strong> samplingapproaches in wetl<strong>and</strong> delineation.A st<strong>and</strong>ard text in vegetation ecology,sampling, <strong>and</strong> analysis. This referenceprovides many sampling <strong>and</strong> analyticalmethods that are helpful in complexdelineations.Includes reviews <strong>of</strong> various samplingtechniques <strong>and</strong> provides a list <strong>of</strong> vegetationreferences.Describes many aspects <strong>of</strong> vegetationsampling, including sampling protocols, datacollection, <strong>and</strong> analysis.Describes sampling design, measuringtechniques, <strong>and</strong> analytical methods.more complex sampling situations. If alternative sampling techniques areused, <strong>the</strong>y should be derived from <strong>the</strong> scientific literature <strong>and</strong> described infield notes or in <strong>the</strong> delineation report. The basic data must include abundancevalues for each species present. Typical abundance measuresinclude basal area for tree species, percent areal cover, stem density, orfrequency based on point-intercept sampling. In any case, <strong>the</strong> data mustbe in a format that can be used in <strong>the</strong> dominance test or prevalence indexfor hydrophytic vegetation (see <strong>the</strong> section on Hydrophytic VegetationIndicators).In this supplement, absolute percent cover is <strong>the</strong> preferred abundancemeasure for all species. For percent cover estimates, it is not necessary forall plants to be rooted in <strong>the</strong> plot as long as <strong>the</strong>y are growing under <strong>the</strong>same soil <strong>and</strong> hydrologic conditions. It may be necessary to exclude plantsthat overhang <strong>the</strong> plot if <strong>the</strong>y are rooted in areas having different soil <strong>and</strong>hydrologic conditions, particularly when sampling near <strong>the</strong> wetl<strong>and</strong>boundary.
ERDC/EL TR-12-5 17Definitions <strong>of</strong> strataVegetation strata within <strong>the</strong> sampled area or plot are sampled separatelywhen evaluating indicators <strong>of</strong> hydrophytic vegetation. In <strong>the</strong> Hawai‘i <strong>and</strong><strong>Pacific</strong> Isl<strong>and</strong>s Region, <strong>the</strong> vegetation strata described in <strong>the</strong> <strong>Corps</strong>Manual are recommended (see below). Unless o<strong>the</strong>rwise noted, a stratumfor sampling purposes is defined as having 5 percent or more total plantcover, unless it is <strong>the</strong> only stratum present. If a stratum has less than5 percent cover during <strong>the</strong> peak <strong>of</strong> annual plant growth, <strong>the</strong>n those species<strong>and</strong> <strong>the</strong>ir cover values may be combined with ano<strong>the</strong>r stratum for hydrophyticvegetation determinations. For example, a sparse tree layer couldbe combined with <strong>the</strong> sapling/shrub layer. Depending upon <strong>the</strong>ir locationin <strong>the</strong> canopy, a sparse woody vine stratum could be incorporated into <strong>the</strong>tree or sapling/shrub strata.1. Tree stratum – Consists <strong>of</strong> woody plants 3 in. (7.6 cm) or more indiameter at breast height (DBH), regardless <strong>of</strong> height.2. Sapling/shrub stratum – Consists <strong>of</strong> woody plants less than 3 in. DBH<strong>and</strong> greater than or equal to 3.28 ft (1 m) tall.3. Herb stratum – Consists <strong>of</strong> all herbaceous (non-woody) plants, includingherbaceous vines, regardless <strong>of</strong> size, <strong>and</strong> woody plants less than 3.28 ft tall.4. Woody vines – Consists <strong>of</strong> all woody vines greater than 3.28 ft in height.Hydrophytic vegetation indicatorsThe following indicators should be applied in <strong>the</strong> sequence presented. Thestepwise procedure is designed to reduce field effort by requiring that onlyone or two indicators, variations <strong>of</strong> <strong>the</strong> dominance test, be evaluated in <strong>the</strong>majority <strong>of</strong> wetl<strong>and</strong> determinations. However, hydrophytic vegetation ispresent if any <strong>of</strong> <strong>the</strong> indicators is satisfied. All <strong>of</strong> <strong>the</strong>se indicators areapplicable throughout <strong>the</strong> Hawai‘i <strong>and</strong> <strong>Pacific</strong> Isl<strong>and</strong>s Region.Indicators <strong>of</strong> hydrophytic vegetation involve looking up <strong>the</strong> wetl<strong>and</strong> indicatorstatus <strong>of</strong> plant species on <strong>the</strong> wetl<strong>and</strong> plant list (Reed [1988] orcurrent list). For <strong>the</strong> purposes <strong>of</strong> this supplement, only <strong>the</strong> five basic levels<strong>of</strong> wetl<strong>and</strong> indicator status (i.e., OBL, FACW, FAC, FACU, <strong>and</strong> UPL) areused in hydrophytic vegetation indicators. Plus (+) <strong>and</strong> minus (–) modifiersare not used (e.g., FAC–, FAC, <strong>and</strong> FAC+ plants are all considered tobe FAC). In general, species that are not listed on <strong>the</strong> wetl<strong>and</strong> plant list areassumed to be upl<strong>and</strong> (UPL) species. However, recent changes in plantnomenclature have resulted in a number <strong>of</strong> species that are not listed by
ERDC/EL TR-12-5 18Reed (1988) but are not necessarily UPL plants. Procedures described inChapter 5, section on Problematic Hydrophytic Vegetation, can be used ifit is believed that individual FACU, NI, NO, or unlisted plant species arefunctioning as hydrophytes on a particular site. For Clean Water Act purposes,wetl<strong>and</strong> delineators should use <strong>the</strong> latest plant lists approved byHeadquarters, U.S. <strong>Army</strong> <strong>Corps</strong> <strong>of</strong> <strong>Engineers</strong>(http://www.usace.army.mil/CECW/Pages/reg_supp.aspx).Evaluation <strong>of</strong> <strong>the</strong> vegetation can begin with a rapid field test for hydrophyticvegetation to determine if <strong>the</strong>re is a need to collect more detailedvegetation data. The rapid test for hydrophytic vegetation (Indicator 1) ismet if all dominant species across all strata are OBL or FACW, or acombination <strong>of</strong> <strong>the</strong> two, based on a visual assessment. If <strong>the</strong> site is notdominated solely by OBL <strong>and</strong> FACW species, proceed to <strong>the</strong> st<strong>and</strong>arddominance test (Indicator 2), which is <strong>the</strong> basic hydrophytic vegetationindicator. Ei<strong>the</strong>r Indicator 1 or 2 should be applied in every wetl<strong>and</strong> determination.Most wetl<strong>and</strong>s in <strong>the</strong> Hawai‘i <strong>and</strong> <strong>Pacific</strong> Isl<strong>and</strong>s Region haveplant communities that will meet one or both <strong>of</strong> <strong>the</strong>se indicators. Theseare <strong>the</strong> only indicators that need to be considered in most situations. However,some wetl<strong>and</strong> plant communities may fail a test based only on dominantspecies. Therefore, in those cases where indicators <strong>of</strong> hydric soil <strong>and</strong>wetl<strong>and</strong> hydrology are present, <strong>the</strong> vegetation should be reevaluated with<strong>the</strong> prevalence index (Indicator 3), which takes non-dominant plant speciesinto consideration. Finally, certain disturbed or problematic wetl<strong>and</strong>situations may lack any <strong>of</strong> <strong>the</strong>se indicators <strong>and</strong> are described in Chapter 5.ProcedureThe procedure for using hydrophytic vegetation indicators is as follows:1. Apply Indicator 1 (Rapid Test for Hydrophytic Vegetation).a. If <strong>the</strong> plant community passes <strong>the</strong> rapid test for hydrophyticvegetation, <strong>the</strong>n <strong>the</strong> vegetation is hydrophytic <strong>and</strong> no fur<strong>the</strong>rvegetation analysis is required.b. If <strong>the</strong> rapid test for hydrophytic vegetation is not met, <strong>the</strong>n proceed tostep 2.2. Apply Indicator 2 (Dominance Test).
ERDC/EL TR-12-5 19a. If <strong>the</strong> plant community passes <strong>the</strong> dominance test, <strong>the</strong>n <strong>the</strong> vegetationis hydrophytic <strong>and</strong> no fur<strong>the</strong>r vegetation analysis is required.b. If <strong>the</strong> plant community fails <strong>the</strong> dominance test, <strong>and</strong> indicators <strong>of</strong>hydric soil <strong>and</strong>/or wetl<strong>and</strong> hydrology are absent, <strong>the</strong>n hydrophyticvegetation is absent unless <strong>the</strong> site meets requirements for aproblematic wetl<strong>and</strong> situation (see Chapter 5).c. If <strong>the</strong> plant community fails <strong>the</strong> dominance test, but indicators <strong>of</strong>hydric soil <strong>and</strong> wetl<strong>and</strong> hydrology are both present, proceed to step 3.3. Apply Indicator 3 (Prevalence Index). This step assumes that at least oneindicator <strong>of</strong> hydric soil <strong>and</strong> one primary or two secondary indicators <strong>of</strong>wetl<strong>and</strong> hydrology are present.a. If <strong>the</strong> plant community satisfies <strong>the</strong> prevalence index, <strong>the</strong>n <strong>the</strong> vegetationis hydrophytic. No fur<strong>the</strong>r vegetation analysis is required.b. If <strong>the</strong> plant community fails <strong>the</strong> prevalence index, <strong>the</strong>n hydrophyticvegetation is absent unless indicators <strong>of</strong> hydric soil <strong>and</strong> wetl<strong>and</strong>hydrology are present <strong>and</strong> <strong>the</strong> site meets <strong>the</strong> requirements for aproblematic wetl<strong>and</strong> situation (Chapter 5).Indicator 1: Rapid test for hydrophytic vegetationDescription: All dominant species across all strata are rated OBL orFACW, or a combination <strong>of</strong> <strong>the</strong>se two categories, based on a visualassessment.User Notes: This test is intended as a quick confirmation in obviouscases that a site has hydrophytic vegetation, without <strong>the</strong> need for moreintensive sampling. Dominant species are selected visually from eachstratum <strong>of</strong> <strong>the</strong> community using <strong>the</strong> “50/20 rule” (see Indicator 2 –Dominance Test below) as a general guide but without <strong>the</strong> need to ga<strong>the</strong>rquantitative data. Only <strong>the</strong> dominant species in each stratum must berecorded on <strong>the</strong> data form.Indicator 2: Dominance testDescription: More than 50 percent <strong>of</strong> <strong>the</strong> dominant plant species acrossall strata are rated OBL, FACW, or FAC.
ERDC/EL TR-12-5 20User Notes: Use <strong>the</strong> “50/20 rule” described below to select dominantspecies from each stratum <strong>of</strong> <strong>the</strong> community. Combine dominant speciesacross strata <strong>and</strong> apply <strong>the</strong> dominance test to <strong>the</strong> combined list. Once aspecies is selected as a dominant, its cover value is not used in <strong>the</strong> dominancetest; each dominant species is treated equally. Thus, a plant communitywith seven dominant species across all strata would need at leastfour dominant species that are OBL, FACW, or FAC to be consideredhydrophytic by this indicator. Species that are dominant in two or morestrata should be counted two or more times in <strong>the</strong> dominance test.Procedure for Selecting Dominant Species by <strong>the</strong> 50/20 Rule:Dominant plant species are <strong>the</strong> most abundant species in <strong>the</strong> community;<strong>the</strong>y contribute more to <strong>the</strong> character <strong>of</strong> <strong>the</strong> community than do <strong>the</strong> o<strong>the</strong>rnon-dominant species present. The 50/20 rule is a repeatable <strong>and</strong> objectiveprocedure for selecting dominant plant species <strong>and</strong> is recommendedwhen data are available for all species in <strong>the</strong> community. The rule can alsobe used to guide visual sampling <strong>of</strong> plant communities in rapid wetl<strong>and</strong>determinations.Dominant species are chosen independently from each stratum <strong>of</strong> <strong>the</strong>community. In general, dominants are <strong>the</strong> most abundant species thatindividually or collectively account for more than 50 percent <strong>of</strong> <strong>the</strong> totalcoverage <strong>of</strong> vegetation in <strong>the</strong> stratum, plus any o<strong>the</strong>r species that, by itself,accounts for at least 20 percent <strong>of</strong> <strong>the</strong> total. For <strong>the</strong> purposes <strong>of</strong> thisregional supplement, absolute percent cover is <strong>the</strong> recommended abundancemeasure for plants in all vegetation strata. See Table 3 for anexample application <strong>of</strong> <strong>the</strong> 50/20 rule in evaluating a plant community.Steps in selecting dominant species by <strong>the</strong> 50/20 rule are as follows:1. Estimate <strong>the</strong> absolute percent cover <strong>of</strong> each species in <strong>the</strong> first stratum.Since <strong>the</strong> same data may be used later to calculate <strong>the</strong> prevalence index,<strong>the</strong> data should be recorded as absolute cover <strong>and</strong> not converted to relativecover.2. Rank all species in <strong>the</strong> stratum from most to least abundant.3. Calculate <strong>the</strong> total coverage <strong>of</strong> all species in <strong>the</strong> stratum (i.e., sum <strong>the</strong>irindividual percent cover values). Absolute cover estimates do notnecessarily sum to 100 percent.4. Select plant species from <strong>the</strong> ranked list, in decreasing order <strong>of</strong> coverage,until <strong>the</strong> cumulative coverage <strong>of</strong> selected species exceeds 50 percent <strong>of</strong> <strong>the</strong>total absolute coverage for <strong>the</strong> stratum. If two or more species are equal incoverage (i.e., <strong>the</strong>y are tied in rank), <strong>the</strong>y should all be selected. The
ERDC/EL TR-12-5 21StratumHerbselected plant species are all considered to be dominants. All dominantsmust be identified to species.5. In addition, select any o<strong>the</strong>r species that, by itself, is at least 20 percent <strong>of</strong><strong>the</strong> total absolute percent cover in <strong>the</strong> stratum. Any such species is alsoconsidered to be a dominant <strong>and</strong> must be accurately identified.6. Repeat steps 1-5 for any o<strong>the</strong>r stratum present. Combine <strong>the</strong> lists <strong>of</strong> dominantspecies across all strata. Note that a species may be dominant in morethan one stratum (e.g., a woody species may be dominant in both <strong>the</strong> tree<strong>and</strong> sapling/shrub strata).Table 3. Example <strong>of</strong> <strong>the</strong> selection <strong>of</strong> dominant species by <strong>the</strong> 50/20 rule <strong>and</strong> determination <strong>of</strong>hydrophytic vegetation by <strong>the</strong> dominance test.Sapling/shrubTreeSpecies NameCarex alligataCyperus haspanDicranopteris linearisLudwigia palustrisPeperomia membranaceaUncinia uncinataCibotium chamissoiMetrosideros polymorphaSadleria cya<strong>the</strong>oidesCheirodendron trigynumMetrosideros polymorphaWetl<strong>and</strong> IndicatorStatusFACWFACWFACUOBLFACFACTotal cover 7050/20 Thresholds:50% <strong>of</strong> total cover = 35.0%20% <strong>of</strong> total cover = 14.0%FACFACFACUAbsolutePercent Cover152510510515205Total cover 4050/20 Thresholds:50% <strong>of</strong> total cover = 20.0%20% <strong>of</strong> total cover = 8.0%Total cover 7550/20 Thresholds:50% <strong>of</strong> total cover = 37.5%20% <strong>of</strong> total cover = 15%Woody vine Freycinetia arborea FACU 15 YesTotal cover 1550/20 Thresholds:50% <strong>of</strong> total cover = 7.5%20% <strong>of</strong> total cover = 3.0%HydrophyticVegetationDeterminationFACFAC2055Total number <strong>of</strong> dominant species across all strata = 7.Percent <strong>of</strong> dominant species that are OBL, FACW, or FAC = 6/7 = 86%.Therefore, this community is hydrophytic by Indicator 2 (Dominance Test).Dominant?YesYesNoNoNoNoYesYesNoYesYes
ERDC/EL TR-12-5 22Indicator 3: Prevalence indexDescription: The prevalence index is 3.0 or less.User Notes: The prevalence index ranges from one to five. A prevalenceindex <strong>of</strong> 3.0 or less indicates that hydrophytic vegetation is present. Tocalculate <strong>the</strong> prevalence index, at least 80 percent <strong>of</strong> <strong>the</strong> total vegetationcover on <strong>the</strong> plot (summed across all strata) must be <strong>of</strong> species that havebeen correctly identified <strong>and</strong> have assigned wetl<strong>and</strong> indicator statuses(Reed [1988] or current list) or are upl<strong>and</strong> (UPL) species.Procedure for Calculating a Plot-Based Prevalence Index: Theprevalence index is a weighted-average wetl<strong>and</strong> indicator status <strong>of</strong> all plantspecies in <strong>the</strong> sampling plot, where each indicator status category is given anumeric code (OBL = 1, FACW = 2, FAC = 3, FACU = 4, <strong>and</strong> UPL = 5) <strong>and</strong>weighting is by abundance (absolute percent cover). It is a morecomprehensive analysis <strong>of</strong> <strong>the</strong> hydrophytic status <strong>of</strong> <strong>the</strong> community thanone based on just a few dominant species. It is particularly useful in(1) communities with only one or two dominants, (2) highly diverse communitieswhere many species may be present at roughly equal coverage, <strong>and</strong>(3) cases where strata differ greatly in total plant cover (e.g., total herb coveris 80 percent but sapling/shrub cover is only 10 percent). The prevalenceindex is used in this supplement to determine whe<strong>the</strong>r hydrophyticvegetation is present on sites where indicators <strong>of</strong> hydric soil <strong>and</strong> wetl<strong>and</strong>hydrology are present but <strong>the</strong> vegetation initially fails <strong>the</strong> dominance test.The following procedure is used to calculate a plot-based prevalence index.The method was described by Wentworth et al. (1988) <strong>and</strong> modified byWakeley <strong>and</strong> Lichvar (1997). It uses <strong>the</strong> same field data (i.e., percent coverestimates for each plant species) that were used to select dominant speciesby <strong>the</strong> 50/20 rule, with <strong>the</strong> added constraint that at least 80 percent <strong>of</strong> <strong>the</strong>total vegetation cover on <strong>the</strong> plot must be <strong>of</strong> species that have been correctlyidentified <strong>and</strong> have an assigned indicator status (including UPL).For any species that occurs in more than one stratum, cover estimates aresummed across strata. Steps for determining <strong>the</strong> prevalence index are asfollows:1. Identify <strong>and</strong> estimate <strong>the</strong> absolute percent cover <strong>of</strong> each species in eachstratum <strong>of</strong> <strong>the</strong> community. Sum <strong>the</strong> cover estimates for any species that ispresent in more than one stratum.
ERDC/EL TR-12-5 232. Organize all species (across all strata) into groups according to <strong>the</strong>irwetl<strong>and</strong> indicator status (i.e., OBL, FACW, FAC, FACU, or UPL) <strong>and</strong> sum<strong>the</strong>ir cover values within groups. Do not include species that were notidentified.3. Calculate <strong>the</strong> prevalence index using <strong>the</strong> following formula:PI =A + 2A + 3A + 4A + 5AAOBL + AFACW + AFAC + AFACU + AUPLOBL FACW FAC FACU UPLwhere:PI = Prevalence index;A OBL = Summed percent cover values <strong>of</strong> obligate (OBL) plant species;A FACW = Summed percent cover values <strong>of</strong> facultative wetl<strong>and</strong> (FACW)plant species;A FAC = Summed percent cover values <strong>of</strong> facultative (FAC) plantspecies;A FACU = Summed percent cover values <strong>of</strong> facultative upl<strong>and</strong> (FACU)plant species; <strong>and</strong>A UPL = Summed percent cover values <strong>of</strong> upl<strong>and</strong> (UPL) plant species.See Table 4 for an example calculation <strong>of</strong> <strong>the</strong> prevalence index using <strong>the</strong>same data set as in Table 3. The following web link provides free publicdomains<strong>of</strong>tware for simultaneous calculation <strong>of</strong> <strong>the</strong> 50/20 rule, dominancetest, <strong>and</strong> prevalence index: http://www.crrel.usace.army.mil/rsgisc/wetshed/wetdatashed.htm.
ERDC/EL TR-12-5 24Indicator StatusGroupTable 4. Example <strong>of</strong> <strong>the</strong> prevalence index using <strong>the</strong> same data as in Table 3.Species NameAbsolutePercent Coverby SpeciesTotalCover byGroupMultiplyby: 1OBL species Ludwigia palustris 5 5 1 5FACW speciesFAC speciesFACU speciesCarex alligataCyperus haspanCheirodendron trigynumCibotium chamissoiMetrosideros polymorpha 2Peperomia membranaceaUncinia uncinataDicranopteris linearisFreycinetia arboreaSadleria cya<strong>the</strong>oides1525 40 2 80Product201575105 125 3 37510155 30 4 120UPL species None 0 0 5 0Sum 200 (A) 580 (B)HydrophyticVegetationDeterminationPrevalence Index = B/A = 580/200 = 2.90Therefore, this community is hydrophytic by Indicator 3(Prevalence Index).1 Where OBL = 1, FACW = 2, FAC = 3, FACU = 4, <strong>and</strong> UPL = 5.2 Metrosideros polymorpha was recorded in two or more strata (see Table 3), so <strong>the</strong> cover estimates were summedacross strata.
ERDC/EL TR-12-5 253 Hydric Soil IndicatorsIntroductionThe National Technical Committee for Hydric Soils (NTCHS) defines ahydric soil as a soil that formed under conditions <strong>of</strong> saturation, flooding,or ponding long enough during <strong>the</strong> growing season to develop anaerobicconditions in <strong>the</strong> upper part (USDA Soil Conservation Service 1994). Mosthydric soils exhibit characteristic morphologies that result from repeatedperiods <strong>of</strong> saturation or inundation that last more than a few days. Saturationor inundation, when combined with microbial activity in <strong>the</strong> soil,causes <strong>the</strong> depletion <strong>of</strong> oxygen. This anaerobiosis promotes certain biogeochemicalprocesses, such as <strong>the</strong> accumulation <strong>of</strong> organic matter <strong>and</strong> <strong>the</strong>reduction, translocation, or accumulation <strong>of</strong> iron <strong>and</strong> o<strong>the</strong>r reducible elements.These processes result in distinctive characteristics that persist in<strong>the</strong> soil during both wet <strong>and</strong> dry periods, making <strong>the</strong>m particularly usefulfor identifying hydric soils in <strong>the</strong> field (USDA Natural ResourcesConservation Service 2010).This chapter presents indicators that are designed to help identify hydricsoils in <strong>the</strong> Hawai‘i <strong>and</strong> <strong>Pacific</strong> Isl<strong>and</strong>s Region. Indicators are not intendedto replace or relieve <strong>the</strong> requirements contained in <strong>the</strong> definition <strong>of</strong> ahydric soil. Therefore, a soil that meets <strong>the</strong> definition <strong>of</strong> a hydric soil ishydric whe<strong>the</strong>r or not it exhibits indicators. Guidance for identifyinghydric soils that lack indicators can be found later in this chapter (see <strong>the</strong>sections on documenting <strong>the</strong> site <strong>and</strong> its soils) <strong>and</strong> in Chapter 5 (DifficultWetl<strong>and</strong> Situations in <strong>the</strong> Hawai‘i <strong>and</strong> <strong>Pacific</strong> Isl<strong>and</strong>s Region).This list <strong>of</strong> indicators is dynamic; changes <strong>and</strong> additions are anticipatedwith new research <strong>and</strong> field testing. The indicators presented in thissupplement are a subset <strong>of</strong> <strong>the</strong> NTCHS Field Indicators <strong>of</strong> Hydric Soils in<strong>the</strong> United States (USDA Natural Resources Conservation Service [2010]or current version) that are commonly found in <strong>the</strong> region. Any change to<strong>the</strong> NTCHS Field Indicators <strong>of</strong> Hydric Soils in <strong>the</strong> United States representsa change to this subset <strong>of</strong> indicators for <strong>the</strong> Hawai‘i <strong>and</strong> <strong>Pacific</strong>Isl<strong>and</strong>s Region. The current version <strong>of</strong> <strong>the</strong> indicators can be found on <strong>the</strong>NRCS hydric soils web site (http://soils.usda.gov/use/hydric). To use <strong>the</strong> indicatorsproperly, a basic knowledge <strong>of</strong> soil/l<strong>and</strong>scape relationships is necessary.
ERDC/EL TR-12-5 26ConceptsAll <strong>of</strong> <strong>the</strong> hydric soil indicators presented in this supplement areapplicable throughout <strong>the</strong> region.Hydric soil indicators are formed predominantly by <strong>the</strong> accumulation orloss <strong>of</strong> iron, manganese, sulfur, or carbon compounds in a saturated <strong>and</strong>anaerobic environment. These processes <strong>and</strong> <strong>the</strong> features that develop aredescribed in <strong>the</strong> following paragraphs.Iron <strong>and</strong> manganese reduction, translocation, <strong>and</strong> accumulationIn an anaerobic environment, soil microbes reduce iron from <strong>the</strong> ferric(Fe 3+ ) to <strong>the</strong> ferrous (Fe 2+ ) form, <strong>and</strong> manganese from <strong>the</strong> manganic(Mn 4+ ) to <strong>the</strong> manganous (Mn 2+ ) form. Of <strong>the</strong> two, evidence <strong>of</strong> iron reductionis more commonly observed in soils. Areas in <strong>the</strong> soil where iron isreduced <strong>of</strong>ten develop characteristic bluish-gray or greenish-gray colorsknown as gley. Ferric iron is insoluble but ferrous iron easily enters <strong>the</strong>soil solution <strong>and</strong> may be moved or translocated to o<strong>the</strong>r areas <strong>of</strong> <strong>the</strong> soil.Areas that have lost iron typically develop characteristic gray or reddishgraycolors <strong>and</strong> are known as redox depletions. If a soil reverts to anaerobic state, iron that is in solution will oxidize <strong>and</strong> become concentratedin patches <strong>and</strong> along root channels <strong>and</strong> o<strong>the</strong>r pores. These areas <strong>of</strong> oxidizediron are called redox concentrations. Since water movement in <strong>the</strong>sesaturated or inundated soils can be multi-directional, redox depletions <strong>and</strong>concentrations can occur anywhere in <strong>the</strong> soil <strong>and</strong> have irregular shapes<strong>and</strong> sizes. Soils that are saturated <strong>and</strong> contain ferrous iron at <strong>the</strong> time <strong>of</strong>sampling may change color upon exposure to <strong>the</strong> air, as ferrous iron israpidly converted to ferric iron in <strong>the</strong> presence <strong>of</strong> oxygen. Such soils aresaid to have a reduced matrix (Vepraskas 1992).While indicators related to iron or manganese depletion or concentrationare <strong>the</strong> most common in hydric soils, <strong>the</strong>y cannot form in soils whoseparent materials are low in Fe or Mn. Soils formed in such materials mayhave low-chroma colors that are not related to saturation <strong>and</strong> reduction.In <strong>the</strong>se soils, morphological features formed through accumulation <strong>of</strong>organic matter may be present.
ERDC/EL TR-12-5 27Sulfate reductionSulfur is one <strong>of</strong> <strong>the</strong> last elements to be reduced by microbes in an anaerobicenvironment. The microbes convert SO 42− to H 2 S, or hydrogen sulfidegas. This results in a very pronounced “rotten egg” odor in some soils thatare inundated or saturated for very long periods. In non-saturated or noninundatedsoils, sulfate is not reduced <strong>and</strong> <strong>the</strong>re is no rotten egg odor. Thepresence <strong>of</strong> hydrogen sulfide is a strong indicator <strong>of</strong> a hydric soil, but thisindicator is found only in <strong>the</strong> wettest sites in soils that contain sulfurbearingcompounds.Organic matter accumulationSoil microbes use carbon compounds found in organic matter as an energysource. However, <strong>the</strong> rate at which organic carbon is utilized by soilmicrobes is considerably lower in a saturated <strong>and</strong> anaerobic environmentthan under aerobic conditions. Therefore, in saturated soils, partiallydecomposed organic matter may accumulate. The result in wetl<strong>and</strong>s is <strong>of</strong>ten<strong>the</strong> development <strong>of</strong> thick organic surfaces, such as peat or muck, or darkorganic-rich mineral surface layers.Non-saturated or non-inundated organic soils. Abundant rainfall<strong>and</strong>/or acid conditions can also slow <strong>the</strong> decomposition <strong>of</strong> organic matter.In <strong>the</strong>se situations, even some well-drained soils, under predominantlyaerobic conditions, can develop organic surface layers called folistic layers.These layers are not necessarily related to wetness. Most folistic layersconsist <strong>of</strong> poorly decomposed organic material (i.e., fibric or hemic material;see <strong>the</strong> following section), although some consist <strong>of</strong> highly decomposed(i.e., sapric) material. Folistic surface layers may overlie rock, a minerallayer, or saturated organic layers. They typically have moderate to strong,subangular blocky structure; that is, <strong>the</strong>y break naturally into aggregatesthat are angular to rounded in shape (Figure 5). Saturated muck layers, incontrast, are more homogeneous, without obvious aggregates or structuralunits. It may be necessary to involve a soil scientist with local knowledge tohelp distinguish folistic surface layers from saturated organic layers.Determining <strong>the</strong> texture <strong>of</strong> soil materials high in organiccarbon. Material high in organic carbon could fall into three categories:organic, mucky mineral, or mineral. In lieu <strong>of</strong> laboratory data, <strong>the</strong> followingestimation method can be used for soil material that is wet or nearlysaturated with water. This method may be inconclusive with loamy or
ERDC/EL TR-12-5 28Figure 5. A soil sample from <strong>the</strong> Isl<strong>and</strong> <strong>of</strong> Hawai‘i containing structured(subangular blocky) sapric, folistic material at <strong>the</strong> surface <strong>and</strong>unstructured (homogeneous) sapric material below. Only <strong>the</strong>unstructured sapric material (muck) indicates soil saturation.clayey textured mineral soils. Gently rub <strong>the</strong> wet soil material betweenforefinger <strong>and</strong> thumb. If upon <strong>the</strong> first or second rub <strong>the</strong> material feelsgritty, it is mineral soil material. If after <strong>the</strong> second rub <strong>the</strong> material feelsgreasy, it is ei<strong>the</strong>r mucky mineral or organic soil material. Gently rub <strong>the</strong>material two or three more times. If after <strong>the</strong>se additional rubs it feelsgritty or plastic, it is mucky mineral soil material; if it still feels greasy, it isorganic soil material. If <strong>the</strong> material is organic soil material, a fur<strong>the</strong>rdivision should be made, as follows.Organic soil materials are classified as sapric, hemic, or fibric based on <strong>the</strong>percentage <strong>of</strong> visible fibers observable with a h<strong>and</strong> lens in an undisturbedstate <strong>and</strong> after rubbing between thumb <strong>and</strong> fingers 10 times (Table 5).Table 5. Proportion <strong>of</strong> sample consisting <strong>of</strong> fibers visible with a h<strong>and</strong> lens.Soil TextureUnrubbed Rubbed Horizon Descriptor (Saturated Organic Soils)40% Fibric PeatAdapted from USDA Natural Resources Conservation Service (1999).
ERDC/EL TR-12-5 29If <strong>the</strong>re is a conflict between unrubbed <strong>and</strong> rubbed fiber content, rubbedcontent is used. Live roots are not considered. In saturated organicmaterials, <strong>the</strong> terms sapric, hemic, <strong>and</strong> fibric correspond to <strong>the</strong> texturesmuck, mucky peat, <strong>and</strong> peat, respectively (Table 5). The terms muck,mucky peat, <strong>and</strong> peat should only be used for organic accumulationsassociated with wetness.Ano<strong>the</strong>r field method for determining <strong>the</strong> degree <strong>of</strong> decomposition fororganic materials is a system modified from a method originally developedby L. von Post <strong>and</strong> described in detail in ASTM st<strong>and</strong>ard D 5715-00(http://www.astm.org/). This method is based on a visual examination <strong>of</strong> <strong>the</strong>color <strong>of</strong> <strong>the</strong> water that is expelled <strong>and</strong> <strong>the</strong> soil material remaining in <strong>the</strong>h<strong>and</strong> after a saturated sample is squeezed (Table 6). If a conflict occursbetween results for sapric, hemic, or fibric material using percent visiblefiber (Table 5) <strong>and</strong> degree <strong>of</strong> humification (Table 6), <strong>the</strong>n percent visiblefiber should be used.Degree <strong>of</strong>HumificationH1H2H3H4H5H6H7H8H9H10Table 6. Determination <strong>of</strong> degree <strong>of</strong> decomposition <strong>of</strong> organic materials.Nature <strong>of</strong> Material Extrudedupon SqueezingClear, colorless water; noorganic solids squeezed outYellowish water; no organicsolids squeezed outBrown, turbid water; noorganic solids squeezed outDark brown, turbid water; noorganic solids squeezed outTurbid water <strong>and</strong> someorganic solids squeezed outTurbid water; 1/3 <strong>of</strong> samplesqueezed outVery turbid water; 1/2 <strong>of</strong>sample squeezed outThick <strong>and</strong> pasty; 2/3 <strong>of</strong>sample squeezed outNo free water; nearly all <strong>of</strong>sample squeezed outNo free water; all <strong>of</strong> samplesqueezed outNature <strong>of</strong> Plant Structure inResidueUnaltered, fibrous,undecomposedAlmost unaltered, fibrousEasily identifiableVisibly altered butidentifiableRecognizable but vague,difficult to identifyIndistinct, pastyFaintly recognizable; fewremains identifiable, mostlyamorphousVery indistinctNo identifiable remainsCompletely amorphousHorizonDescriptorFibric(Peat)Hemic(Mucky peat)Sapric(Muck)
ERDC/EL TR-12-5 30CautionsA soil that is artificially drained or protected (for instance, by dikes orlevees) is still hydric if <strong>the</strong> soil in its undisturbed state would meet <strong>the</strong>definition <strong>of</strong> a hydric soil. To be identified as hydric, <strong>the</strong>se soils shouldgenerally have one or more <strong>of</strong> <strong>the</strong> indicators. However, not all areas thathave hydric soils will qualify as wetl<strong>and</strong>s, if <strong>the</strong>y no longer have wetl<strong>and</strong>hydrology or support hydrophytic vegetation.Morphological features that do not reflect contemporary or recent conditions<strong>of</strong> saturation <strong>and</strong> anaerobiosis are called relict features. Contemporary<strong>and</strong> relict hydric soil features can be difficult to distinguish.For example, nodules <strong>and</strong> concretions that are actively forming <strong>of</strong>ten havegradual or diffuse boundaries, whereas relict or degrading nodules <strong>and</strong>concretions have sharp boundaries (Vepraskas 1992). Guidance for some <strong>of</strong><strong>the</strong> most common problem hydric soils can be found in Chapter 5. Whensoil morphology seems inconsistent with <strong>the</strong> l<strong>and</strong>scape, vegetation, orobservable hydrology, it may be necessary to obtain <strong>the</strong> assistance <strong>of</strong> anexperienced soil or wetl<strong>and</strong> scientist to determine whe<strong>the</strong>r <strong>the</strong> soil is hydric.Procedures for sampling soilsObserve <strong>and</strong> document <strong>the</strong> siteBefore making any decision about <strong>the</strong> presence or absence <strong>of</strong> hydric soils,<strong>the</strong> overall site <strong>and</strong> how it interacts with <strong>the</strong> soil should be considered. Thequestions below, while not required to identify a hydric soil, can help toexplain why one is or is not present. Always look at <strong>the</strong> l<strong>and</strong>scape features<strong>of</strong> <strong>the</strong> immediate site <strong>and</strong> compare <strong>the</strong>m to <strong>the</strong> surrounding areas. Try tocontrast <strong>the</strong> features <strong>of</strong> wet <strong>and</strong> dry sites that are in close proximity. Whenobserving slope features, look first at <strong>the</strong> area immediately around <strong>the</strong>sampling point. For example, a nearly level bench or depression at <strong>the</strong>sampling point may be more important to site wetness than <strong>the</strong> overalll<strong>and</strong>form on which it occurs. By underst<strong>and</strong>ing how water moves across<strong>the</strong> site, <strong>the</strong> reasons for <strong>the</strong> presence or absence <strong>of</strong> hydric soil indicatorsshould be clear.If one or more <strong>of</strong> <strong>the</strong> hydric soil indicators given later in this chapter ispresent, <strong>the</strong>n <strong>the</strong> soil is hydric. If no hydric soil indicator is present, <strong>the</strong>additional site information below may be useful in documenting whe<strong>the</strong>r
ERDC/EL TR-12-5 31<strong>the</strong> soil is indeed non-hydric or if it might represent a “problem” hydricsoil that meets <strong>the</strong> hydric soil definition despite <strong>the</strong> absence <strong>of</strong> indicators.Hydrology–Is st<strong>and</strong>ing water observed on <strong>the</strong> site or is water observedin <strong>the</strong> soil pit? What is <strong>the</strong> depth <strong>of</strong> <strong>the</strong> water table in <strong>the</strong> area? Is <strong>the</strong>reindirect evidence <strong>of</strong> ponding or flooding?Slope–Is <strong>the</strong> site level or nearly level so that surface water does not run<strong>of</strong>f readily, or is it steeper where surface water would run <strong>of</strong>f from <strong>the</strong>soil?Slope shape–Is <strong>the</strong> surface concave (e.g., in a depression), where waterwould tend to collect <strong>and</strong> possibly pond on <strong>the</strong> soil surface? On hillsides,are <strong>the</strong>re convergent slopes (Figure 6), where surface or groundwatermay be directed toward a central stream or swale? Or is <strong>the</strong>surface or slope shape convex, causing water to run <strong>of</strong>f or disperse?ABFigure 6. Divergent slopes (A) disperse surface water,whereas convergent slopes (B) concentrate water.Surface flow paths are indicated by <strong>the</strong> arrows.L<strong>and</strong>form–Is <strong>the</strong> soil in a floodplain, flat, or drainageway that may besubject to seasonal high water tables or flooding? Is it at <strong>the</strong> toe <strong>of</strong> aslope (Figure 7) where run<strong>of</strong>f may tend to collect or where groundwatermay emerge at or near <strong>the</strong> surface? Has <strong>the</strong> microtopography beenaltered by cultivation or o<strong>the</strong>r disturbances?
ERDC/EL TR-12-5 32Figure 7. At <strong>the</strong> toe <strong>of</strong> a hill slope, <strong>the</strong> gradient is onlyslightly inclined or nearly level. Blue arrows representflow paths <strong>of</strong> surface water (solid arrow) <strong>and</strong>groundwater (dashed arrow).Soil materials–Is <strong>the</strong>re a restrictive layer in <strong>the</strong> soil that could slow orprevent <strong>the</strong> infiltration <strong>of</strong> water, perhaps resulting in a perched watertable or hillslope seep? Restrictive layers could include consolidatedbedrock, cemented layers such as duripans <strong>and</strong> petrocalcic horizons,layers <strong>of</strong> silt or substantial clay content, or strongly contrasting soiltextures (e.g., silt over s<strong>and</strong>). Or is <strong>the</strong>re relatively loose soil material orfractured bedrock that would allow <strong>the</strong> water to infiltrate?Vegetation–Does <strong>the</strong> vegetation at <strong>the</strong> site indicate wetter conditionsthan at o<strong>the</strong>r nearby sites, or is it similar to what is found at nearbyupl<strong>and</strong> sites?Observe <strong>and</strong> document <strong>the</strong> soilTo observe <strong>and</strong> document a hydric soil, first remove any loose leaves,needles, or bark from <strong>the</strong> soil surface. Do not remove <strong>the</strong> organic surfacelayers <strong>of</strong> <strong>the</strong> soil, which usually consist <strong>of</strong> plant remains in varying stages<strong>of</strong> decomposition. Dig a hole <strong>and</strong> describe <strong>the</strong> soil pr<strong>of</strong>ile. In general, <strong>the</strong>hole should be dug to <strong>the</strong> depth needed to document an indicator or toconfirm <strong>the</strong> absence <strong>of</strong> indicators. For most soils, <strong>the</strong> recommendedexcavation depth is approximately 20 in. (50 cm) from <strong>the</strong> soil surface,although a shallower soil pit may suffice for some indicators (e.g.,A2 - Histic Epipedon). Digging may be difficult in some areas due to rocks<strong>and</strong> hardpans, <strong>and</strong> shallow bedrock may limit excavation depths in manyareas. Use <strong>the</strong> completed pr<strong>of</strong>ile description to determine which hydricsoil indicators have been met (USDA Natural Resources ConservationService 2010).
ERDC/EL TR-12-5 33For soils with deep, dark surface layers, deeper examination may berequired when field indicators are not easily seen within 20 in. (50 cm) <strong>of</strong><strong>the</strong> surface. The accumulation <strong>of</strong> organic matter in <strong>the</strong>se soils may maskredoximorphic features in <strong>the</strong> surface layers. Examination to 40 in. (1 m)or more may be needed to determine whe<strong>the</strong>r <strong>the</strong>y meet <strong>the</strong> requirements<strong>of</strong> indicator A12 (Thick Dark Surface). A soil auger or probe may be usefulfor sampling soil materials below 20 in.Whenever possible, excavate <strong>the</strong> soil deep enough to determine if <strong>the</strong>re arelayers or materials present that might restrict soil drainage. This will helpto underst<strong>and</strong> why <strong>the</strong> soil may or may not be hydric. After a sufficientnumber <strong>of</strong> exploratory excavations have been made to underst<strong>and</strong> <strong>the</strong> soilhydrologicrelationships at <strong>the</strong> site, subsequent excavations can be limitedto <strong>the</strong> depth needed to identify hydric soil indicators. Consider takingphotographs <strong>of</strong> both <strong>the</strong> soil <strong>and</strong> <strong>the</strong> overall site, including a clearlymarked measurement scale in soil pictures.Depths used in <strong>the</strong> indicators are measured from <strong>the</strong> muck surface, orfrom <strong>the</strong> mineral soil surface if a muck surface is absent. For indicators A1(Histosol), A2 (Histic Epipedon), <strong>and</strong> A3 (Black Histic), depths are measuredfrom <strong>the</strong> top <strong>of</strong> <strong>the</strong> organic material (peat, mucky peat, or muck), orfrom <strong>the</strong> top <strong>of</strong> any mineral material that may overlie <strong>the</strong> organic layer.This protocol for making soil-depth measurements as part <strong>of</strong> a hydric soildetermination may differ from st<strong>and</strong>ard procedures used to describe soilsfor o<strong>the</strong>r purposes.All colors noted in this supplement refer to moist Munsell® colors(Gretag/Macbeth 2000). Dry soils should be moistened until <strong>the</strong> color nolonger changes <strong>and</strong> wet soils should be allowed to dry until <strong>the</strong>y no longerglisten. Care should be taken to avoid over-moistening dry soil. Soil colorsspecified in <strong>the</strong> indicators do not have decimal points (except for indicatorA12); however, intermediate colors do occur between Munsell chips. Soilcolors should not be rounded to qualify as meeting an indicator. Forexample, a soil matrix with a chroma between 2 <strong>and</strong> 3 should be recorded ashaving a chroma <strong>of</strong> 2+. This soil material does not have a chroma <strong>of</strong> 2 <strong>and</strong>would not meet any indicator that requires a chroma <strong>of</strong> 2 or less.Always examine soil matrix colors in <strong>the</strong> field immediately after sampling.Ferrous iron, if present, can oxidize rapidly <strong>and</strong> create colors <strong>of</strong> higherchroma or redder hue. In soils that are saturated at <strong>the</strong> time <strong>of</strong> sampling,
ERDC/EL TR-12-5 34redox concentrations may be absent or difficult to see, particularly in darkcoloredsoils. It may be necessary to let <strong>the</strong> soil dry to a moist state (5 to30 minutes or more) for <strong>the</strong> iron or manganese to oxidize <strong>and</strong> redoxfeatures to become visible.Particular attention should be paid to changes in microtopography overshort distances. Small changes in elevation may result in repetitivesequences <strong>of</strong> hydric/non-hydric soils, making <strong>the</strong> delineation <strong>of</strong> individualareas <strong>of</strong> hydric <strong>and</strong> non-hydric soils difficult. Often <strong>the</strong> dominant condition(hydric or non-hydric) is <strong>the</strong> only reliable interpretation (also see <strong>the</strong>section on Wetl<strong>and</strong>/Non-Wetl<strong>and</strong> Mosaics in Chapter 5).Use <strong>of</strong> existing soil dataSoil surveysSoil surveys are available for most <strong>of</strong> <strong>the</strong> region <strong>and</strong> can provide usefulinformation regarding soil properties <strong>and</strong> soil moisture conditions for anarea. A list <strong>of</strong> available soil surveys is located at http://soils.usda.gov/survey/online_surveys/ <strong>and</strong> soil maps <strong>and</strong> data are available online from <strong>the</strong> Web SoilSurvey at http://websoilsurvey.nrcs.usda.gov/. Soil survey maps divide <strong>the</strong> l<strong>and</strong>scapeinto areas called map units. Map units usually contain more than one soiltype or component. They <strong>of</strong>ten contain several minor components orinclusions <strong>of</strong> soils with properties that may be similar to or quite differentfrom <strong>the</strong> major component. Those soils that are hydric are noted in <strong>the</strong>Hydric Soils List published separately from <strong>the</strong> soil survey report. Soilsurvey information can be valuable for planning purposes, but it is notsite-specific <strong>and</strong> is generally less detailed for areas at higher elevations in<strong>the</strong> isl<strong>and</strong>s than at lower elevations, due to differences in topography <strong>and</strong>access. Soil survey information does not preclude <strong>the</strong> need for an on-siteinvestigation.Hydric soils listsHydric Soils Lists are developed for each detailed soil survey. Using criteriaapproved by <strong>the</strong> NTCHS, <strong>the</strong>se lists rate each soil component as ei<strong>the</strong>rhydric or non-hydric based on soil property data. If <strong>the</strong> soil is rated ashydric, information is provided regarding which hydric criteria are met <strong>and</strong>on what l<strong>and</strong>form <strong>the</strong> soil typically occurs. Hydric Soils Lists are useful asgeneral background information for an on-site delineation. However, not allareas within a mapping unit or polygon identified as having hydric soils may
ERDC/EL TR-12-5 35be hydric. Conversely, inclusions <strong>of</strong> hydric soils may be found within soilmapping units where no hydric soils have been identified. Hydric Soils Listsin <strong>the</strong> region may identify only a limited number <strong>of</strong> hydric soil mappingunits; however, hydric soils exist throughout <strong>the</strong> region. The Hydric SoilsList should be used as a tool, indicating that hydric soil will likely be foundwithin a given area, but should never be used as a substitute for onsiteinvestigation <strong>and</strong> field indicators <strong>of</strong> hydric soils.Hydric Soils Lists developed for individual detailed soil surveys areknown as Local Hydric Soils Lists. They are available from state orcounty NRCS <strong>of</strong>fices <strong>and</strong> over <strong>the</strong> internet from <strong>the</strong> Soil Data Mart(http://soildatamart.nrcs.usda.gov/). Local Hydric Soils Lists have been compiledinto a National Hydric Soils List available at http://soils.usda.gov/use/hydric/.However, use <strong>of</strong> Local Hydric Soils Lists is preferred since <strong>the</strong>y are morecurrent <strong>and</strong> reflect local variations in soil properties.Hydric soil indicatorsMany <strong>of</strong> <strong>the</strong> hydric soil indicators were developed specifically for wetl<strong>and</strong>delineationpurposes. During <strong>the</strong> development <strong>of</strong> <strong>the</strong>se indicators, soils in<strong>the</strong> interior <strong>of</strong> wetl<strong>and</strong>s were not always examined; <strong>the</strong>refore, <strong>the</strong>re arewetl<strong>and</strong>s that lack any <strong>of</strong> <strong>the</strong> approved hydric soil indicators in <strong>the</strong> wettestinterior portions. Wetl<strong>and</strong> delineators <strong>and</strong> o<strong>the</strong>r users <strong>of</strong> <strong>the</strong> hydric soilindicators should concentrate <strong>the</strong>ir sampling efforts near <strong>the</strong> wetl<strong>and</strong> edge<strong>and</strong>, if <strong>the</strong>se soils are hydric, assume that soils in <strong>the</strong> wetter, interiorportions <strong>of</strong> <strong>the</strong> wetl<strong>and</strong> are also hydric even if <strong>the</strong>y lack an indicator.Hydric soil indicators are presented in three groups. Indicators for “AllSoils” are used in any soil regardless <strong>of</strong> texture. Indicators for “S<strong>and</strong>ySoils” are used in soil layers with USDA textures <strong>of</strong> loamy fine s<strong>and</strong> orcoarser. Indicators for “Loamy <strong>and</strong> Clayey Soils” are used with soil layers<strong>of</strong> loamy very fine s<strong>and</strong> <strong>and</strong> finer. Both s<strong>and</strong>y <strong>and</strong> loamy/clayey layers maybe present in <strong>the</strong> same soil pr<strong>of</strong>ile. Therefore, a soil that contains a loamysurface layer over s<strong>and</strong> is hydric if it meets all <strong>of</strong> <strong>the</strong> requirements <strong>of</strong>matrix color, amount <strong>and</strong> contrast <strong>of</strong> redox concentrations, depth, <strong>and</strong>thickness for a specific A (All Soils), F (Loamy <strong>and</strong> Clayey Soils), or S(S<strong>and</strong>y Soils) indicator. Additional indicators for problematic hydric soilsare presented on pages 54-57. These indicators are used in conjunctionwith <strong>the</strong> procedure given in Chapter 5.
ERDC/EL TR-12-5 36It is permissible to combine certain hydric soil indicators if all requirements<strong>of</strong> <strong>the</strong> individual indicators are met except thickness <strong>of</strong> <strong>the</strong> relevantlayer (see Hydric Soil Technical Note 4, http://soils.usda.gov/use/hydric/ntchs/tech_notes/index.html). The most restrictive requirements for thickness <strong>of</strong> layersin any indicators used must be met. Not all indicators are possible c<strong>and</strong>idatesfor combination. For example, indicator F2 (Loamy Gleyed Matrix)has no thickness requirement, so a site would ei<strong>the</strong>r meet <strong>the</strong> requirements<strong>of</strong> this indicator or it would not. Table 7 lists <strong>the</strong> indicators that are<strong>the</strong> most likely c<strong>and</strong>idates for combining in <strong>the</strong> region.IndicatorTable 7. Minimum thickness requirements for commonly combined indicatorsin <strong>the</strong> Hawai‘i <strong>and</strong> <strong>Pacific</strong> Isl<strong>and</strong>s Region.Thickness RequirementS5 – S<strong>and</strong>y RedoxS7 – Dark SurfaceF3 – Depleted MatrixF6 – Redox Dark SurfaceF7 – Depleted Dark Surface4 in. (10 cm) thick starting within 6 in. (15 cm) <strong>of</strong> <strong>the</strong> soil surface4 in. (10 cm) thick starting within 6 in. (15 cm) <strong>of</strong> <strong>the</strong> soil surface6 in. (15 cm) thick starting within 10 in. (25 cm) <strong>of</strong> <strong>the</strong> soil surface4 in. (10 cm) thick entirely within <strong>the</strong> upper 12 in. (30 cm)4 in. (10 cm) thick entirely within <strong>the</strong> upper 12 in. (30 cm)Table 8 presents an example <strong>of</strong> a soil in which a combination <strong>of</strong> layersmeets <strong>the</strong> requirements for indicators F6 (Redox Dark Surface) <strong>and</strong> F3(Depleted Matrix). The second layer meets <strong>the</strong> morphological characteristics<strong>of</strong> F6 <strong>and</strong> <strong>the</strong> third layer meets <strong>the</strong> morphological characteristics<strong>of</strong> F3, but nei<strong>the</strong>r meets <strong>the</strong> thickness requirement for its respectiveindicator (Table 7). However, <strong>the</strong> combined thickness <strong>of</strong> <strong>the</strong> second <strong>and</strong>third layers (7 in. [18 cm]) meets <strong>the</strong> more restrictive conditions <strong>of</strong> thicknessfor F3 (i.e., a minimum <strong>of</strong> 6 in. [15 cm] starting within 10 in. [25 cm]<strong>of</strong> <strong>the</strong> soil surface). Therefore, <strong>the</strong> soil is considered to be hydric based on<strong>the</strong> combination <strong>of</strong> indicators.Table 8. Example <strong>of</strong> a soil that is hydric based on a combination <strong>of</strong> indicators F6 <strong>and</strong> F3.Depth(inches)Matrix ColorRedox ConcentrationsColor Abundance ContrastTexture0 – 3 10YR 2/1 -- -- -- Loamy/clayey3 – 6 10YR 3/1 7.5YR 5/6 3 percent Prominent Loamy/clayey6 – 10 10YR 5/2 7.5YR 5/6 5 percent Prominent Loamy/clayey10 – 14 2.5Y 4/2 -- -- -- Loamy/clayey
ERDC/EL TR-12-5 37Ano<strong>the</strong>r situation in which it is appropriate to combine <strong>the</strong> characteristics<strong>of</strong> hydric soil indicators is when stratified textures <strong>of</strong> s<strong>and</strong>y (i.e., loamyfine s<strong>and</strong> <strong>and</strong> coarser) <strong>and</strong> loamy/clayey (i.e., loamy very fine s<strong>and</strong> <strong>and</strong>finer) material occur in <strong>the</strong> upper 12 in. (30 cm) <strong>of</strong> <strong>the</strong> soil. For example,<strong>the</strong> soil shown in Table 9 is hydric based on a combination <strong>of</strong> indicators F6(Redox Dark Surface) <strong>and</strong> S5 (S<strong>and</strong>y Redox). This soil meets <strong>the</strong> morphologicalcharacteristics <strong>of</strong> F6 in <strong>the</strong> first layer <strong>and</strong> S5 in <strong>the</strong> second layer, butnei<strong>the</strong>r layer by itself meets <strong>the</strong> thickness requirement for its respectiveindicator. However, <strong>the</strong> combined thickness <strong>of</strong> <strong>the</strong> two layers (6 in.) meets<strong>the</strong> more restrictive thickness requirement <strong>of</strong> ei<strong>the</strong>r indicator (4 in.).Table 9. Example <strong>of</strong> a soil that is hydric based on a combination <strong>of</strong> indicators F6 <strong>and</strong> S5.Depth(inches)MatrixColorRedox ConcentrationsColor Abundance ContrastTexture0 – 3 10YR 3/1 10YR 5/6 3 percent Prominent Loamy/clayey3 – 6 10YR 4/1 10YR 5/6 3 percent Prominent S<strong>and</strong>y6 – 16 10YR 4/1 -- -- -- Loamy/clayeyAll soils“All soils” refers to soils with any USDA soil texture. Use <strong>the</strong> followingindicators regardless <strong>of</strong> soil texture.Unless o<strong>the</strong>rwise noted, all mineral layers above any <strong>of</strong> <strong>the</strong> layers meetingan A indicator must have a dominant chroma <strong>of</strong> 2 or less, or <strong>the</strong> layer(s)with a dominant chroma <strong>of</strong> more than 2 must be less than 6 in. (15 cm)thick to meet any hydric soil indicator. Nodules <strong>and</strong> concretions are notconsidered to be redox concentrations unless o<strong>the</strong>rwise noted.
ERDC/EL TR-12-5 38Indicator A1: HistosolTechnical Description: Classifiesas a Histosol (except Folists).User Notes: In most Histosols,16 in. (40 cm) or more <strong>of</strong> <strong>the</strong> upper32 in. (80 cm) is organic soil material(Figure 8). Histosols also includesoils that have organic soil material <strong>of</strong>any thickness over rock or fragmentalsoil material that has interstices filledwith organic soil material. Organicsoil material has an organic carboncontent (by weight) <strong>of</strong> 12 to 18 percentor more, depending on <strong>the</strong> claycontent <strong>of</strong> <strong>the</strong> soil. The materialincludes muck (sapric soil material),mucky peat (hemic soil material), orpeat (fibric soil material); muck <strong>and</strong>mucky peat are <strong>the</strong> most commonFigure 8. Example <strong>of</strong> a Histosol, in which muck(sapric soil material) is greater than 3 ft(0.9 m) thick.across <strong>the</strong> region. See <strong>the</strong> glossary <strong>of</strong> Field Indicators <strong>of</strong> Hydric Soils in<strong>the</strong> United States (USDA Natural Resources Conservation Service 2010)for definitions <strong>of</strong> muck, mucky peat, peat, <strong>and</strong> organic soil material. Usecaution in areas that may have folistic surface layers; folistic layers do notmeet <strong>the</strong> requirements <strong>of</strong> this indicator. See <strong>the</strong> Concepts section <strong>of</strong> thischapter for field methods to identify organic soil materials, <strong>and</strong> AppendixA for <strong>the</strong> definition <strong>of</strong> fragmental soil material.Histosols are not known to occur on Moloka‘i or Lāna‘i <strong>and</strong> are <strong>of</strong> limitedextent on O‘ahu. Wet Histosols rarely occur on slopes greater than20 percent in this region <strong>and</strong> are most likely found in tidal areas that aresaturated most <strong>of</strong> <strong>the</strong> year. Shallow Histosols over lava bedrock are widespreadon <strong>the</strong> Isl<strong>and</strong> <strong>of</strong> Hawai‘i (Figure 9). Those in scattered depressionson pāhoehoe flows may be saturated for long periods each year. Saturatedorganic layers can be identified by <strong>the</strong>ir massive (homogeneous) structure,whereas unsaturated (folistic) layers typically have moderate to strongsubangular blocky structure.
ERDC/EL TR-12-5 39Figure 9. Thin organic soils (primarily Folists) are common over lava bedrock on <strong>the</strong>Isl<strong>and</strong> <strong>of</strong> Hawai‘i. However, saturated Histosols can be found on pāhoehoe flowsin scattered depressions that trap <strong>and</strong> hold water.Indicator A2: Histic EpipedonTechnical Description: A histicepipedon underlain by mineral soilmaterial with a chroma <strong>of</strong> 2 or less.User Notes: Most histic epipedonsare surface horizons 8 in. (20 cm) ormore thick <strong>of</strong> organic soil material(Figure 10). Aquic conditions or artificialdrainage are required (see SoilTaxonomy, USDA Natural ResourcesConservation Service 1999); however,aquic conditions can be assumed ifindicators <strong>of</strong> hydrophytic vegetation<strong>and</strong> wetl<strong>and</strong> hydrology are present.See <strong>the</strong> glossary <strong>of</strong> Field Indicators <strong>of</strong>Hydric Soils in <strong>the</strong> United States(USDA Natural Resources ConservationService 2010) for definitions.Figure 10. In this soil, <strong>the</strong> organic surface layer isabout 9 in. (23 cm) thick. Scale is in centimeters.
ERDC/EL TR-12-5 40See <strong>the</strong> Concepts section <strong>of</strong> this chapter for field methods to identifyorganic soil materials. See indicator A1 for organic carbon requirements.Slightly lower organic carbon contents are allowed in plowed soils. Usecaution in areas that may have folistic surface layers.Histic epipedons are not known to occur on Moloka‘i or Lāna‘i <strong>and</strong> are <strong>of</strong>limited extent on O‘ahu. Histic epipedons rarely occur on slopes greaterthan 20 percent in this region <strong>and</strong> are most likely found in tidal areas thatare saturated most <strong>of</strong> <strong>the</strong> year. Saturated organic layers generally havemassive (homogeneous) structure, whereas unsaturated (folistic) layerstypically have moderate to strong subangular blocky structure.Indicator A3: Black HisticTechnical Description: A layer <strong>of</strong> peat, mucky peat, or muck 8 in.(20 cm) or more thick that starts within 6 in. (15 cm) <strong>of</strong> <strong>the</strong> soil surface;has a hue <strong>of</strong> 10YR or yellower, value <strong>of</strong> 3 or less, <strong>and</strong> chroma <strong>of</strong> 1 or less;<strong>and</strong> is underlain by mineral soil material with a chroma <strong>of</strong> 2 or less.User Notes: This indicator does not require pro<strong>of</strong> <strong>of</strong> aquic conditions orartificial drainage. See <strong>the</strong> glossary <strong>of</strong> Field Indicators <strong>of</strong> Hydric Soils in<strong>the</strong> United States (USDA Natural Resources Conservation Service 2010)for definitions <strong>of</strong> peat, mucky peat, <strong>and</strong> muck. See <strong>the</strong> Concepts section <strong>of</strong>this chapter for field methods to identify organic soil materials. Seeindicator A1 for organic carbon requirements.This indicator is most likely to be associated with depressional wetl<strong>and</strong>sthat are ponded or saturated nearly all year, <strong>and</strong> flats in tidewater areas.The Black Histic indicator is generally not found at <strong>the</strong> boundary betweenwetl<strong>and</strong>s <strong>and</strong> non-wetl<strong>and</strong>s. Saturated organic layers generally havemassive (homogeneous) structure, whereas unsaturated (folistic) layerstypically have moderate to strong subangular blocky structure.Indicator A4: Hydrogen SulfideTechnical Description: A hydrogen sulfide (rotten egg) odor within12 in. (30 cm) <strong>of</strong> <strong>the</strong> soil surfaceUser Notes: Any time <strong>the</strong> soil smells <strong>of</strong> hydrogen sulfide (rotten eggodor), sulfur is currently being reduced <strong>and</strong> <strong>the</strong> soil is definitely in ananaerobic state. In some soils, <strong>the</strong> odor is pronounced; in o<strong>the</strong>rs it is very
ERDC/EL TR-12-5 41fleeting as <strong>the</strong> gas dissipates rapidly. If in doubt, quickly open severalsmall holes in <strong>the</strong> area <strong>of</strong> concern, <strong>and</strong> smell <strong>the</strong> in-place soil, to determineif a hydrogen sulfide odor is really present. This indicator is commonthroughout <strong>the</strong> region in permanently saturated or inundated tidal areas<strong>and</strong> rare in o<strong>the</strong>r environmental settings. Hydrogen sulfide odor is generallynot found at <strong>the</strong> boundary between wetl<strong>and</strong>s <strong>and</strong> non-wetl<strong>and</strong>s.Indicator A8: Muck PresenceTechnical Description: A layer <strong>of</strong> muck with a value <strong>of</strong> 3 or less <strong>and</strong>chroma <strong>of</strong> 1 or less within 6 in. (15 cm) <strong>of</strong> <strong>the</strong> soil surface.User Notes: The presence <strong>of</strong> muck <strong>of</strong> any thickness within 6 in. (15 cm)<strong>of</strong> <strong>the</strong> surface is <strong>the</strong> only requirement for this indicator. Normally, <strong>the</strong>layer is at <strong>the</strong> soil surface; however, it may occur at any depth within 6 in.(15 cm). Muck is sapric soil material with a minimum content <strong>of</strong> organiccarbon that ranges from 12 to 18 percent, depending on <strong>the</strong> content <strong>of</strong> clay.Organic soil material is called muck if virtually all <strong>of</strong> <strong>the</strong> material hasundergone sufficient decomposition to prevent <strong>the</strong> identification <strong>of</strong> plantparts. Hemic (mucky peat) <strong>and</strong> fibric (peat) soil materials do not qualify.Generally, muck is black <strong>and</strong> has a greasy feel; s<strong>and</strong> grains should not beevident. Use caution in areas where a thin layer <strong>of</strong> highly decomposed(sapric) material may be present below a coarser (fibric or hemic), dry,folistic surface layer. These soils do not become saturated or anaerobic <strong>and</strong>do not meet <strong>the</strong> definition <strong>of</strong> a hydric soil. Folistic layers that are highlydecomposed typically have moderate to strong subangular blocky structure.See <strong>the</strong> Concepts section <strong>of</strong> this chapter for field methods to identifyorganic soil materials.Indicator A11: Depleted Below Dark SurfaceTechnical Description: A layer with a depleted or gleyed matrix thathas 60 percent or more chroma <strong>of</strong> 2 or less, starting within 12 in. (30 cm)<strong>of</strong> <strong>the</strong> soil surface, <strong>and</strong> having a minimum thickness <strong>of</strong> ei<strong>the</strong>r:6 in. (15 cm), or2 in. (5 cm) if <strong>the</strong> 2 in. (5 cm) consists <strong>of</strong> fragmental soil material.Loamy/clayey layer(s) above <strong>the</strong> depleted or gleyed matrix must have avalue <strong>of</strong> 3 or less <strong>and</strong> chroma <strong>of</strong> 2 or less. Any s<strong>and</strong>y material above <strong>the</strong>depleted or gleyed matrix must have a value <strong>of</strong> 3 or less <strong>and</strong> chroma <strong>of</strong> 1 or
ERDC/EL TR-12-5 42less <strong>and</strong>, when observed with a 10- or 15-power h<strong>and</strong> lens, must have atleast 70 percent <strong>of</strong> <strong>the</strong> visible soil particles masked with organic material.When observed without a h<strong>and</strong> lens, <strong>the</strong> material appears to be nearly100 percent masked.User Notes: This indicator <strong>of</strong>tenoccurs in wet soils with dark-coloredsurface layers (Figure 11). For soilsthat have dark surface layers greaterthan 12 in. (30 cm) thick, use indicatorA12. Two percent or moredistinct or prominent redox concentrations,including iron/manganeses<strong>of</strong>t masses, pore linings, or both, arerequired in soils that have matrixvalues/chromas <strong>of</strong> 4/1, 4/2, <strong>and</strong> 5/2(Figure A1). If <strong>the</strong> soil is saturated at<strong>the</strong> time <strong>of</strong> sampling, it may benecessary to let it dry to a moist conditionfor redox features to becomevisible. Redox concentrations are notFigure 11. In this soil, a depleted matrix startsrequired for soils with matrix values immediately below <strong>the</strong> black surface layer at<strong>of</strong> 5 or more <strong>and</strong> chroma <strong>of</strong> 1, orapproximately 11 in. (28 cm).Scale is in centimeters.values <strong>of</strong> 6 or more <strong>and</strong> chromas <strong>of</strong>2 or 1. The low-chroma matrix must be caused by wetness <strong>and</strong> not be arelict or parent material feature. See <strong>the</strong> Glossary (Appendix A) fordefinitions <strong>of</strong> depleted matrix, gleyed matrix, distinct <strong>and</strong> prominentfeatures, <strong>and</strong> fragmental soil material.In some places, <strong>the</strong> gleyed matrix may change color upon exposure to air(reduced matrix). This phenomenon is included in <strong>the</strong> concept <strong>of</strong> a gleyedmatrix (USDA Natural Resources Conservation Service 2002).This indicator is common at <strong>the</strong> boundaries between wetl<strong>and</strong>s <strong>and</strong> nonwetl<strong>and</strong>sin dark-colored soils.Indicator A12: Thick Dark SurfaceTechnical Description: A layer at least 6 in. (15 cm) thick with adepleted or gleyed matrix that has 60 percent or more chroma <strong>of</strong> 2 or lessstarting below 12 in. (30 cm) <strong>of</strong> <strong>the</strong> surface. The layer(s) above <strong>the</strong>
ERDC/EL TR-12-5 43depleted or gleyed matrix must have a value <strong>of</strong> 2.5 or less <strong>and</strong> chroma <strong>of</strong>1 or less to a depth <strong>of</strong> at least 12 in. (30 cm) <strong>and</strong> a value <strong>of</strong> 3 or less <strong>and</strong>chroma <strong>of</strong> 1 or less in any remaining layers above <strong>the</strong> depleted or gleyedmatrix. Any s<strong>and</strong>y material above <strong>the</strong> depleted or gleyed matrix, whenobserved with a 10- or 15-power h<strong>and</strong> lens, must have at least 70 percent<strong>of</strong> <strong>the</strong> visible soil particles masked with organic material. When observedwithout a h<strong>and</strong> lens, <strong>the</strong> material appears to be nearly 100 percentmasked.User Notes: This soil has adepleted matrix or gleyed matrixbelow a black or very dark graysurface layer 12 in. (30 cm) ormore thick (Figure 12). This indicatoris most <strong>of</strong>ten associatedwith overthickened soils in concavel<strong>and</strong>scape positions. Twopercent or more distinct or prominentredox concentrations(Table A1), including iron/manganese s<strong>of</strong>t masses, porelinings, or both, are required insoils that have matrix values/chromas <strong>of</strong> 4/1, 4/2, <strong>and</strong> 5/2(Figure A1). If <strong>the</strong> soil is saturatedat <strong>the</strong> time <strong>of</strong> sampling, itmay be necessary to let it dry to amoist condition for redox featuresto become visible. Redoxconcentrations are not requiredin soils with matrix values <strong>of</strong> 5 ormore <strong>and</strong> chroma <strong>of</strong> 1, or values<strong>of</strong> 6 or more <strong>and</strong> chromas <strong>of</strong> 2 or1. The low-chroma matrix mustbe caused by wetness <strong>and</strong> not beFigure 12. Deep observations may be necessary to identify<strong>the</strong> depleted or gleyed matrix below a thick, dark surfacelayer. In this example, <strong>the</strong> depleted matrix starts at 20 in.(50 cm) (arrow).a relict or parent material feature. See <strong>the</strong> Glossary (Appendix A) for <strong>the</strong>definitions <strong>of</strong> depleted <strong>and</strong> gleyed matrix.
ERDC/EL TR-12-5 44In some places, <strong>the</strong> gleyed matrix may change color upon exposure to air(reduced matrix). This phenomenon is included in <strong>the</strong> concept <strong>of</strong> a gleyedmatrix (USDA Natural Resources Conservation Service 2002).This indicator is almost never found at <strong>the</strong> boundary between wetl<strong>and</strong>s<strong>and</strong> non-wetl<strong>and</strong>s <strong>and</strong> is much less common than indicators A11 (DepletedBelow Dark Surface), F3 (Depleted Matrix), <strong>and</strong> F6 (Redox Dark Surface).S<strong>and</strong>y soils“S<strong>and</strong>y soils” refers to soil materials with a USDA soil texture <strong>of</strong> loamy fines<strong>and</strong> <strong>and</strong> coarser. Use <strong>the</strong> following indicators in soil layers consisting <strong>of</strong>s<strong>and</strong>y soil materials.Unless o<strong>the</strong>rwise noted, all mineral layers above any <strong>of</strong> <strong>the</strong> layers meetingan S indicator must have a dominant chroma <strong>of</strong> 2 or less, or <strong>the</strong> layer(s)with a dominant chroma <strong>of</strong> more than 2 must be less than 6 in. (15 cm)thick to meet any hydric soil indicator. Nodules <strong>and</strong> concretions are notconsidered to be redox concentrationsunless o<strong>the</strong>rwise noted.Indicator S4: S<strong>and</strong>y Gleyed MatrixTechnical Description: A gleyedmatrix that occupies 60 percent or more<strong>of</strong> a layer starting within 6 in. (15 cm) <strong>of</strong><strong>the</strong> soil surface (Figure 13).User Notes: There is no thicknessrequirement for <strong>the</strong> gleyed layer in thisindicator. Gley colors are not synonymouswith gray colors. Gley colors are thosecolors that are on <strong>the</strong> gley pages (Gretag/Macbeth 2000). They have hue N, 10Y,5GY, 10GY, 5G, 10G, 5BG, 10BG, 5B, 10B,or 5PB, with a value <strong>of</strong> 4 or more. Soilswith dark gley colors (value less than 4)do not meet <strong>the</strong> definition <strong>of</strong> a gleyedmatrix <strong>and</strong> this indicator would not apply.If dark gley soil colors are present, usersshould consider indicators involving highFigure 13. In this example, <strong>the</strong> gleyed matrixbegins at <strong>the</strong> soil surface. Scale is in incheson <strong>the</strong> right.
ERDC/EL TR-12-5 45organic-matter content (e.g., A1, A2, A3) or dark-surface indicators (e.g.,A11, A12, F6). The gleyed matrix only has to start within 6 in. (15 cm) <strong>of</strong> <strong>the</strong>surface. See <strong>the</strong> Glossary (Appendix A) for <strong>the</strong> definition <strong>of</strong> a gleyedmatrix.This indicator is found in areas that are saturated for significant periods.Therefore, it is generally not found at <strong>the</strong> boundaries between wetl<strong>and</strong>s<strong>and</strong> non-wetl<strong>and</strong>s.Indicator S5: S<strong>and</strong>y RedoxTechnical Description: A layer starting within 6 in. (15 cm) <strong>of</strong> <strong>the</strong> soilsurface that is at least 4 in. (10 cm) thick <strong>and</strong> has a matrix with 60 percentor more chroma <strong>of</strong> 2 or less with 2 percent or more distinct or prominentredox concentrations occurring as s<strong>of</strong>t masses <strong>and</strong>/or pore linings(Figure 14).Figure 14. Redox concentrations (orange areas) in loamy fine s<strong>and</strong>on <strong>the</strong> Isl<strong>and</strong> <strong>of</strong> O‘ahu.User Notes: Distinct <strong>and</strong> prominent are defined in <strong>the</strong> Glossary (AppendixA). Redox concentrations include iron <strong>and</strong> manganese masses (reddishmottles) <strong>and</strong> pore linings (Vepraskas 1992). Common (2 to less than
ERDC/EL TR-12-5 4620 percent) to many (20 percent or more) redox concentrations (USDANatural Resources Conservation Service 2002) are required. If <strong>the</strong> soil issaturated at <strong>the</strong> time <strong>of</strong> sampling, it may be necessary to let it dry to amoist condition for redox features to become visible.Indicator S7: Dark SurfaceTechnical Description: A layer 4 in. (10 cm) thick starting within 6 in.(15 cm) <strong>of</strong> <strong>the</strong> soil surface with a matrix value <strong>of</strong> 3 or less <strong>and</strong> chroma <strong>of</strong> 1or less. When observed with a 10- or 15-power h<strong>and</strong> lens, at least 70 percent<strong>of</strong> <strong>the</strong> visible soil particles must be masked with organic material.When observed without a h<strong>and</strong> lens, <strong>the</strong> material appears to be nearly100 percent masked. The matrix color <strong>of</strong> <strong>the</strong> layer immediately below <strong>the</strong>dark layer must have <strong>the</strong> same colors as those described above or any colorthat has a chroma <strong>of</strong> 2 or less.User Notes: If <strong>the</strong> dark layer isgreater than 4 in. (10 cm) thick, <strong>the</strong>n<strong>the</strong> indicator is met, because any darksoil material in excess <strong>of</strong> 4 in. (10 cm)meets <strong>the</strong> requirement that “<strong>the</strong> layerimmediately below <strong>the</strong> dark layermust have <strong>the</strong> same colors as thosedescribed above….” If <strong>the</strong> dark layer isexactly 4 in. (10 cm) thick, <strong>the</strong>n <strong>the</strong>material immediately below must havea matrix chroma <strong>of</strong> 2 or less.The organic carbon content <strong>of</strong> thisindicator is slightly less than thatrequired for “mucky.” An undisturbedsample must be observed (Figure 15).Many moderately wet soils have aratio <strong>of</strong> about 50 percent <strong>of</strong> soil particlescovered or coated with organicmatter to about 50 percent uncoatedor uncovered soil particles, giving <strong>the</strong>soil a salt-<strong>and</strong>-pepper appearance.Where <strong>the</strong> percent coverage by organicmatter is less than 70 percent, a DarkSurface indicator is not present. DoFigure 15. This s<strong>and</strong>y soil has a dark surfaceapproximately 6 in. (15 cm) thick (bottomindicated by <strong>the</strong> arrow). Scale is in incheson <strong>the</strong> right side <strong>of</strong> <strong>the</strong> ruler.
ERDC/EL TR-12-5 47not confuse this indicator with dark s<strong>and</strong>s derived from black parentmaterials.Loamy <strong>and</strong> clayey soils“Loamy <strong>and</strong> clayey soils” refers to soil materials with USDA textures <strong>of</strong>loamy very fine s<strong>and</strong> <strong>and</strong> finer. Use <strong>the</strong> following indicators in soil layersconsisting <strong>of</strong> loamy or clayey soil materials.Unless o<strong>the</strong>rwise noted, all mineral layers above any <strong>of</strong> <strong>the</strong> layers meetingan F indicator, except for indicator F8, must have a dominant chroma <strong>of</strong> 2or less, or <strong>the</strong> layer(s) with a dominant chroma <strong>of</strong> more than 2 must beless than 6 in. (15 cm) thick to meet any hydric soil indicator. Nodules <strong>and</strong>concretions are not considered to be redox concentrations unless o<strong>the</strong>rwisenoted.Indicator F2: Loamy Gleyed MatrixTechnical Description: A gleyed matrix that occupies 60 percent ormore <strong>of</strong> a layer starting within 12 in. (30 cm) <strong>of</strong> <strong>the</strong> soil surface(Figure 16).User Notes: There is no thickness requirement for this indicator. Gleycolors are not synonymous with gray colors. Gley colors are those colorsthat are on <strong>the</strong> gley pages (Gretag/Macbeth 2000). They have a hue <strong>of</strong> N,10Y, 5GY, 10GY, 5G, 10G, 5BG, 10BG, 5B, 10B, or 5PB, with a value <strong>of</strong> 4 ormore. Soils with dark gley colors (value less than 4) do not meet <strong>the</strong> definition<strong>of</strong> a gleyed matrix <strong>and</strong> this indicator would not apply. If dark gleysoil colors are present, users should consider indicators for soils with highorganic-matter content (e.g., A1, A2, A3) or those involving dark surfacelayers (e.g., A11, A12, F6). The gleyed matrix only has to start within 12 in.(30 cm) <strong>of</strong> <strong>the</strong> surface. Soils with gleyed matrices are saturated for significantperiods; <strong>the</strong>refore, no minimum thickness <strong>of</strong> gleyed layer isrequired. See <strong>the</strong> Glossary (Appendix A) for <strong>the</strong> definition <strong>of</strong> a gleyedmatrix.This indicator is found in soils that are inundated or saturated for nearlyall <strong>of</strong> <strong>the</strong> growing season in most years <strong>and</strong> is not usually found at <strong>the</strong>boundaries between wetl<strong>and</strong>s <strong>and</strong> non-wetl<strong>and</strong>s.
ERDC/EL TR-12-5 48Figure 16. In this soil, a gleyed matrix begins immediately below <strong>the</strong> darksurface layer.Indicator F3: Depleted MatrixTechnical Description: A layer with a depleted matrix that has 60 percentor more chroma <strong>of</strong> 2 or less <strong>and</strong> that has a minimum thickness <strong>of</strong>ei<strong>the</strong>r:2 in. (5 cm) if <strong>the</strong> 2 in. (5 cm) is entirely within <strong>the</strong> upper 6 in. (15 cm)<strong>of</strong> <strong>the</strong> soil, or6 in. (15 cm) starting within 10 in. (25 cm) <strong>of</strong> <strong>the</strong> soil surface.User Notes: This is one <strong>of</strong> <strong>the</strong> most commonly observed hydric soil indicatorsat wetl<strong>and</strong> boundaries. Redox concentrations including iron/manganese s<strong>of</strong>t masses or pore linings, or both, are required in soils withmatrix values/chromas <strong>of</strong> 4/1, 4/2, <strong>and</strong> 5/2 (Figures 17 <strong>and</strong> 18). If <strong>the</strong> soil issaturated at <strong>the</strong> time <strong>of</strong> sampling, it may be necessary to let it dry to amoist condition for redox features to become visible. Redox concentrationsare not required in soils with matrix values <strong>of</strong> 5 or more <strong>and</strong> chroma <strong>of</strong> 1,or values <strong>of</strong> 6 or more <strong>and</strong> chromas <strong>of</strong> 2 or 1. The low-chroma matrix mustbe caused by wetness <strong>and</strong> not be a relict or parent material feature. See <strong>the</strong>Glossary (Appendix A) for <strong>the</strong> definition <strong>of</strong> a depleted matrix.
ERDC/EL TR-12-5 49Figure 17. Example <strong>of</strong> indicator F3 (Depleted Matrix),in which redox concentrations extend nearly to <strong>the</strong>surface.Figure 18. This soil has a depleted matrix with redoxconcentrations in a low-chroma matrix.
ERDC/EL TR-12-5 50Indicator F6: Redox Dark SurfaceTechnical Description: A layer that is at least 4 in. (10 cm) thick, isentirely within <strong>the</strong> upper 12 in. (30 cm) <strong>of</strong> <strong>the</strong> mineral soil, <strong>and</strong> has a:Matrix value <strong>of</strong> 3 or less <strong>and</strong> chroma <strong>of</strong> 1 or less <strong>and</strong> 2 percent or moredistinct or prominent redox concentrations occurring as s<strong>of</strong>t masses orpore linings, orMatrix value <strong>of</strong> 3 or less <strong>and</strong> chroma <strong>of</strong> 2 or less <strong>and</strong> 5 percent or moredistinct or prominent redox concentrations occurring as s<strong>of</strong>t masses orpore linings.User Notes: This is a verycommon indicator used todelineate wetl<strong>and</strong> boundariesin soils with darkcoloredsurface layers. Thelayer meeting <strong>the</strong> requirements<strong>of</strong> <strong>the</strong> indicator mayextend below 12 in. (30 cm)as long as at least 4 in.(10 cm) occurs within 12 in.(30 cm) <strong>of</strong> <strong>the</strong> surface.Redox concentrations are<strong>of</strong>ten small <strong>and</strong> difficult tosee in mineral soils thathave dark (value <strong>of</strong> 3 or less)surface layers due to highorganic-matter content(Figure 19). The organicmatter masks some or all <strong>of</strong>Figure 19. Redox features can be small <strong>and</strong> difficult to seewithin a dark soil layer.<strong>the</strong> concentrations that may be present; it also masks <strong>the</strong> diffuse boundaries<strong>of</strong> <strong>the</strong> concentrations <strong>and</strong> makes <strong>the</strong>m appear to be more sharp.Careful examination is required to see what are <strong>of</strong>ten brownish redoxconcentrations in <strong>the</strong> darkened materials. If <strong>the</strong> soil is saturated at <strong>the</strong>time <strong>of</strong> sampling, it may be necessary to let it dry at least to a moist conditionfor redox features to become visible. In some cases, fur<strong>the</strong>r drying<strong>of</strong> <strong>the</strong> samples makes <strong>the</strong> concentrations (if present) easier to see. A h<strong>and</strong>lens may be helpful in seeing <strong>and</strong> describing small redox concentrations.Care should be taken to examine <strong>the</strong> interiors <strong>of</strong> soil peds for redox concentrations.Dry colors, if used, also must have matrix chromas <strong>of</strong> 1 or 2,
ERDC/EL TR-12-5 51<strong>and</strong> <strong>the</strong> redox concentrations must be distinct or prominent (see <strong>the</strong>Glossary [Appendix A] for definitions).In soils that are wet because <strong>of</strong> subsurface saturation, <strong>the</strong> layer immediatelybelow <strong>the</strong> dark epipedon will likely have a depleted or gleyed matrix(see <strong>the</strong> Glossary for definitions). Soils that are wet because <strong>of</strong> ponding orhave a shallow, perched layer <strong>of</strong> saturation may not always have adepleted/gleyed matrix below <strong>the</strong> dark surface. It is recommended thatdelineators evaluate <strong>the</strong> hydrologic source <strong>and</strong> examine <strong>and</strong> describe <strong>the</strong>layer below <strong>the</strong> dark-colored epipedon when applying this indicator.Indicator F7: Depleted Dark SurfaceTechnical Description: Redoxdepletions with a value <strong>of</strong> 5 ormore <strong>and</strong> chroma <strong>of</strong> 2 or less in alayer that is at least 4 in. (10 cm)thick, is entirely within <strong>the</strong> upper12 in. (30 cm) <strong>of</strong> <strong>the</strong> mineral soil(Figure 20), <strong>and</strong> has a:Matrix value <strong>of</strong> 3 or less <strong>and</strong>chroma <strong>of</strong> 1 or less <strong>and</strong>10 percent or more redoxdepletions, orMatrix value <strong>of</strong> 3 or less <strong>and</strong>chroma <strong>of</strong> 2 or less <strong>and</strong>20 percent or more redoxdepletions.User Notes: Knowledge <strong>of</strong> localconditions is required in areaswhere light-colored, highlyleached layers <strong>and</strong>/or layers highin carbonates may be present. Figure 20. Redox depletions (lighter colored areas) areMixing <strong>of</strong> layers can be caused by scattered within <strong>the</strong> darker matrix. Scale is in centimeters.burrowing animals or cultivation.Pieces <strong>of</strong> deeper layers that become incorporated into <strong>the</strong> surface layer arenot redox depletions. Redox depletions are usually associated withmicrosites that have redox concentrations occurring as pore linings ormasses within <strong>the</strong> depletion(s) or surrounding <strong>the</strong> depletion(s). In soils
ERDC/EL TR-12-5 52that are wet because <strong>of</strong> subsurface saturation, <strong>the</strong> layer immediately below<strong>the</strong> dark surface is likely to have a depleted or gleyed matrix.Indicator F8: Redox DepressionsTechnical Description: In closed depressions subject to ponding,5 percent or more distinct or prominent redox concentrations occurring ass<strong>of</strong>t masses or pore linings in a layer that is 2 in. (5 cm) or more thick <strong>and</strong>is entirely within <strong>the</strong> upper 6 in. (15 cm) <strong>of</strong> <strong>the</strong> soil.User Notes: This indicatoroccurs on depressional l<strong>and</strong>forms,such as forested depressions<strong>and</strong> ephemeral pools(Figure 21); but not in microdepressionson convex l<strong>and</strong>scapes.Closed depressions <strong>of</strong>tenoccur within flats or floodplainl<strong>and</strong>scapes. Note that <strong>the</strong>re is nocolor requirement for <strong>the</strong> soilmatrix. The layer containingredox concentrations may extendbelow 6 in. (15 cm) as long as atleast 2 in. (5 cm) occurs within 6in. (15 cm) <strong>of</strong> <strong>the</strong> surface. If <strong>the</strong>soil is saturated at <strong>the</strong> time <strong>of</strong>sampling, it may be necessary tolet it dry to a moist condition for redox features to become visible. See <strong>the</strong>Glossary for definitions <strong>of</strong> distinct <strong>and</strong> prominent.This is a common but <strong>of</strong>ten overlooked indicator at <strong>the</strong> wetl<strong>and</strong>/nonwetl<strong>and</strong>boundary <strong>of</strong> depressional sites.Hydric soil indicators for problem soilsFigure 21. In this example, <strong>the</strong> layer <strong>of</strong> redox concentrationsbegins at <strong>the</strong> soil surface <strong>and</strong> is slightly more than 2 in.(5 cm) thick.The following indicators are not currently recognized for general applicationby <strong>the</strong> NTCHS, or are not recognized in this region. However, <strong>the</strong>seindicators may be used in problem wetl<strong>and</strong> situations in <strong>the</strong> Hawai‘i <strong>and</strong><strong>Pacific</strong> Isl<strong>and</strong>s Region where <strong>the</strong>re is evidence <strong>of</strong> wetl<strong>and</strong> hydrology <strong>and</strong>hydrophytic vegetation, <strong>and</strong> <strong>the</strong> soil is believed to meet <strong>the</strong> definition <strong>of</strong> ahydric soil despite <strong>the</strong> lack <strong>of</strong> o<strong>the</strong>r indicators <strong>of</strong> a hydric soil. To use <strong>the</strong>se
ERDC/EL TR-12-5 53indicators, follow <strong>the</strong> procedure describedin <strong>the</strong> section on Problematic Hydric Soilsin Chapter 5. If any <strong>of</strong> <strong>the</strong> followingindicators is observed, it is recommendedthat <strong>the</strong> NTCHS be notified by following <strong>the</strong>protocol described in <strong>the</strong> “Comment on <strong>the</strong>Indicators” section <strong>of</strong> Field Indicators <strong>of</strong>Hydric Soils in <strong>the</strong> United States (USDANatural Resources Conservation Service2010).Indicator A5: Stratified LayersTechnical Description: Several stratifiedlayers starting within 6 in. (15 cm) <strong>of</strong> <strong>the</strong> soilsurface. At least one <strong>of</strong> <strong>the</strong> layers has a value<strong>of</strong> 3 or less with a chroma <strong>of</strong> 1 or less or it ismuck, mucky peat, peat, or mucky modifiedmineral texture. The remaining layers havechromas <strong>of</strong> 2 or less (Figure 22). Any s<strong>and</strong>ymaterial that constitutes <strong>the</strong> layer with avalue <strong>of</strong> 3 or less <strong>and</strong> a chroma <strong>of</strong> 1 or less,when observed with a 10- or 15-power h<strong>and</strong>lens, must have at least 70 percent <strong>of</strong> <strong>the</strong>visible soil particles masked with organicmaterial (Figure 23). When observed withouta h<strong>and</strong> lens, <strong>the</strong> material appears to benearly 100 percent masked.User Notes: Use <strong>of</strong> this indicator mayrequire assistance from a soil scientist withlocal experience. An undisturbed samplemust be observed. Individual strata aredominantly less than 1 in. (2.5 cm) thick.Many alluvial soils have stratified layers atgreater depths; <strong>the</strong>se are not hydric soils.Many alluvial soils have stratified layers at<strong>the</strong> required depths, but lack a chroma <strong>of</strong> 2or less; <strong>the</strong>se do not fit this indicator.Stratified layers occur in any type <strong>of</strong> soilFigure 22. Stratified layers in loamymaterial. Scale is in inches on <strong>the</strong> right.Figure 23. Stratified layers in s<strong>and</strong>ymaterial. Scale is in inches on <strong>the</strong>right side <strong>of</strong> ruler.
ERDC/EL TR-12-5 54material, generally in floodplains <strong>and</strong> o<strong>the</strong>r areas where wet soils aresubject to rapid <strong>and</strong> repeated burial with thin deposits <strong>of</strong> sediment.Indicator S1: S<strong>and</strong>y Mucky MineralTechnical Description: A layer <strong>of</strong> muckymodified s<strong>and</strong>y soil material 2 in. (5 cm) ormore thick starting within 6 in. (15 cm) <strong>of</strong><strong>the</strong> soil surface (Figure 24).User Notes: This indicator is rare in <strong>the</strong>region <strong>and</strong> is most likely found on coastalflats <strong>and</strong> depressions. Mucky is a USDAtexture modifier for mineral soils. Theorganic carbon content is at least 5 percent<strong>and</strong> ranges up to 14 percent for s<strong>and</strong>y soils.The percentage requirement is dependentupon <strong>the</strong> clay content <strong>of</strong> <strong>the</strong> soil; <strong>the</strong> higher<strong>the</strong> clay content, <strong>the</strong> higher <strong>the</strong> organiccarbon requirement. See <strong>the</strong> glossary <strong>of</strong>Field Indicators <strong>of</strong> Hydric Soils in <strong>the</strong>United States (USDA Natural ResourcesConservation Service 2010) for <strong>the</strong> definition<strong>of</strong> mucky modified mineral texture. Afield procedure for identifying muckymineral soil material is presented in <strong>the</strong>Concepts section <strong>of</strong> this chapter.Figure 24. This mucky modified, s<strong>and</strong>ysurface layer is approximately 3 in. (7.5 cm)thick (bottom indicated by <strong>the</strong> arrow). Scalein inches on <strong>the</strong> right side <strong>of</strong> ruler.Indicator F21: Red Parent MaterialTechnical Description: A layer at least 10 cm (4 inches) thick, startingwithin 25 cm (10 inches) <strong>of</strong> <strong>the</strong> soil surface with a hue <strong>of</strong> 7.5YR or redder.The matrix has a value <strong>and</strong> chroma greater than 2 <strong>and</strong> less than or equal to4. The layer must contain 10 percent or more distinct or prominent redoxconcentrations occurring as s<strong>of</strong>t masses or pore linings <strong>and</strong>/or depletions.Redox depletions should differ in color by having:a. Value one or more higher <strong>and</strong> chroma one or more lower than<strong>the</strong> matrix, orb. Value <strong>of</strong> 4 or more <strong>and</strong> chroma <strong>of</strong> 2 or less.
ERDC/EL TR-12-5 55User Notes: This indicator was developed for use in areas <strong>of</strong> red parentmaterial, such as residuum in <strong>the</strong> Piedmont Province Triassic lowl<strong>and</strong>ssection or <strong>the</strong> Paleozoic “red beds” <strong>of</strong> <strong>the</strong> Appalachian Mountains, <strong>and</strong> inalluvium or colluvium derived from <strong>the</strong>se materials. In order to confirmthat it is appropriate to apply this indicator to particular soils, soils formedfrom similar parent materials in <strong>the</strong> area should have been evaluated todetermine <strong>the</strong>ir Color Change Propensity Index (CCPI) <strong>and</strong> be shown tohave CCPI values below 30 (Rabenhorst <strong>and</strong> Parikh, 2000.) It cannot beassumed that sediment overlying red colored bedrock is derived solelyfrom that bedrock.This indicator is typically found at <strong>the</strong> boundary between hydric <strong>and</strong> nonhydricsoils. Users who encounter a depleted matrix in <strong>the</strong> upper partshould consider F3-Depleted Matrix. F3 is <strong>of</strong>ten found in sites than areanaerobic for a longer period. Users that encounter a dark soil surface(value 3 or less <strong>and</strong> chroma 2 or less) should consider F6-Redox DarkSurface or F7-Depleted Dark Surface. If <strong>the</strong> site is in a closed depressionsubject to ponding users should consider F8-Redox Depressions. Seeglossary for definition <strong>of</strong> Red Parent Material.Indicator TF12: Very Shallow Dark SurfaceTechnical Description: In depressions <strong>and</strong> o<strong>the</strong>r concave l<strong>and</strong>forms,one <strong>of</strong> <strong>the</strong> following:1. If bedrock occurs between 6 in. (15 cm) <strong>and</strong> 10 in. (25 cm), a layer at least6 in. (15 cm) thick starting within 4 in. (10 cm) <strong>of</strong> <strong>the</strong> soil surface with avalue <strong>of</strong> 3 or less <strong>and</strong> chroma <strong>of</strong> 1 or less, <strong>and</strong> <strong>the</strong> remaining soil to bedrockmust have <strong>the</strong> same colors as above or any o<strong>the</strong>r color that has a chroma <strong>of</strong>2 or less.2. If bedrock occurs within 6 in. (15 cm), more than half <strong>of</strong> <strong>the</strong> soil thicknessmust have a value <strong>of</strong> 3 or less <strong>and</strong> chroma <strong>of</strong> 1 or less, <strong>and</strong> <strong>the</strong> remainingsoil to bedrock must have <strong>the</strong> same colors as above or any o<strong>the</strong>r color thathas a chroma <strong>of</strong> 2 or less.
ERDC/EL TR-12-5 564 Wetl<strong>and</strong> Hydrology IndicatorsIntroductionWetl<strong>and</strong> hydrology indicators are used in combination with indicators <strong>of</strong>hydric soil <strong>and</strong> hydrophytic vegetation to determine whe<strong>the</strong>r an area is awetl<strong>and</strong> under <strong>the</strong> <strong>Corps</strong> Manual. Indicators <strong>of</strong> hydrophytic vegetation <strong>and</strong>hydric soil generally reflect a site’s medium- to long-term wetness history.They provide readily observable evidence that episodes <strong>of</strong> inundation orsoil saturation lasting more than a few days during <strong>the</strong> growing seasonhave occurred repeatedly over a period <strong>of</strong> years <strong>and</strong> that <strong>the</strong> timing, duration,<strong>and</strong> frequency <strong>of</strong> wet conditions have been sufficient to produce acharacteristic wetl<strong>and</strong> plant community <strong>and</strong> hydric soil morphology. Ifhydrology has not been altered, vegetation <strong>and</strong> soils provide strong evidencethat wetl<strong>and</strong> hydrology is present (National Research Council 1995).Wetl<strong>and</strong> hydrology indicators provide evidence that <strong>the</strong> site has a continuingwetl<strong>and</strong> hydrologic regime <strong>and</strong> that hydric soils <strong>and</strong> hydrophytic vegetationare not relicts <strong>of</strong> a past hydrologic regime. Wetl<strong>and</strong> hydrology indicatorsconfirm that an episode <strong>of</strong> inundation or soil saturation occurredrecently, but may provide little additional information about <strong>the</strong> timing,duration, or frequency <strong>of</strong> such events (National Research Council 1995).Hydrology indicators are <strong>of</strong>ten <strong>the</strong> most transitory <strong>of</strong> wetl<strong>and</strong> indicators.Some hydrology indicators are naturally temporary or seasonal, <strong>and</strong> manyare affected by recent or long-term meteorological conditions. For example,indicators involving direct observation <strong>of</strong> surface water or saturatedsoils <strong>of</strong>ten are present only during <strong>the</strong> normal wet season <strong>and</strong> may beabsent during <strong>the</strong> dry season or during drier-than-normal years. Hydrologyindicators also may be subject to disturbance or destruction by naturalprocesses or human activities. Most wetl<strong>and</strong>s in <strong>the</strong> region will exhibit oneor more <strong>of</strong> <strong>the</strong> hydrology indicators presented in this chapter. However,some wetl<strong>and</strong>s may lack any <strong>of</strong> <strong>the</strong>se indicators due to dry conditions,disturbance, or o<strong>the</strong>r factors. Therefore, <strong>the</strong> lack <strong>of</strong> an indicator is notevidence for <strong>the</strong> absence <strong>of</strong> wetl<strong>and</strong> hydrology. See Chapter 5 (DifficultWetl<strong>and</strong> Situations in <strong>the</strong> Hawai‘i <strong>and</strong> <strong>Pacific</strong> Isl<strong>and</strong>s Region) for help inidentifying wetl<strong>and</strong>s that may lack wetl<strong>and</strong> hydrology indicators at certaintimes.
ERDC/EL TR-12-5 57The various isl<strong>and</strong>s in <strong>the</strong> region have subtropical <strong>and</strong> tropical climates,with annual precipitation ranging from approximately 10 to more than400 in. (255 to more than 10,160 mm) depending upon location, aspect,<strong>and</strong> topography. In <strong>the</strong> <strong>Hawaii</strong>an Isl<strong>and</strong>s, for example, annual rainfall isgreater on nor<strong>the</strong>astern, windward slopes, while areas in <strong>the</strong> rain shadow<strong>of</strong> prominent mountain ranges <strong>and</strong> peaks may be semiarid. The region isalso affected by tropical wea<strong>the</strong>r systems <strong>and</strong> occasional hurricanes <strong>and</strong>typhoons that can produce very heavy downpours. Some wetl<strong>and</strong> hydrologyindicators may be present on non-wetl<strong>and</strong> sites immediately after aheavy rain or during periods <strong>of</strong> unusually high precipitation, river stages,tides, or run<strong>of</strong>f. Therefore, it is important to consider wea<strong>the</strong>r <strong>and</strong> climaticconditions prior to <strong>the</strong> site visit to minimize both false-positive <strong>and</strong> falsenegativewetl<strong>and</strong> hydrology decisions. An underst<strong>and</strong>ing <strong>of</strong> normal seasonal,annual, <strong>and</strong> spatial variations in rainfall, temperature, <strong>and</strong> o<strong>the</strong>rclimatic conditions is important in interpreting hydrology indicators in <strong>the</strong>region. Some useful sources <strong>of</strong> climatic data are described in Chapter 5.Areas that have hydrophytic vegetation <strong>and</strong> hydric soils generally alsohave wetl<strong>and</strong> hydrology unless <strong>the</strong> hydrologic regime has changed due tonatural events or human activities (National Research Council 1995).Therefore, when wetl<strong>and</strong> hydrology indicators are absent from an areathat has indicators <strong>of</strong> hydric soil <strong>and</strong> hydrophytic vegetation, fur<strong>the</strong>rinformation may be needed to determine whe<strong>the</strong>r or not wetl<strong>and</strong> hydrologyis present. If possible, one or more site visits should be scheduled tocoincide with <strong>the</strong> normal wet season, <strong>the</strong> period <strong>of</strong> <strong>the</strong> year when <strong>the</strong>presence or absence <strong>of</strong> wetl<strong>and</strong> hydrology indicators is most likely toreflect <strong>the</strong> true wetl<strong>and</strong>/non-wetl<strong>and</strong> status <strong>of</strong> <strong>the</strong> site. In addition, aerialphotography or o<strong>the</strong>r remote-sensing data, stream gauge data, run<strong>of</strong>festimates, scope-<strong>and</strong>-effect equations for ditches <strong>and</strong> subsurface drainagesystems, or groundwater modeling are tools that may help to determinewhe<strong>the</strong>r wetl<strong>and</strong> hydrology is present when indicators are equivocal orlacking (e.g., USDA Natural Resources Conservation Service 1997). Finally,on highly disturbed or problematic sites, direct hydrologic monitoring maybe undertaken to determine whe<strong>the</strong>r wetl<strong>and</strong> hydrology is present. TheU.S. <strong>Army</strong> <strong>Corps</strong> <strong>of</strong> <strong>Engineers</strong> (2005) provides a technical st<strong>and</strong>ard formonitoring hydrology on such sites. This st<strong>and</strong>ard requires 14 or moreconsecutive days <strong>of</strong> flooding or ponding, or a water table 12 in. (30 cm) orless below <strong>the</strong> soil surface, during <strong>the</strong> growing season at a minimumfrequency <strong>of</strong> 5 years in 10 (50 percent or higher probability) (NationalResearch Council 1995), unless an alternative st<strong>and</strong>ard has been
ERDC/EL TR-12-5 58established for a particular region or wetl<strong>and</strong> type. See Chapter 5 forfur<strong>the</strong>r information on <strong>the</strong>se techniques.Growing seasonIn <strong>the</strong> Hawai‘i <strong>and</strong> <strong>Pacific</strong> Isl<strong>and</strong>s Region, <strong>the</strong> growing season for wetl<strong>and</strong>delineation purposes is year-round or 365 days long. The growing seasonis <strong>the</strong> period <strong>of</strong> <strong>the</strong> year when biological activity in plant roots <strong>and</strong> soilmicrobial populations is sufficient to bring about <strong>the</strong> depletion <strong>of</strong> oxygen<strong>and</strong> <strong>the</strong> chemical reduction <strong>of</strong> nitrogen, iron, <strong>and</strong> o<strong>the</strong>r elements in soilsthat become saturated for more than a few days. In this region, soiltemperatures are consistently above “biological zero” or 41 F (5 C) <strong>and</strong>significant biological activity occurs year-round, even at <strong>the</strong> highest elevations.Therefore, wetl<strong>and</strong> hydrology indicators are applicable throughout<strong>the</strong> year. In <strong>the</strong> event that recorded hydrologic data, such as streamgauge or water-table monitoring data, must be analyzed to determinewhe<strong>the</strong>r wetl<strong>and</strong> hydrology is present on highly disturbed or problematicsites, extended periods <strong>of</strong> flooding, ponding, or high water tables arerelevant at any time <strong>of</strong> year. See Chapter 5, section on Wetl<strong>and</strong>s thatPeriodically Lack Indicators <strong>of</strong> Wetl<strong>and</strong> Hydrology, for more information.Wetl<strong>and</strong> hydrology indicatorsIn this chapter, wetl<strong>and</strong> hydrology indicators are presented in four groups.Indicators in Group A are based on <strong>the</strong> direct observation <strong>of</strong> surface wateror groundwater during a site visit. Group B consists <strong>of</strong> evidence that <strong>the</strong>site is subject to flooding or ponding, although it may not be inundatedcurrently. These indicators include water marks, drift deposits, sedimentdeposits, <strong>and</strong> similar features. Group C consists <strong>of</strong> o<strong>the</strong>r evidence that <strong>the</strong>soil is saturated currently or was saturated recently. Some <strong>of</strong> <strong>the</strong>se indicators,such as oxidized rhizospheres surrounding living roots <strong>and</strong> <strong>the</strong>presence <strong>of</strong> reduced iron or sulfur in <strong>the</strong> soil pr<strong>of</strong>ile, indicate that <strong>the</strong> soilhas been saturated for an extended period. Group D consists <strong>of</strong> l<strong>and</strong>scape,vegetation, <strong>and</strong> soil features that indicate contemporary ra<strong>the</strong>r thanhistorical wet conditions. Wetl<strong>and</strong> hydrology indicators are intended asone-time observations <strong>of</strong> site conditions that are sufficient evidence <strong>of</strong>wetl<strong>and</strong> hydrology in areas where hydric soils <strong>and</strong> hydrophytic vegetationare present. Unless o<strong>the</strong>rwise noted, all <strong>of</strong> <strong>the</strong> indicators presented in thissupplement are applicable throughout <strong>the</strong> Hawai‘i <strong>and</strong> <strong>Pacific</strong> Isl<strong>and</strong>sRegion.
ERDC/EL TR-12-5 59Within each group, indicators are divided into two categories – primary<strong>and</strong> secondary – based on <strong>the</strong>ir estimated reliability in this region. Oneprimary indicator from any group is sufficient to conclude that wetl<strong>and</strong>hydrology is present; <strong>the</strong> area is a wetl<strong>and</strong> if indicators <strong>of</strong> hydric soil <strong>and</strong>hydrophytic vegetation are also present. In <strong>the</strong> absence <strong>of</strong> a primary indicator,two or more secondary indicators from any group are required toconclude that wetl<strong>and</strong> hydrology is present. Indicators <strong>of</strong> wetl<strong>and</strong> hydrologyinclude, but are not necessarily limited to, those listed in Table 10 <strong>and</strong>described on <strong>the</strong> following pages. O<strong>the</strong>r evidence <strong>of</strong> wetl<strong>and</strong> hydrologymay also be used with appropriate documentation.IndicatorTable 10. Wetl<strong>and</strong> hydrology indicators for <strong>the</strong> Hawai‘i <strong>and</strong> <strong>Pacific</strong> Isl<strong>and</strong>s Region.A1 – Surface waterA2 – High water tableA3 – SaturationB1 – Water marksB2 – Sediment depositsB3 – Drift depositsB4 – Algal mat or crustB5 – Iron depositsPrimaryGroup A – Observation <strong>of</strong> Surface Water or Saturated SoilsB7 – Inundation visible on aerial imageryB9 – Water-stained leavesB13 – Aquatic faunaB17 – Tilapia nestsB6 – Surface soil cracksB8 – Sparsely vegetated concave surfaceB10 – Drainage patternsC1 – Hydrogen sulfide odorGroup B – Evidence <strong>of</strong> Recent InundationGroup C – Evidence <strong>of</strong> Current or Recent Soil SaturationC3 – Oxidized rhizospheres along living rootsC4 – Presence <strong>of</strong> reduced ironC6 – Recent iron reduction in tilled soilsXXXXXXXXXXXXXXXXCategorySecondaryXXX
ERDC/EL TR-12-5 60CategoryIndicatorC7 – Thin muck surfacePrimaryXSecondaryC10 – Fiddler crab burrows X 1C2 – Dry-season water tableC5 – Salt depositsGroup D – Evidence from O<strong>the</strong>r Site Conditions or DataD1 – Stunted or stressed plantsD2 – Geomorphic positionD3 – Shallow aquitardD5 – FAC-neutral testXXXXXX1 Applicable to Guam, <strong>the</strong> Nor<strong>the</strong>rn Mariana Isl<strong>and</strong>s, <strong>and</strong> American Samoa.Group A – Observation <strong>of</strong> Surface Water or Saturated SoilsIndicator A1: Surface waterCategory: PrimaryGeneral Description: This indicator consists <strong>of</strong> <strong>the</strong> direct, visualobservation <strong>of</strong> surface water (flooding or ponding) during a site visit(Figure 25).Figure 25. A wetl<strong>and</strong> with surface water present, Waipi‘o Valley, Hawai‘i.
ERDC/EL TR-12-5 61Cautions <strong>and</strong> User Notes: Care must be used in applying this indicatorbecause surface water may be present in non-wetl<strong>and</strong> areas immediatelyafter a rainfall event or during periods <strong>of</strong> unusually high precipitation,run<strong>of</strong>f, tides, or stream flow. Fur<strong>the</strong>rmore, some non-wetl<strong>and</strong>s floodfrequently for brief periods. Note that surface water may be absent from awetl<strong>and</strong> during <strong>the</strong> normal dry season or during extended periods <strong>of</strong>drought. Even under normal rainfall conditions, some wetl<strong>and</strong>s do notbecome inundated or saturated every year (i.e., wetl<strong>and</strong>s are inundated orsaturated at least 5 out <strong>of</strong> 10 years, or 50 percent or higher probability). Inaddition, groundwater-dominated wetl<strong>and</strong> systems may never or rarelycontain surface water.Indicator A2: High water tableCategory: PrimaryGeneral Description: This indicator consists <strong>of</strong> <strong>the</strong> direct, visualobservation <strong>of</strong> <strong>the</strong> water table 12 in. (30 cm) or less below <strong>the</strong> surface in asoil pit, auger hole, or shallow monitoring well (Figure 26). This indicatorincludes water tables influenced by tides or derived from perched water,throughflow, or discharging groundwater (e.g., in seeps) that may bemoving laterally near <strong>the</strong> soil surface.Figure 26. High water table observed in a soil pit.Cautions <strong>and</strong> User Notes: Sufficient time must be allowed for water toinfiltrate into a newly dug hole <strong>and</strong> to stabilize at <strong>the</strong> water-table level. Therequired time will vary depending upon soil texture. In some cases, <strong>the</strong>water table can be determined by examining <strong>the</strong> wall <strong>of</strong> <strong>the</strong> soil pit <strong>and</strong>
ERDC/EL TR-12-5 62identifying <strong>the</strong> upper level at which water is seeping into <strong>the</strong> pit. Care mustbe used in interpreting this indicator because water-table levels normallyvary seasonally <strong>and</strong> are a function <strong>of</strong> both recent <strong>and</strong> long-term precipitation<strong>and</strong>, in coastal areas, may be influenced by tides. Even under normalrainfall conditions, some wetl<strong>and</strong>s do not become inundated or saturatedevery year (i.e., wetl<strong>and</strong>s are inundated or saturated at least 5 out <strong>of</strong> 10years, or 50 percent or higher probability). For an accurate determination<strong>of</strong> <strong>the</strong> water-table level, <strong>the</strong> soil pit, auger hole, or well should not penetrateany restrictive soil layer capable <strong>of</strong> perching water near <strong>the</strong> surface.Indicator A3: SaturationCategory: PrimaryGeneral Description: Visual observation <strong>of</strong> saturated soil conditions12 in. (30 cm) or less from <strong>the</strong> soil surface as indicated by water glisteningon <strong>the</strong> surfaces <strong>and</strong> broken interior faces <strong>of</strong> soil samples removed from <strong>the</strong>pit or auger hole (Figure 27). This indicator must be associated with anexisting water table located immediately below <strong>the</strong> saturated zone; however,this requirement is waived under episaturated conditions if <strong>the</strong>re is arestrictive soil layer or bedrock within 12 in. (30 cm) <strong>of</strong> <strong>the</strong> surface.Figure 27. Water glistens on <strong>the</strong> surface <strong>of</strong> a saturated soil sample.Cautions <strong>and</strong> User Notes: Glistening is evidence that <strong>the</strong> soil samplewas taken ei<strong>the</strong>r below <strong>the</strong> water table or within <strong>the</strong> saturated capillaryfringe above <strong>the</strong> water table. Recent rainfall events <strong>and</strong> <strong>the</strong> proximity <strong>of</strong>
ERDC/EL TR-12-5 63<strong>the</strong> water table at <strong>the</strong> time <strong>of</strong> sampling must be considered in applying <strong>and</strong>interpreting this indicator. Water observed in soil cracks or on <strong>the</strong> faces <strong>of</strong>soil aggregates (peds) does not meet this indicator unless ped interiors arealso saturated. Depth to <strong>the</strong> water table must be recorded on <strong>the</strong> data formor in field notes. A water table is not required below <strong>the</strong> saturated zoneunder episaturated conditions if <strong>the</strong> restrictive layer or bedrock is presentwithin 12 in. (30 cm) <strong>of</strong> <strong>the</strong> surface. Note <strong>the</strong> restrictive layer in <strong>the</strong> soilssection <strong>of</strong> <strong>the</strong> data form. The restrictive layer may be at <strong>the</strong> surface.Group B – Evidence <strong>of</strong> Recent InundationIndicator B1: Water marksCategory: PrimaryGeneral Description: Water marks are discolorations or stains on <strong>the</strong>bark <strong>of</strong> woody vegetation, rocks, bridge supports, buildings, fences, oro<strong>the</strong>r fixed objects as a result <strong>of</strong> inundation (Figures 28 <strong>and</strong> 29).Cautions <strong>and</strong> User Notes: When several water marks are present, <strong>the</strong>highest reflects <strong>the</strong> maximum extent <strong>of</strong> inundation. Water marks indicatea water-level elevation <strong>and</strong> can be extrapolated from nearby objects acrosslower elevation areas. Use caution with water marks that may have beencaused by extreme, infrequent, or very brief flooding events. Alongstreams subject to severe downcutting in recent years, water marks mayreflect historic ra<strong>the</strong>r than contemporary flooding levels.Figure 28. Water marks on rocks in a seasonally ponded depression.
ERDC/EL TR-12-5 64Figure 29. Water marks (dark stains) on trees in a seasonally inundatedwetl<strong>and</strong>. The top <strong>of</strong> one water mark is indicated by <strong>the</strong> arrow.Indicator B2: Sediment depositsCategory: PrimaryGeneral Description: Sediment deposits are thin layers or coatings <strong>of</strong>fine-grained mineral material (e.g., silt or clay) or organic matter (e.g.,pollen), sometimes mixed with o<strong>the</strong>r detritus, remaining on tree bark(Figure 30), plant stems or leaves, rocks, <strong>and</strong> o<strong>the</strong>r objects after surfacewater recedes.Figure 30. Silt deposit left after a recent high-water event forms a tancoating on <strong>the</strong>se tree trunks (upper edge indicated by <strong>the</strong> arrow).
ERDC/EL TR-12-5 65Cautions <strong>and</strong> User Notes: Sediment deposits most <strong>of</strong>ten occur inponded situations where water has stood for sufficient time to allowsuspended sediment to settle. Sediment deposits may remain for a considerableperiod before being removed by precipitation or subsequentinundation. Sediment deposits on vegetation or o<strong>the</strong>r objects indicate <strong>the</strong>minimum inundation level. This level can be extrapolated across lowerelevation areas. Use caution with sediment left after infrequent high flowsor very brief flooding events. This indicator does not include thick accumulations<strong>of</strong> s<strong>and</strong> or gravel in fluvial channels that may reflect historic flowconditions or recent extreme events.Indicator B3: Drift depositsCategory: PrimaryGeneral Description: Drift deposits consist <strong>of</strong> rafted debris that has beendeposited on <strong>the</strong> ground surface or entangled in vegetation or o<strong>the</strong>r fixedobjects (Figure 31). Debris consists <strong>of</strong> vegetation (e.g., branches, stems,leaves, seeds, <strong>and</strong> propagules), man-made litter, or o<strong>the</strong>r waterbornematerials. Drift material may be deposited at or near <strong>the</strong> high-water line inponded or flooded areas, piled against <strong>the</strong> upstream side <strong>of</strong> trees, rocks, <strong>and</strong>o<strong>the</strong>r fixed objects, or widely distributed within <strong>the</strong> dewatered area.Figure 31. Drift material caught on a fence <strong>and</strong> in low vegetationin a coastal wetl<strong>and</strong>.
ERDC/EL TR-12-5 66Cautions <strong>and</strong> User Notes: Deposits <strong>of</strong> drift material are <strong>of</strong>ten foundadjacent to streams or o<strong>the</strong>r sources <strong>of</strong> flowing water in wetl<strong>and</strong>s. Theyalso occur in tidal wetl<strong>and</strong>s, along lake shores, <strong>and</strong> in o<strong>the</strong>r ponded areas.The elevation <strong>of</strong> a drift line can be extrapolated across lower elevationareas. Use caution with drift lines that may have been caused by extreme,infrequent, or very brief flooding events, <strong>and</strong> in areas with functioningdrainage systems capable <strong>of</strong> removing excess water quickly.Indicator B4: Algal mat or crustCategory: PrimaryGeneral Description: This indicator consists <strong>of</strong> a mat or dried crust <strong>of</strong>algae, perhaps mixed with o<strong>the</strong>r detritus, left on or near <strong>the</strong> soil surfaceafter dewatering.Cautions <strong>and</strong> User Notes: Algal deposits include those produced bygreen algae (Chlorophyta) <strong>and</strong> blue-green algae (cyanobacteria). They maybe attached to low vegetation or o<strong>the</strong>r fixed objects, or may cover <strong>the</strong> soilsurface (Figures 32 <strong>and</strong> 33). Dried crusts <strong>of</strong> blue-green algae may crack<strong>and</strong> curl at plate margins (Figure 34). Algal deposits are usually seen incoastal flats, swales, <strong>and</strong> depressions; seasonally ponded areas; lakefringes; <strong>and</strong> low-gradient stream margins. They reflect prolonged wetconditions sufficient for algal growth <strong>and</strong> development.Figure 32. Algal mat in a recently ponded depression, Kawainui Marsh,O‘ahu.
ERDC/EL TR-12-5 67Figure 33. Drying algal mat surrounding a ponded depression near <strong>the</strong> SaddleRoad, Isl<strong>and</strong> <strong>of</strong> Hawai‘i.Figure 34. Dried crust <strong>of</strong> blue-green algae that has cracked <strong>and</strong> curled.
ERDC/EL TR-12-5 68Indicator B5: Iron depositsCategory: PrimaryGeneral Description: This indicator consists <strong>of</strong> a thin orange or yellowcrust or gel <strong>of</strong> oxidized iron on <strong>the</strong> soil surface or on objects near <strong>the</strong>surface.Cautions <strong>and</strong> User Notes: Iron deposits form in localized areas wherereduced iron discharges with groundwater <strong>and</strong> oxidizes upon exposure toair. The oxidized iron forms a film or sheen on st<strong>and</strong>ing water (Figure 35)<strong>and</strong> an orange or yellow deposit (Figure 36) on <strong>the</strong> ground surface afterdewatering. Iron sheen on water can be distinguished from an oily film bytouching with a stick or finger; iron films are crystalline <strong>and</strong> will crack intoangular pieces.Indicator B7: Inundation visible on aerial imageryCategory: PrimaryGeneral Description: One or more recent aerial photographs orsatellite images show <strong>the</strong> site to be inundated (Figure 37).Figure 35. Iron sheen on <strong>the</strong> water surface may be deposited as an orange or yellowcrust after dewatering.
ERDC/EL TR-12-5 69Figure 36. Iron deposit (reddish area) in a taro patch.Figure 37. Aerial photograph showing inundation within an emergent wetl<strong>and</strong> in<strong>the</strong> Ko‘olau Mountains on O‘ahu.
ERDC/EL TR-12-5 70Cautions <strong>and</strong> User Notes: Care must be used in applying this indicatorbecause surface water may be present on a non-wetl<strong>and</strong> site immediatelyafter a heavy rain or during periods <strong>of</strong> unusually high precipitation, run<strong>of</strong>f,tides, or stream flows. See Chapter 5 for procedures to evaluate <strong>the</strong> normality<strong>of</strong> precipitation prior to <strong>the</strong> photo date. Surface water may beabsent from a wetl<strong>and</strong> during <strong>the</strong> normal dry season or during extendedperiods <strong>of</strong> drought. Even under normal rainfall conditions, some wetl<strong>and</strong>sdo not become inundated or saturated every year (i.e., wetl<strong>and</strong>s are inundatedor saturated at least 5 out <strong>of</strong> 10 years, or 50 percent or higher probability).If available, it is recommended that multiple years <strong>of</strong> photographybe evaluated. If 5 or more years <strong>of</strong> aerial photos are available, <strong>the</strong> proceduredescribed in <strong>the</strong> Hydrology Tools for Wetl<strong>and</strong> Determination(USDA Natural Resources Conservation Service 1997, section 650.1903) isrecommended (see Chapter 5, section on Wetl<strong>and</strong>s that Periodically LackIndicators <strong>of</strong> Wetl<strong>and</strong> Hydrology, for additional information).Indicator B9: Water-stained leavesCategory: PrimaryGeneral Description: Water-stained leaves are fallen or recumbentdead leaves that have turned grayish or blackish in color due to inundationfor long periods.Cautions <strong>and</strong> User Notes: In this region, water-stained leaves are <strong>of</strong>tenfound in coastal wetl<strong>and</strong>s, depressional wetl<strong>and</strong>s, <strong>and</strong> along streams inshrub-dominated or forested habitats; however, <strong>the</strong>y also occur inherbaceous communities. Staining generally occurs in leaves that are incontact with <strong>the</strong> soil surface while inundated for long periods. Waterstainedleaves maintain <strong>the</strong>ir blackish or grayish colors when dry(Figures 38 <strong>and</strong> 39). They should contrast strongly with fallen leaves innearby non-wetl<strong>and</strong> l<strong>and</strong>scape positions. Use caution on windward slopeswhere frequent rainfall <strong>and</strong> wet surface conditions may produce waterstainedleaves in areas that normally do not pond or flood. In <strong>the</strong>se areas,check for additional evidence <strong>of</strong> wetl<strong>and</strong> hydrology, such as indicators <strong>of</strong>soil saturation.
ERDC/EL TR-12-5 71Figure 38. Water-stained leaves in a coastal wetl<strong>and</strong>.Figure 39. Water-stained hau (Hibiscus tiliaceus) leaves at Kawainui Marsh, O‘ahu.
ERDC/EL TR-12-5 72Indicator B13: Aquatic faunaCategory: PrimaryGeneral Description: Presence <strong>of</strong> live individuals, diapausing insecteggs or crustacean cysts, or dead remains <strong>of</strong> aquatic fauna, such assponges, bivalves, aquatic snails, aquatic insects, ostracods, shrimp, o<strong>the</strong>rcrustaceans, tadpoles, or fish, ei<strong>the</strong>r on <strong>the</strong> soil surface or clinging toplants or o<strong>the</strong>r emergent objects.Cautions <strong>and</strong> User Notes: Examples <strong>of</strong> dead remains include clamshells, chitinous exoskeletons (e.g., dragonfly nymphs), insect head capsules,aquatic snail shells, <strong>and</strong> skins or skeletons <strong>of</strong> aquatic amphibians orfish (Figures 40, 41, <strong>and</strong> 42). Aquatic fauna or <strong>the</strong>ir remains should bereasonably abundant; one or two individuals are not sufficient. Usecaution in areas where faunal remains may have been transported by highwinds, unusually high water, or o<strong>the</strong>r animals into non-wetl<strong>and</strong> areas.Shells <strong>and</strong> exoskeletons are resistant to tillage but may be moved by equipmentbeyond <strong>the</strong> boundaries <strong>of</strong> <strong>the</strong> wetl<strong>and</strong>. They may also persist in <strong>the</strong>soil for years after dewatering. Be careful not to mistake l<strong>and</strong> snails foraquatic species.Figure 40. Remains <strong>of</strong> fiddler crabs (Uca spp.) in a coastal wetl<strong>and</strong>.Fiddler crabs are found in American Samoa, Guam, <strong>and</strong> <strong>the</strong> Nor<strong>the</strong>rnMariana Isl<strong>and</strong>s, <strong>and</strong> are not known to occur in <strong>the</strong> <strong>Hawaii</strong>an Isl<strong>and</strong>s.
ERDC/EL TR-12-5 73Figure 41. Aquatic snails in a coastal wetl<strong>and</strong>.Figure 42. Dead fish in a dried pool near Wai‘anae, O‘ahu.
ERDC/EL TR-12-5 74Indicator B17: Tilapia nestsCategory: PrimaryGeneral Description: Presence <strong>of</strong> shallow, bowl-like depressionsformed in shallow water by nesting tilapia.Cautions <strong>and</strong> User Notes: The name tilapia is applied to a number <strong>of</strong>different fish species in <strong>the</strong> family Cichlidae that were introduced to <strong>the</strong><strong>Hawaii</strong>an Isl<strong>and</strong>s <strong>and</strong> o<strong>the</strong>r <strong>Pacific</strong> isl<strong>and</strong>s from Africa <strong>and</strong> Asia. Theyinhabit a wide range <strong>of</strong> freshwater, brackish, <strong>and</strong> saltwater habitats,including streams, reservoirs, coastal lagoons, <strong>and</strong> sheltered bays, <strong>and</strong> areraised for aquaculture. Male tilapia excavate shallow, bowl-like nests ins<strong>of</strong>t sediments to which <strong>the</strong>y entice females for breeding (Neil 1966;Popma <strong>and</strong> Masser 1999). The nests are typically 8 to 20 in. (20 to 50 cm)or more in diameter (Figures 43 <strong>and</strong> 44) <strong>and</strong> <strong>of</strong>ten occur in clusters alongshorelines. They persist <strong>and</strong> are visible after <strong>the</strong> surface water recedes.Tilapia are known to occur throughout <strong>the</strong> region except in <strong>the</strong> northwestern<strong>Hawaii</strong>an Isl<strong>and</strong>s. Their range in American Samoa is limited to afew locations, including <strong>the</strong> Aunu‘u Crater wetl<strong>and</strong>.Figure 43. Cluster <strong>of</strong> tilapia nests in a shallow pond.
ERDC/EL TR-12-5 75Figure 44. Tilapia nest along <strong>the</strong> fringe <strong>of</strong> a drying pool near Wai‘anae, O‘ahu.Indicator B6: Surface soil cracksCategory: SecondaryGeneral Description: Surface soil cracks consist <strong>of</strong> shallow cracks thatform when fine-grained mineral or organic sediments dry <strong>and</strong> shrink,<strong>of</strong>ten creating a network <strong>of</strong> cracks or small polygons (Figure 45).Cautions <strong>and</strong> User Notes: Surface soil cracks are <strong>of</strong>ten seen in recentlydeposited, fine sediments <strong>and</strong> in concave l<strong>and</strong>scape positions where waterhas ponded long enough to destroy surface soil structure, such as incoastal flats, depressions, lake fringes, <strong>and</strong> floodplains. Use caution, however,as <strong>the</strong>y may also occur in temporary ponds <strong>and</strong> puddles in nonwetl<strong>and</strong>s<strong>and</strong> in areas that have been effectively drained; <strong>the</strong>se areas areeasily distinguished by <strong>the</strong> absence <strong>of</strong> indicators <strong>of</strong> hydric soil <strong>and</strong>/orhydrophytic vegetation. This indicator does not include deep cracks due toshrink-swell action in clay soils (e.g., Vertisols).
ERDC/EL TR-12-5 76Figure 45. Surface soil cracks (<strong>and</strong> drift material)in a coastal wetl<strong>and</strong>.Indicator B8: Sparsely vegetated concave surfaceCategory: SecondaryGeneral Description: On concave l<strong>and</strong> surfaces (e.g., depressions <strong>and</strong>swales) <strong>and</strong> associated fringe areas, <strong>the</strong> ground surface is ei<strong>the</strong>r unvegetatedor sparsely vegetated (less than 5 percent ground cover) due to longdurationponding (Figure 46).Cautions <strong>and</strong> User Notes: Ponding <strong>of</strong> water for long periods can limit<strong>the</strong> establishment <strong>and</strong> growth <strong>of</strong> ground-layer vegetation. Sparsely vegetatedconcave surfaces should contrast with vegetated slopes <strong>and</strong> convexsurfaces in <strong>the</strong> same area. A woody overstory <strong>of</strong> trees or shrubs may ormay not be present. Examples in <strong>the</strong> region include, but are not limited to,depressional areas behind beach berms <strong>and</strong> roads in coastal areas, concavepositions on floodplains, <strong>and</strong> seasonally ponded depressions in flat l<strong>and</strong>scapes.They also may be associated with saline conditions in shallowdepressions on coastal flats.
ERDC/EL TR-12-5 77Figure 46. A sparsely vegetated depression in Batis-dominated coastal flats, nor<strong>the</strong>rnO‘ahu.Indicator B10: Drainage patternsCategory: SecondaryGeneral Description: This indicator consists <strong>of</strong> flow patterns visible on<strong>the</strong> soil surface or eroded into <strong>the</strong> soil, low vegetation bent over in <strong>the</strong>direction <strong>of</strong> flow, absence <strong>of</strong> leaf litter or small woody debris due t<strong>of</strong>lowing water, <strong>and</strong> similar evidence that water flowed across <strong>the</strong> groundsurface.Cautions <strong>and</strong> User Notes: Drainage patterns are usually seen in areaswhere water flows broadly over <strong>the</strong> surface <strong>and</strong> is not confined to a channel,such as in areas adjacent to streams, in seeps, slope wetl<strong>and</strong>s, vegetatedswales, <strong>and</strong> tidal flats (Figure 47). Use caution in areas subject tohigh winds or affected by recent extreme or unusual flooding events.
ERDC/EL TR-12-5 78Figure 47. Vegetation bent over in <strong>the</strong> direction <strong>of</strong> water flow across a streamterrace.Group C – Evidence <strong>of</strong> Current or Recent Soil SaturationIndicator C1: Hydrogen sulfide odorCategory: PrimaryGeneral Description: A hydrogen sulfide (rotten egg) odor within 12 in.(30 cm) <strong>of</strong> <strong>the</strong> soil surface.Cautions <strong>and</strong> User Notes: Hydrogen sulfide is a gas produced by soilmicrobes in response to prolonged saturation in soils where oxygen,nitrogen, manganese, <strong>and</strong> iron have been largely reduced <strong>and</strong> <strong>the</strong>re is asource <strong>of</strong> sulfur. For hydrogen sulfide to be detectable, <strong>the</strong> soil must besaturated at <strong>the</strong> time <strong>of</strong> sampling <strong>and</strong> must have been saturated longenough to become highly reduced. These soils are <strong>of</strong>ten permanentlysaturated <strong>and</strong> anaerobic at or near <strong>the</strong> surface. To apply this indicator, dig<strong>the</strong> soil pit no deeper than 12 in. to avoid release <strong>of</strong> hydrogen sulfide fromdeeper in <strong>the</strong> pr<strong>of</strong>ile. Hydrogen sulfide odor serves as both an indicator <strong>of</strong>hydric soil <strong>and</strong> wetl<strong>and</strong> hydrology. This single observation proves that <strong>the</strong>soil meets <strong>the</strong> definition <strong>of</strong> a hydric soil (i.e., anaerobic in <strong>the</strong> upper part),plus has an ongoing wetl<strong>and</strong> hydrologic regime. Often <strong>the</strong>se soils have a
ERDC/EL TR-12-5 79high water table (wetl<strong>and</strong> hydrology indicator A2), but <strong>the</strong> hydrogensulfide odor provides fur<strong>the</strong>r pro<strong>of</strong> that <strong>the</strong> soil has been saturated for along period <strong>of</strong> time. This indicator is common throughout <strong>the</strong> region inpermanently saturated or inundated tidal areas <strong>and</strong> rare in o<strong>the</strong>renvironmental settings.Indicator C3: Oxidized rhizospheres along living rootsCategory: PrimaryGeneral Description: Presence <strong>of</strong> a layer containing 2 percent or moreiron-oxide coatings or plaques on <strong>the</strong> surfaces <strong>of</strong> living roots <strong>and</strong>/or ironoxidecoatings or linings on soil pores immediately surrounding livingroots within 12 in. (30 cm) <strong>of</strong> <strong>the</strong> soil surface (Figures 48 <strong>and</strong> 49).Cautions <strong>and</strong> User Notes: Oxidized rhizospheres are <strong>the</strong> result <strong>of</strong>oxygen leakage from living roots into <strong>the</strong> surrounding anoxic soil, causingoxidation <strong>of</strong> ferrous iron present in <strong>the</strong> soil solution. They are evidence <strong>of</strong>saturated <strong>and</strong> reduced soil conditions during <strong>the</strong> plant’s lifetime. Iron concentrationsor plaques may form on <strong>the</strong> immediate root surface or may coat<strong>the</strong> soil pore adjacent to <strong>the</strong> root. In ei<strong>the</strong>r case, <strong>the</strong> oxidized iron must beassociated with living roots to indicate contemporary wet conditions <strong>and</strong> todistinguish <strong>the</strong>se features from o<strong>the</strong>r pore linings. Care must be taken todistinguish iron-oxide coatings from organic matter associated with plantroots. Viewing with a h<strong>and</strong> lens may help to distinguish mineral fromorganic material <strong>and</strong> to identify oxidized rhizospheres along fine roots <strong>and</strong>root hairs. Iron coatings sometimes show concentric layers in cross sectionFigure 48. Iron-oxide plaque (orange coating) on a living root. Iron also coats<strong>the</strong> channel or pore from which <strong>the</strong> root was removed.
ERDC/EL TR-12-5 80Figure 49. Soil with oxidized rhizospheres surrounding many fine roots.<strong>and</strong> may transfer iron stains to <strong>the</strong> fingers when rubbed. Note <strong>the</strong> location<strong>and</strong> abundance <strong>of</strong> oxidized rhizospheres in <strong>the</strong> soil pr<strong>of</strong>ile description orremarks section <strong>of</strong> <strong>the</strong> data form. There is no minimum thicknessrequirement for <strong>the</strong> layer containing oxidized rhizospheres. Oxidizedrhizospheres must occupy at least 2 percent <strong>of</strong> <strong>the</strong> volume <strong>of</strong> <strong>the</strong> layer.Indicator C4: Presence <strong>of</strong> reduced ironCategory: PrimaryGeneral Description: Presence <strong>of</strong> a layer containing reduced (ferrous)iron in <strong>the</strong> upper 12 in. (30 cm) <strong>of</strong> <strong>the</strong> soil pr<strong>of</strong>ile, as indicated by a ferrousiron test or by <strong>the</strong> presence <strong>of</strong> a soil that changes color upon exposure to<strong>the</strong> air.Cautions <strong>and</strong> User Notes: The reduction <strong>of</strong> iron occurs in soils thathave been saturated long enough to become anaerobic <strong>and</strong> chemically
ERDC/EL TR-12-5 81reduced. Ferrous iron is converted to oxidized forms when saturation ends<strong>and</strong> <strong>the</strong> soil reverts to an aerobic state. Thus, <strong>the</strong> presence <strong>of</strong> ferrous ironindicates that <strong>the</strong> soil is saturated <strong>and</strong> anaerobic at <strong>the</strong> time <strong>of</strong> sampling,<strong>and</strong> has been saturated for an extended period. The presence <strong>of</strong> ferrousiron can be verified with alpha, alpha-dipyridyl reagent (Figure 50) or byobserving a soil that changes color upon exposure to air (i.e., reducedmatrix). A positive reaction to alpha, alpha-dipyridyl reagent should occurover more than 50 percent <strong>of</strong> <strong>the</strong> soil layer in question. The reagent doesnot react when wetl<strong>and</strong>s are dry; <strong>the</strong>refore, a negative test result is not evidencethat <strong>the</strong> soil is not reduced at o<strong>the</strong>r times <strong>of</strong> year. Soil samplesshould be tested or examined immediately after opening <strong>the</strong> soil pitbecause ferrous iron may oxidize <strong>and</strong> colors change soon after <strong>the</strong> sampleis exposed to <strong>the</strong> air. Avoid areas <strong>of</strong> <strong>the</strong> soil that may have been in contactwith iron digging tools. Soils that contain little wea<strong>the</strong>rable iron may notreact even when saturated <strong>and</strong> reduced. There are no minimum thicknessrequirements or initial color requirements for <strong>the</strong> soil layer in question.Figure 50. When alpha, alpha-dipyridyl is applied to a soil containingreduced iron, a positive reaction is indicated by a pink or redcoloration to <strong>the</strong> treated area.Indicator C6: Recent iron reduction in tilled soilsCategory: PrimaryGeneral Description: Presence <strong>of</strong> a layer containing 2 percent or moreredox concentrations as pore linings or s<strong>of</strong>t masses in <strong>the</strong> tilled surface
ERDC/EL TR-12-5 82layer <strong>of</strong> soils cultivated within <strong>the</strong> last two years. The layer containingredox concentrations must be within <strong>the</strong> tilled zone or within 12 in.(30 cm) <strong>of</strong> <strong>the</strong> soil surface, whichever is shallower.Cautions <strong>and</strong> User Notes: Cultivation breaks up or destroys redoxfeatures in <strong>the</strong> plow zone. The presence <strong>of</strong> continuous <strong>and</strong> unbroken redoxfeatures indicates that <strong>the</strong> soil was saturated <strong>and</strong> reduced since <strong>the</strong> lastepisode <strong>of</strong> cultivation (Figure 51). Redox features <strong>of</strong>ten form aroundorganic material, such as crop residue, incorporated into <strong>the</strong> tilled soil.Use caution with older features that may be broken up but not destroyedby tillage. The indicator is most reliable in areas that are cultivated regularly,so that soil aggregates <strong>and</strong> older redox features are more likely to bebroken up. If not obvious, information about <strong>the</strong> timing <strong>of</strong> last cultivationmay be available from <strong>the</strong> l<strong>and</strong> owner. A plow zone <strong>of</strong> 6 to 8 in. (15 to20 cm) depth is typical but may extend deeper. There is no minimumthickness requirement for <strong>the</strong> layer containing redox concentrations.Figure 51. Redox concentrations in <strong>the</strong> tilled surface layer<strong>of</strong> a recently cultivated soil.
ERDC/EL TR-12-5 83Indicator C7: Thin muck surfaceCategory: PrimaryGeneral Description: This indicator consists <strong>of</strong> a layer <strong>of</strong> muck 1 in.(2.5 cm) or less thick at <strong>the</strong> soil surface.Cautions <strong>and</strong> User Notes: Muck is highly decomposed organic materialthat has accumulated due to wetness (see <strong>the</strong> Concepts section <strong>of</strong> Chapter3 for guidance on identifying muck). In this region, muck accumulatesonly where soils are saturated to <strong>the</strong> surface for long periods each year.Thick muck layers can persist for years after wetl<strong>and</strong> hydrology iseffectively removed; <strong>the</strong>refore, a muck layer greater than 1 in. (2.5 cm)thick does not qualify for this indicator. However, thin muck surfacesdisappear quickly or become incorporated into mineral horizons whenwetl<strong>and</strong> hydrology is withdrawn. Therefore, <strong>the</strong> presence <strong>of</strong> a thin mucklayer on <strong>the</strong> soil surface indicates an active wetl<strong>and</strong> hydrologic regime.This indicator does not include folistic surface layers, which are not causedby wetness. Folistic material that is highly decomposed generally exhibitsmoderate to strong subangular blocky structure (i.e., it breaks into naturalaggregates that are angular to rounded in shape). In muck, <strong>the</strong> organicmaterial is more homogeneous, without obvious aggregates or structuralunits.Indicator C10: Fiddler crab burrowsCategory: PrimaryGeneral Description: On coastal flats <strong>and</strong> shorelines, <strong>the</strong> presence <strong>of</strong>fiddler crab (Uca spp.) burrows, as indicated by openings in s<strong>of</strong>t soil ors<strong>and</strong> approximately 0.5 to 1 in. (1 to 2 cm) in diameter, <strong>of</strong>ten associatedwith excavated balls <strong>of</strong> mud or s<strong>and</strong> (Figure 52).Applicable Subregion: Territory <strong>of</strong> Guam, Commonwealth <strong>of</strong> <strong>the</strong>Nor<strong>the</strong>rn Mariana Isl<strong>and</strong>s, <strong>and</strong> Territory <strong>of</strong> American Samoa.Cautions <strong>and</strong> User Notes: Uca is a burrowing crab <strong>of</strong> <strong>the</strong> intertidal zonein salt marshes, tidal flats, mangrove swamps, <strong>and</strong> <strong>the</strong>ir fringes. Twospecies, U. crassipes <strong>and</strong> U. vocans, are known to inhabit Guam <strong>and</strong> <strong>the</strong>Mariana isl<strong>and</strong> chain; U. crassipes <strong>and</strong> o<strong>the</strong>r species also inhabit AmericanSamoa. Fiddler crabs are not known to occur in <strong>the</strong> <strong>Hawaii</strong>an Isl<strong>and</strong>s.
ERDC/EL TR-12-5 84Figure 52. Fiddler crab burrows <strong>and</strong> excavated soil.Fiddler crabs dig <strong>the</strong>ir burrows in intertidal wetl<strong>and</strong>s <strong>and</strong> in adjacent areaswhere <strong>the</strong> water table is generally within 12 in. (30 cm) <strong>of</strong> <strong>the</strong> surface (Shinn1968; Warner 1969; Thurman 1984; Grimes et al. 1989). They forage in <strong>the</strong>intertidal zone at low tide <strong>and</strong> seldom move far from <strong>the</strong>ir protectiveburrows. Fiddler crab burrows should not be confused with those <strong>of</strong> <strong>the</strong>l<strong>and</strong> crab (Cardisoma carnifex), which are larger (<strong>of</strong>ten 3 to 5 in. [8 to 12cm] in diameter) <strong>and</strong> are commonly located well above <strong>the</strong> high tide line(Micheli et al. 1991).Indicator C2: Dry-season water tableCategory: SecondaryGeneral Description: Visual observation <strong>of</strong> <strong>the</strong> water table between 12<strong>and</strong> 24 in. (30 <strong>and</strong> 60 cm) below <strong>the</strong> surface during <strong>the</strong> normal dry seasonor during a drier-than-normal year.Cautions <strong>and</strong> User Notes: Due to normal seasonal fluctuations, watertables in wetl<strong>and</strong>s <strong>of</strong>ten drop below 12 in. (30 cm) during <strong>the</strong> summer dryseason. A water table between 12 <strong>and</strong> 24 in. (30 <strong>and</strong> 60 cm) during <strong>the</strong> dryseason, or during an unusually dry year, indicates a normal wet-seasonwater table within 12 in. (30 cm) <strong>of</strong> <strong>the</strong> surface. Sufficient time must beallowed for water to infiltrate into a newly dug hole <strong>and</strong> to stabilize at <strong>the</strong>water-table level. The required time will vary depending upon soil texture.In some cases, <strong>the</strong> water table can be determined by examining <strong>the</strong> wall <strong>of</strong>
ERDC/EL TR-12-5 85<strong>the</strong> soil pit <strong>and</strong> identifying <strong>the</strong> upper level at which water is seeping into<strong>the</strong> pit. For an accurate determination <strong>of</strong> <strong>the</strong> water-table level, <strong>the</strong> soil pit,auger hole, or well should not penetrate any restrictive soil layer capable <strong>of</strong>perching water near <strong>the</strong> surface. Water tables in wetl<strong>and</strong>s <strong>of</strong>ten drop wellbelow 24 in. during dry periods. Therefore, a dry-season water table below24 in. does not necessarily indicate a lack <strong>of</strong> wetl<strong>and</strong> hydrology. Watertables are a function <strong>of</strong> both recent <strong>and</strong> long-term precipitation; usecaution in interpreting this indicator immediately following an unusuallyheavy rainfall event. See Chapter 5 (section on Wetl<strong>and</strong>s that PeriodicallyLack Indicators <strong>of</strong> Wetl<strong>and</strong> Hydrology) to determine typical dry-seasondates <strong>and</strong> for procedures to evaluate normal rainfall.Indicator C5: Salt depositsCategory: SecondaryGeneral Description: Salt deposits are whitish or brownish deposits <strong>of</strong>salts that accumulate on <strong>the</strong> ground surface through <strong>the</strong> evaporation <strong>of</strong>saline surface water or <strong>the</strong> capillary action <strong>of</strong> saline groundwater.Cautions <strong>and</strong> User Notes: Salt deposits are <strong>of</strong>ten seen on coastal flats<strong>and</strong> in depressions where saline surface water has evaporated or capillaryrise has brought salts to <strong>the</strong> surface from a shallow water table (Figures 53<strong>and</strong> 54). Use caution in disturbed areas where salt water or brine may havebeen deposited on <strong>the</strong> surface through human activities.Figure 53. Salt deposits (light-colored areas) on coastal flats near Wai‘anae, O‘ahu.
ERDC/EL TR-12-5 86Figure 54. Salt deposit at Kanahā Ponds, Maui.Group D – Evidence from O<strong>the</strong>r Site Conditions or DataIndicator D1: Stunted or stressed plantsCategory: SecondaryGeneral Description: This indicator is present if individuals <strong>of</strong> <strong>the</strong>same species growing in <strong>the</strong> potential wetl<strong>and</strong> are clearly <strong>of</strong> smallerstature, less vigorous, or stressed compared with individuals growing innearby non-wetl<strong>and</strong> situations.Cautions <strong>and</strong> User Notes: Some plant species can become established<strong>and</strong> grow in both wetl<strong>and</strong>s <strong>and</strong> non-wetl<strong>and</strong>s but may exhibit obviousstunting, yellowing, or stress in wet situations. This indicator is applicableto natural plant communities as well as agricultural crops <strong>and</strong> o<strong>the</strong>r introducedor planted vegetation. For this indicator to be present, a majority <strong>of</strong>individuals in <strong>the</strong> st<strong>and</strong> must be stunted or stressed. The comparison withindividuals in non-wetl<strong>and</strong> situations may be accomplished over a broadarea <strong>and</strong> is not limited to <strong>the</strong> project site. Use caution in areas wherestunting <strong>of</strong> plants on non-wetl<strong>and</strong> sites may be caused by low soil fertility,excessively drained soils, shallow bedrock, persistent high winds, unevenapplication <strong>of</strong> agricultural chemicals, salinity, or o<strong>the</strong>r factors. Thisindicator is <strong>of</strong>ten seen in wet ‘ōhi‘a forests <strong>and</strong> montane bogs (Figure 55),<strong>and</strong> in agricultural crops <strong>and</strong> o<strong>the</strong>r introduced or planted species.
ERDC/EL TR-12-5 87Figure 55. Stunted ‘ōhi‘a in Lehua Bog, Kaua‘i.Indicator D2: Geomorphic positionCategory: SecondaryGeneral Description: This indicator is present if <strong>the</strong> area in question islocated on a tidal flat, in a localized depression, in <strong>the</strong> low area behind abeach berm (Figure 56), within a floodplain or drainageway, at <strong>the</strong> toe <strong>of</strong> aslope, on <strong>the</strong> low-elevation fringe <strong>of</strong> a pond or o<strong>the</strong>r water body, or in anarea where groundwater discharges.Cautions <strong>and</strong> User Notes: Excess water from precipitation naturallyaccumulates in certain geomorphic positions in <strong>the</strong> l<strong>and</strong>scape, particularlyin low-lying areas such as depressions, drainages, toe slopes, <strong>and</strong> fringes <strong>of</strong>estuaries, oceans, lakes, <strong>and</strong> o<strong>the</strong>r water bodies. In regions with abundantrainfall, <strong>the</strong>se geomorphic positions <strong>of</strong>ten, but not always, exhibit wetl<strong>and</strong>hydrology. This indicator does not include concave positions on rapidlypermeable soils (e.g., floodplains with s<strong>and</strong> <strong>and</strong> gravel substrates, coastals<strong>and</strong> dunes) unless <strong>the</strong> water table is periodically near <strong>the</strong> surface.
ERDC/EL TR-12-5 88Figure 56. Low areas behind coastal beach berms <strong>of</strong>ten exhibitwetl<strong>and</strong> hydrology.Indicator D3: Shallow aquitardCategory: SecondaryGeneral Description: This indicator occurs in <strong>and</strong> around <strong>the</strong> margins<strong>of</strong> depressions, in flat l<strong>and</strong>scapes, <strong>and</strong> on mountain slopes with ironstoneor cemented ash layers, <strong>and</strong> consists <strong>of</strong> <strong>the</strong> presence <strong>of</strong> an aquitard within<strong>the</strong> soil pr<strong>of</strong>ile that is potentially capable <strong>of</strong> perching water within 12 in.(30 cm) <strong>of</strong> <strong>the</strong> surface.Cautions <strong>and</strong> User Notes: An aquitard is a relatively impermeable soillayer or bedrock that slows <strong>the</strong> downward infiltration <strong>of</strong> water <strong>and</strong> canproduce a perched water table, generally in flat or depressional l<strong>and</strong>formsbut occasionally on slopes. In some cases, <strong>the</strong> aquitard may be at <strong>the</strong> surface(e.g., in clay soils) <strong>and</strong> cause water to pond on <strong>the</strong> surface. Potentialaquitards in <strong>the</strong> region include shallow bedrock, cemented layers (e.g.,beach rock, iron stone), spodic horizons, clay layers, <strong>and</strong> saprolite (i.e.,wea<strong>the</strong>red bedrock) (Figure 57). An aquitard can <strong>of</strong>ten be identified by <strong>the</strong>limited root penetration through <strong>the</strong> layer <strong>and</strong>/or <strong>the</strong> presence <strong>of</strong> redoximorphicfeatures in <strong>the</strong> layer(s) above <strong>the</strong> aquitard. Use caution in areaswith functioning drainage systems that are capable <strong>of</strong> removing perchedwater quickly.
ERDC/EL TR-12-5 89Figure 57. Contact between surface soil <strong>and</strong> underlying saprolite for a soil onGuam. Saprolite can be a physical barrier to roots <strong>and</strong> <strong>of</strong>ten acts as anaquitard, perching water above it.Indicator D5: FAC-neutral testCategory: SecondaryGeneral Description: The plant community passes <strong>the</strong> FAC-neutraltest.Cautions <strong>and</strong> User Notes: The FAC-neutral test is performed by compilinga list <strong>of</strong> dominant plant species across all strata in <strong>the</strong> community,<strong>and</strong> dropping from <strong>the</strong> list any species with a Facultative (FAC+, FAC, orFAC–) indicator status. The FAC-neutral test is met if more than 50percent <strong>of</strong> <strong>the</strong> remaining dominant species are rated FACW <strong>and</strong>/or OBL(Figure 58). This indicator may also be used in communities that containno FAC dominants. If <strong>the</strong>re are an equal number <strong>of</strong> dominants that areOBL <strong>and</strong> FACW versus FACU <strong>and</strong> UPL, or if all dominants are FAC, nondominantspecies should be considered.
ERDC/EL TR-12-5 90Step 1: Use <strong>the</strong> 50/20 rule to select dominant species from each stratum <strong>of</strong> <strong>the</strong>community.Step 2: Combine dominant species from all strata into a single list. Determine <strong>the</strong>wetl<strong>and</strong> indicator status for each dominant species (Reed [1988] or current list).For example:Dominant Species Stratum Indicator StatusCheirodendron trigynum Tree FACMetrosideros polymorpha Tree FACCibotium chamissoi Sapling/shrub FACMetrosideros polymorpha Sapling/shrub FACCarex alligata Herb FACWCyperus haspan Herb FACWFreycinetia arborea Woody vine FACUStep 3: Drop <strong>the</strong> FAC species <strong>and</strong> sort <strong>the</strong> remaining species into two groups:FACW <strong>and</strong> OBL species, <strong>and</strong> FACU <strong>and</strong> UPL species:FACW <strong>and</strong> OBL SpeciesCarex alligataCyperus haspanFACU <strong>and</strong> UPL SpeciesFreycinetia arboreaStep 4: Count <strong>the</strong> number <strong>of</strong> species in each group. If <strong>the</strong> number <strong>of</strong> dominantspecies that are FACW <strong>and</strong> OBL is greater than <strong>the</strong> number <strong>of</strong> dominant speciesthat are FACU <strong>and</strong> UPL, <strong>the</strong>n <strong>the</strong> site passes <strong>the</strong> FAC-neutral test. In <strong>the</strong> example,two species are FACW <strong>and</strong>/or OBL, <strong>and</strong> only one species is FACU or UPL.Therefore, <strong>the</strong> site passes <strong>the</strong> FAC-neutral test.Figure 58. Procedure <strong>and</strong> example <strong>of</strong> <strong>the</strong> FAC-neutral test. This example uses <strong>the</strong> samevegetation data as in Table 3.
ERDC/EL TR-12-5 915 Difficult Wetl<strong>and</strong> Situations in <strong>the</strong> Hawai‘i<strong>and</strong> <strong>Pacific</strong> Isl<strong>and</strong>s RegionIntroductionSome wetl<strong>and</strong>s can be difficult to identify because wetl<strong>and</strong> indicators maybe missing due to natural processes or recent disturbances. This chapterprovides guidance for making wetl<strong>and</strong> determinations in difficult-toidentifywetl<strong>and</strong> situations in <strong>the</strong> Hawai‘i <strong>and</strong> <strong>Pacific</strong> Isl<strong>and</strong>s Region. Itincludes regional examples <strong>of</strong> problem area wetl<strong>and</strong>s <strong>and</strong> atypical situationsas defined in <strong>the</strong> <strong>Corps</strong> Manual, as well as o<strong>the</strong>r situations that canmake wetl<strong>and</strong> delineation more challenging. Problem area wetl<strong>and</strong>s arenaturally occurring wetl<strong>and</strong> types that lack indicators <strong>of</strong> hydrophyticvegetation, hydric soil, or wetl<strong>and</strong> hydrology periodically due to normalseasonal or annual variability, or permanently due to <strong>the</strong> nature <strong>of</strong> <strong>the</strong>soils or plant species on <strong>the</strong> site. Atypical situations are wetl<strong>and</strong>s in whichvegetation, soil, or hydrology indicators are absent due to recent humanactivities or natural events. In addition, this chapter addresses certainprocedural problems (e.g., wetl<strong>and</strong>/non-wetl<strong>and</strong> mosaics) that can makewetl<strong>and</strong> determinations in <strong>the</strong> region difficult or confusing. The chapter isorganized into <strong>the</strong> following sections:L<strong>and</strong>s Used for AgricultureProblematic Hydrophytic VegetationProblematic Hydric SoilsWetl<strong>and</strong>s that Periodically Lack Indicators <strong>of</strong> Wetl<strong>and</strong> HydrologyWetl<strong>and</strong>/Non-Wetl<strong>and</strong> MosaicsThe list <strong>of</strong> difficult wetl<strong>and</strong> situations presented in this chapter is notintended to be exhaustive <strong>and</strong> o<strong>the</strong>r problematic situations may exist in<strong>the</strong> region. See <strong>the</strong> <strong>Corps</strong> Manual for general guidance. Fur<strong>the</strong>rmore, morethan one wetl<strong>and</strong> factor (i.e., vegetation, soil, <strong>and</strong>/or hydrology) may bedisturbed or problematic on a given site. In general, wetl<strong>and</strong> determinationson difficult or problematic sites must be based on <strong>the</strong> best informationavailable to <strong>the</strong> field inspector, interpreted in light <strong>of</strong> his or herpr<strong>of</strong>essional experience <strong>and</strong> knowledge <strong>of</strong> <strong>the</strong> ecology <strong>of</strong> wetl<strong>and</strong>s in <strong>the</strong>region.
ERDC/EL TR-12-5 92L<strong>and</strong>s used for agricultureAgriculture is an important l<strong>and</strong> use in <strong>the</strong> region <strong>and</strong> can presentchallenges to wetl<strong>and</strong> identification <strong>and</strong> delineation. Wetl<strong>and</strong>s used foragriculture <strong>of</strong>ten lack a natural plant community <strong>and</strong> may be planted incrops, pasture species, or desirable tree species <strong>and</strong> may be altered bymowing, grazing, herbicide use, or o<strong>the</strong>r management practices. Soils maybe disturbed by cultivation, l<strong>and</strong> clearing, grading, ripping, or bedding, atleast in <strong>the</strong> surface layers, <strong>and</strong> hydrology may or may not be manipulated.Some areas that are used for agriculture still retain <strong>the</strong>ir natural wetl<strong>and</strong>hydrology. In o<strong>the</strong>r areas, historic wetl<strong>and</strong>s have been effectively drained<strong>and</strong> no longer meet wetl<strong>and</strong> hydrology st<strong>and</strong>ards. Wetl<strong>and</strong> indicators maystill be present in <strong>the</strong>se areas, making it difficult to distinguish currentwetl<strong>and</strong>s from those that have been effectively drained.Agricultural drainage systems use ditches, subsurface drainage lines or“tiles,” <strong>and</strong> water-control structures to manipulate <strong>the</strong> water table <strong>and</strong>improve conditions for crops or o<strong>the</strong>r desired species. A freely flowingditch or drainage line depresses <strong>the</strong> water table within a certain lateraldistance or zone <strong>of</strong> influence (Figure 59). The effectiveness <strong>of</strong> drainage inFigure 59. Effects <strong>of</strong> ditches (upper) <strong>and</strong> parallel subsurface drainage lines(lower) on <strong>the</strong> water table.
ERDC/EL TR-12-5 93an area depends in part on soil characteristics, <strong>the</strong> timing <strong>and</strong> amount <strong>of</strong>rainfall, <strong>and</strong> <strong>the</strong> depth <strong>and</strong> spacing <strong>of</strong> ditches or drains. Wetl<strong>and</strong> determinationson current <strong>and</strong> former agricultural l<strong>and</strong>s must consider whe<strong>the</strong>ra drainage system is present, how it is designed to function, <strong>and</strong> whe<strong>the</strong>r itis effective in removing wetl<strong>and</strong> hydrology from <strong>the</strong> area.In <strong>the</strong> <strong>Hawaii</strong>an Isl<strong>and</strong>s, agricultural drainage systems in many areas havefallen into disrepair <strong>and</strong> are no longer functioning as designed. Wetl<strong>and</strong>hydrology has returned to some <strong>of</strong> <strong>the</strong>se areas. On <strong>the</strong> coastal plain <strong>of</strong>Kaua‘i, for example, some wetl<strong>and</strong>s have become reestablished afterhaving been drained in <strong>the</strong> past for sugar cane production. A number <strong>of</strong>information sources <strong>and</strong> tools are listed below to help determine whe<strong>the</strong>rwetl<strong>and</strong>s are present on l<strong>and</strong>s where vegetation, soils, hydrology, or acombination <strong>of</strong> <strong>the</strong>se factors have been manipulated. Some <strong>of</strong> <strong>the</strong>seoptions are discussed in more detail later in this chapter under <strong>the</strong>appropriate section headings.1. Vegetation – The goal is to determine <strong>the</strong> plant community that wouldoccupy <strong>the</strong> site under normal circumstances, if <strong>the</strong> vegetation were notcleared or manipulated.a. Examine <strong>the</strong> vegetation on an undisturbed reference area with soils,hydrology, l<strong>and</strong>scape position, <strong>and</strong> o<strong>the</strong>r conditions similar to those on<strong>the</strong> site.b. In recently cleared areas, examine <strong>the</strong> site for piles <strong>of</strong> cleared vegetation<strong>and</strong> for buried vegetation that may be identifiable.c. Examine <strong>the</strong> site for volunteer vegetation that emerges between cultivations,plantings, mowings, or o<strong>the</strong>r treatments.d. If <strong>the</strong> conversion to agriculture was recent <strong>and</strong> <strong>the</strong> hydrology <strong>of</strong> <strong>the</strong> sitewas not manipulated, examine pre-disturbance aerial photography,NWI maps, l<strong>and</strong> cover maps for <strong>the</strong> <strong>Hawaii</strong>an Isl<strong>and</strong>s available at <strong>the</strong>National Oceanic <strong>and</strong> Atmospheric Administration’s Coastal ServicesCenter (http://www.csc.noaa.gov/crs/lca/hawaii.html), botanical surveys, environmentalassessments, <strong>and</strong> o<strong>the</strong>r sources for information concerning <strong>the</strong>previous vegetation on <strong>the</strong> site.e. Cease <strong>the</strong> clearing, cultivation, or manipulation <strong>of</strong> <strong>the</strong> site for at leastone wet season <strong>and</strong> examine <strong>the</strong> plant community that develops.
ERDC/EL TR-12-5 942. Soils – Tilling <strong>of</strong> agricultural l<strong>and</strong> mixes <strong>the</strong> surface layer(s) <strong>of</strong> <strong>the</strong> soil<strong>and</strong> may cause compaction below <strong>the</strong> tilled zone (i.e., a “plow pan”) due to<strong>the</strong> weight <strong>and</strong> repeated passage <strong>of</strong> farm machinery. Never<strong>the</strong>less, ast<strong>and</strong>ard soil pr<strong>of</strong>ile description <strong>and</strong> examination for hydric soil indicatorsare <strong>of</strong>ten sufficient to determine whe<strong>the</strong>r hydric soils are present. In areaswhere soils have been deeply tilled or o<strong>the</strong>rwise disturbed, options <strong>and</strong>information sources for making hydric soil determinations include <strong>the</strong>following:a. Examine NRCS soil survey maps <strong>and</strong> <strong>the</strong> local hydric soils list for <strong>the</strong>likely presence <strong>of</strong> hydric soils on <strong>the</strong> site. Note that soil maps for someportions <strong>of</strong> <strong>the</strong> region were done at a broad scale that may not providesufficient detail to determine whe<strong>the</strong>r hydric soils are likely to bepresent on a site.b. Examine <strong>the</strong> soils on an undisturbed reference area with l<strong>and</strong>scapeposition, parent materials, <strong>and</strong> hydrology similar to those on <strong>the</strong> site.c. Use alpha, alpha-dipyridyl to check for <strong>the</strong> presence <strong>of</strong> reduced ironduring <strong>the</strong> normal wet portion <strong>of</strong> <strong>the</strong> year, or note whe<strong>the</strong>r <strong>the</strong> soilchanges color upon exposure to <strong>the</strong> air.d. Monitor <strong>the</strong> hydrology <strong>of</strong> <strong>the</strong> site in relation to <strong>the</strong> appropriate wetl<strong>and</strong>hydrology or hydric soils technical st<strong>and</strong>ard.3. Hydrology – The goal is to determine whe<strong>the</strong>r wetl<strong>and</strong> hydrology ispresent on agricultural l<strong>and</strong>s under normal circumstances, as defined in<strong>the</strong> <strong>Corps</strong> Manual <strong>and</strong> subsequent guidance. These sites may or may nothave been hydrologically manipulated.a. Examine <strong>the</strong> site for existing indicators <strong>of</strong> wetl<strong>and</strong> hydrology. If <strong>the</strong>natural hydrology <strong>of</strong> <strong>the</strong> site has been permanently altered, discountany indicators known to have been produced before <strong>the</strong> alteration (e.g.,relict water marks or drift lines).b. Examine five or more years <strong>of</strong> aerial photographs for wetness signatureslisted in Part 513.30 <strong>of</strong> <strong>the</strong> National Food Security Act Manual(USDA Natural Resources Conservation Service 1994). Use <strong>the</strong>procedure given by <strong>the</strong> USDA Natural Resources Conservation Service(1997) to determine whe<strong>the</strong>r wetl<strong>and</strong> hydrology is present.c. Estimate <strong>the</strong> effects <strong>of</strong> ditches <strong>and</strong> subsurface drainage systems usingscope-<strong>and</strong>-effect equations (USDA Natural Resources ConservationService 1997). A web application to analyze data using various modelsis available at http://www.wli.nrcs.usda.gov/technical/web_tool/tools_java.html.
ERDC/EL TR-12-5 95Scope-<strong>and</strong>-effect equations are approximations only <strong>and</strong> may notreflect actual field conditions. Their results should be verified bycomparison with o<strong>the</strong>r techniques for evaluating drainage <strong>and</strong> shouldnot overrule onsite evidence <strong>of</strong> wetl<strong>and</strong> hydrology.d. Use hydrologic models (e.g., run<strong>of</strong>f, surface water, <strong>and</strong> groundwatermodels) to determine whe<strong>the</strong>r wetl<strong>and</strong> hydrology is present (USDANatural Resources Conservation Service 1997).e. Monitor <strong>the</strong> hydrology <strong>of</strong> <strong>the</strong> site in relation to <strong>the</strong> appropriate wetl<strong>and</strong>hydrology technical st<strong>and</strong>ard (U.S. <strong>Army</strong> <strong>Corps</strong> <strong>of</strong> <strong>Engineers</strong> 2005).Problematic hydrophytic vegetationDescription <strong>of</strong> <strong>the</strong> problemMany factors affect <strong>the</strong> structure <strong>and</strong> composition <strong>of</strong> plant communities in<strong>the</strong> Hawai‘i <strong>and</strong> <strong>Pacific</strong> Isl<strong>and</strong>s Region, including climatic variability, tropicalstorms, agricultural use, o<strong>the</strong>r human l<strong>and</strong>-use practices, <strong>and</strong> disturbanceby introduced animals, such as feral pigs (Sus scr<strong>of</strong>a), goats (Caprahircus), <strong>and</strong> sheep (Ovis spp.). As a result, some wetl<strong>and</strong>s may exhibitindicators <strong>of</strong> hydric soil <strong>and</strong> wetl<strong>and</strong> hydrology but lack any <strong>of</strong> <strong>the</strong> hydrophyticvegetation indicators presented in Chapter 2, at least at certaintimes. To identify <strong>and</strong> delineate <strong>the</strong>se wetl<strong>and</strong>s may require special samplingprocedures or additional analysis <strong>of</strong> factors affecting <strong>the</strong> site. To <strong>the</strong>extent possible, <strong>the</strong> hydrophytic vegetation decision should be based on<strong>the</strong> plant community that is normally present during <strong>the</strong> wet season in anormal rainfall year. The following procedure addresses several examples<strong>of</strong> problematic vegetation situations in <strong>the</strong> region.ProcedureProblematic hydrophytic vegetation can be identified using a combination<strong>of</strong> observations made in <strong>the</strong> field <strong>and</strong>/or supplemental information from<strong>the</strong> scientific literature <strong>and</strong> o<strong>the</strong>r sources. These procedures should beapplied only where indicators <strong>of</strong> hydric soil <strong>and</strong> wetl<strong>and</strong> hydrology arepresent, unless one or both <strong>of</strong> <strong>the</strong>se factors is also problematic, but noindicators <strong>of</strong> hydrophytic vegetation are evident. The following proceduresare recommended:1. Verify that at least one indicator <strong>of</strong> hydric soil <strong>and</strong> one primary or twosecondary indicators <strong>of</strong> wetl<strong>and</strong> hydrology are present. If indicators <strong>of</strong>ei<strong>the</strong>r hydric soil or wetl<strong>and</strong> hydrology are absent, <strong>the</strong> area is likely non-
ERDC/EL TR-12-5 96wetl<strong>and</strong> unless soil <strong>and</strong>/or hydrology are also disturbed or problematic. Ifindicators <strong>of</strong> hydric soil <strong>and</strong> wetl<strong>and</strong> hydrology are present (or are absentdue to disturbance or o<strong>the</strong>r problem situations), proceed to step 2.2. Verify that <strong>the</strong> area is in a l<strong>and</strong>scape position that is likely to collect orconcentrate water. Appropriate settings include <strong>the</strong> following. If <strong>the</strong>l<strong>and</strong>scape setting is appropriate, proceed to step 3.a. Concave surface (e.g., depression or swale)b. Floodplainc. Level or nearly level area (e.g., 0- to 3-percent slope)d. Toe slope (Figure 7) or an area <strong>of</strong> convergent slopes (Figure 6)e. Fringe <strong>of</strong> ano<strong>the</strong>r wetl<strong>and</strong> or water bodyf. Area with a restrictive soil layer or aquitard within 24 in. (60 cm) <strong>of</strong> <strong>the</strong>surfaceg. Area where groundwater discharges (e.g., a seep)h. O<strong>the</strong>r (explain in field notes why this area is likely to be inundated orsaturated for long periods)3. Use one or more <strong>of</strong> <strong>the</strong> approaches described in step 4 (Specific ProblematicVegetation Situations below) or step 5 (General Approaches toProblematic Hydrophytic Vegetation on page 100) to determine whe<strong>the</strong>r<strong>the</strong> vegetation is hydrophytic. In <strong>the</strong> remarks section <strong>of</strong> <strong>the</strong> data form or in<strong>the</strong> delineation report, explain <strong>the</strong> rationale for concluding that <strong>the</strong> plantcommunity is hydrophytic even though indicators <strong>of</strong> hydrophytic vegetationdescribed in Chapter 2 were not observed.4. Specific Problematic Vegetation Situationsa. Seasonal shifts in vegetation. As mentioned in Chapter 2, <strong>the</strong> speciescomposition <strong>of</strong> some wetl<strong>and</strong> plant communities in <strong>the</strong> region canchange from <strong>the</strong> wet season to <strong>the</strong> dry season. Wetl<strong>and</strong> types in <strong>the</strong>region that are influenced by <strong>the</strong>se shifts include ephemeral pools,o<strong>the</strong>r depressional wetl<strong>and</strong>s, salt pans, seeps, <strong>and</strong> springs. During <strong>the</strong>dry season, when surface water dries up <strong>and</strong> water tables drop, <strong>the</strong>sewetl<strong>and</strong>s may be invaded <strong>and</strong> dominated by FACU <strong>and</strong> UPL grasses orannual plant species, such as rough cocklebur (Xanthium strumarium)or golden crownbeard (Verbesina encelioides). Also, marshes that aredominated by Chinese water chestnut (Eleocharis dulcis) or spikerush(E. ochrostachys) can lose above-ground vegetative parts during <strong>the</strong>
ERDC/EL TR-12-5 97dry season <strong>and</strong> <strong>the</strong> marsh can appear barren or devoid <strong>of</strong> vegetation.Therefore, <strong>the</strong> lack <strong>of</strong> hydrophytic vegetation during <strong>the</strong> dry seasonshould not immediately eliminate a site from consideration as awetl<strong>and</strong>, because <strong>the</strong> site may have been dominated by wetl<strong>and</strong> speciesat o<strong>the</strong>r times <strong>of</strong> year. A site qualifies for fur<strong>the</strong>r consideration if <strong>the</strong>plant community at <strong>the</strong> time <strong>of</strong> sampling does not exhibit hydrophyticvegetation indicators, but indicators <strong>of</strong> hydric soil <strong>and</strong> wetl<strong>and</strong>hydrology are present or known to be disturbed or problematic. Thefollowing options are recommended in <strong>the</strong>se situations:(1) If possible, return to <strong>the</strong> site during <strong>the</strong> normal wet season <strong>and</strong> reexamine<strong>the</strong> site for indicators <strong>of</strong> hydrophytic vegetation.(2) Examine <strong>the</strong> site for identifiable plant remains, ei<strong>the</strong>r alive or dead,or o<strong>the</strong>r evidence that <strong>the</strong> plant community that was present during<strong>the</strong> normal wet season was hydrophytic.b. Managed plant communities. Plant communities throughout <strong>the</strong>region have been altered <strong>and</strong> are managed to meet human goals.Examples include clearing <strong>of</strong> woody vegetation in pastures <strong>and</strong> cropl<strong>and</strong>s,periodic disking or plowing, planting <strong>of</strong> native <strong>and</strong> non-nativespecies (including cultivars or planted species that have escaped <strong>and</strong>become established on o<strong>the</strong>r sites), applying silvicultural treatments,<strong>and</strong> using herbicides. These actions can result in elimination <strong>of</strong> certainspecies <strong>and</strong> <strong>the</strong>ir replacement by o<strong>the</strong>r species, changes in abundance<strong>of</strong> certain plants, <strong>and</strong> shifts in dominant species, possibly influencing ahydrophytic vegetation determination. The following approaches arerecommended if <strong>the</strong> natural vegetation has been altered throughmanagement to such an extent that a hydrophytic vegetation determinationis not possible or would be unreliable:(1) Examine <strong>the</strong> vegetation on a nearby, unmanaged reference sitehaving similar soils <strong>and</strong> hydrologic conditions. Assume that <strong>the</strong>same plant community would exist on <strong>the</strong> managed site in <strong>the</strong>absence <strong>of</strong> human alteration.(2) To determine whe<strong>the</strong>r managed plant communities would supporthydrophytic vegetation, omit planted species when evaluatinghydrophytic vegetation indicators.
ERDC/EL TR-12-5 98(3) For recently cleared or tilled areas (not planted or seeded), leaverepresentative areas unmanaged for at least one year with normalrainfall <strong>and</strong> reevaluate <strong>the</strong> vegetation.(4) Use <strong>of</strong>fsite data sources such as aerial photography, NWI maps,<strong>and</strong> interviews with <strong>the</strong> l<strong>and</strong> owner <strong>and</strong> o<strong>the</strong>r persons familiar with<strong>the</strong> site or area to determine what plant community was present on<strong>the</strong> site before <strong>the</strong> management occurred.(5) If <strong>the</strong> unmanaged vegetation condition cannot be determined,make <strong>the</strong> wetl<strong>and</strong> determination based on indicators <strong>of</strong> hydric soil<strong>and</strong> wetl<strong>and</strong> hydrology.5. General Approaches to Problematic Hydrophytic Vegetation. The followinggeneral procedures are provided to identify hydrophytic vegetation indifficult situations not necessarily associated with specific vegetation typesor management practices, including wetl<strong>and</strong>s dominated by FACU, NI,NO, or unlisted species that are functioning as hydrophytes. Examples <strong>of</strong>FACU or unlisted species that sometimes dominate wetl<strong>and</strong>s in <strong>the</strong> regioninclude, but are not limited to, wedelia (Sphagneticola trilobata = Wedeliatrilobata), albizia (Albizia lebbeck), <strong>and</strong> white leadtree (Leucaenaleucocephala). The following recommended procedures should be appliedonly where indicators <strong>of</strong> hydric soil <strong>and</strong> wetl<strong>and</strong> hydrology are present (orare absent due to disturbance or o<strong>the</strong>r problem situations) but indicators<strong>of</strong> hydrophytic vegetation are not evident.a. Wetl<strong>and</strong>s dominated by certain FACU trees. Certain FACU treespecies are known to dominate wetl<strong>and</strong>s in <strong>the</strong> region, particularly ondisturbed sites, <strong>and</strong> may cause <strong>the</strong> plant community to fail to meet any<strong>of</strong> <strong>the</strong> hydrophytic vegetation indicators described in Chapter 2. Theselong-lived plant species <strong>of</strong>ten become established during <strong>the</strong> dryseason or in drier-than-normal years <strong>and</strong>, once established, are able topersist indefinitely despite seasonal soil saturation. Coconut palm(Cocos nucifera) <strong>and</strong> <strong>the</strong> introduced kiawe (Prosopis pallida) <strong>and</strong> ironwood(Casuarina equisetifolia) are <strong>the</strong> species most likely to causeproblems with wetl<strong>and</strong> identification in <strong>the</strong> region. If <strong>the</strong> potentialwetl<strong>and</strong> area appears to lack hydrophytic vegetation due to <strong>the</strong>presence <strong>of</strong> one or more <strong>of</strong> <strong>the</strong>se FACU species, use <strong>the</strong> followingprocedure to make <strong>the</strong> hydrophytic vegetation determination:
ERDC/EL TR-12-5 99(1) At each sampling point in <strong>the</strong> potential wetl<strong>and</strong>, drop any FACUspecies listed in item 5a above from <strong>the</strong> vegetation data, <strong>and</strong> compile<strong>the</strong> species list <strong>and</strong> coverage data for <strong>the</strong> remaining species in<strong>the</strong> community.(2) Reevaluate <strong>the</strong> remaining vegetation using hydrophytic vegetationindicators 2 (Dominance Test) <strong>and</strong>/or 3 (Prevalence Index). Ifei<strong>the</strong>r indicator is met, <strong>the</strong>n <strong>the</strong> vegetation is hydrophytic.b. Direct hydrologic observations. Verify that <strong>the</strong> plant communityoccurs in an area subject to prolonged inundation or soil saturation.This can be done by visiting <strong>the</strong> site at 2- to 3-day intervals during <strong>the</strong>portion <strong>of</strong> <strong>the</strong> year when surface water is most likely to be present orwater tables are normally high. Hydrophytic vegetation is consideredto be present, <strong>and</strong> <strong>the</strong> site is a wetl<strong>and</strong>, if surface water is present<strong>and</strong>/or <strong>the</strong> water table is 12 in. (30 cm) or less from <strong>the</strong> surface for14 or more consecutive days during a period when antecedent precipitationhas been normal or drier than normal. If necessary, microtopographichighs <strong>and</strong> lows should be evaluated separately. The normality<strong>of</strong> <strong>the</strong> current year’s rainfall must be considered in interpreting fieldresults, as well as <strong>the</strong> likelihood that wet conditions will occur on <strong>the</strong>site at least every o<strong>the</strong>r year (for more information, see <strong>the</strong> section on“Wetl<strong>and</strong>s that Periodically Lack Indicators <strong>of</strong> Wetl<strong>and</strong> Hydrology” inthis chapter).c. Reference sites with known hydrology. If indicators <strong>of</strong> hydric soil <strong>and</strong>wetl<strong>and</strong> hydrology are present, <strong>the</strong> site may be considered to be awetl<strong>and</strong> if <strong>the</strong> l<strong>and</strong>scape setting, topography, soils, <strong>and</strong> vegetation aresubstantially <strong>the</strong> same as those on nearby wetl<strong>and</strong> reference areaswhose hydrology is known. Hydrologic characteristics <strong>of</strong> wetl<strong>and</strong>reference areas should be documented through long-term monitoringor by application <strong>of</strong> <strong>the</strong> procedure described in item 5b above.Reference sites should be minimally disturbed <strong>and</strong> provide long-termaccess. Soils, vegetation, <strong>and</strong> hydrologic conditions should bethoroughly documented <strong>and</strong> <strong>the</strong> data kept on file in <strong>the</strong> district or field<strong>of</strong>fice.d. Technical literature. Published <strong>and</strong> unpublished scientific literaturemay be used to support a decision to treat specific FACU species orspecies with no assigned indicator status (e.g., NI, NO, or unlisted) as
ERDC/EL TR-12-5 100hydrophytes or certain plant communities as hydrophytic. Preferably,this literature should discuss <strong>the</strong> species’ natural distribution along <strong>the</strong>moisture gradient, its capabilities <strong>and</strong> adaptations for life in wetl<strong>and</strong>s,wetl<strong>and</strong> types in which it is typically found, or o<strong>the</strong>r wetl<strong>and</strong> specieswith which it is commonly associated.Problematic hydric soilsDescription <strong>of</strong> <strong>the</strong> problemSoils with faint or no indicatorsSome soils that meet <strong>the</strong> hydric soil definition may not exhibit any <strong>of</strong> <strong>the</strong>indicators presented in Chapter 3. These problematic hydric soils exist fora number <strong>of</strong> reasons <strong>and</strong> require additional information, such as l<strong>and</strong>scapeposition, presence or absence <strong>of</strong> restrictive soil layers, or informationabout hydrology, to identify properly. This section describes severalsoil situations in <strong>the</strong> Hawai‘i <strong>and</strong> <strong>Pacific</strong> Isl<strong>and</strong>s Region that are consideredto be hydric if additional requirements are met. In some cases,<strong>the</strong>se hydric soils may appear to be non-hydric due to <strong>the</strong> color <strong>of</strong> <strong>the</strong>parent material from which <strong>the</strong> soils developed. In o<strong>the</strong>rs, <strong>the</strong> lack <strong>of</strong>hydric soil indicators is due to conditions that inhibit <strong>the</strong> development <strong>of</strong>redoximorphic features despite prolonged soil saturation <strong>and</strong> anoxia. Inaddition, recently developed wetl<strong>and</strong>s may lack hydric soil indicatorsbecause insufficient time has passed for <strong>the</strong>ir development. Examples <strong>of</strong>problematic hydric soils in <strong>the</strong> region include, but are not limited to, <strong>the</strong>following.1. Moderately to Very Strongly Alkaline Soils. The formation <strong>of</strong> redoxconcentrations <strong>and</strong> depletions requires that soluble iron, manganese, <strong>and</strong>organic matter be present in <strong>the</strong> soil. In a neutral to acidic soil, iron <strong>and</strong>manganese readily enter into solution as reduction occurs <strong>and</strong> <strong>the</strong>n precipitatein <strong>the</strong> form <strong>of</strong> redox concentrations as <strong>the</strong> soil becomes oxidized.Identifiable iron or manganese features do not form readily in saturatedsoils with high pH. High pH (7.9 or higher) can be caused by many factors.In <strong>the</strong> Hawai‘i <strong>and</strong> <strong>Pacific</strong> Isl<strong>and</strong>s Region, salt content is a common cause<strong>of</strong> high soil pH. Carbonate s<strong>and</strong>s, which are common in <strong>the</strong> region, alsohave high pH. If <strong>the</strong> pH is high, indicators <strong>of</strong> hydrophytic vegetation <strong>and</strong>wetl<strong>and</strong> hydrology are present, <strong>and</strong> l<strong>and</strong>scape position is consistent withwetl<strong>and</strong>s in <strong>the</strong> area, <strong>the</strong>n <strong>the</strong> soil may be hydric even in <strong>the</strong> absence <strong>of</strong> arecognized hydric soil indicator. In <strong>the</strong> absence <strong>of</strong> an approved indicator,
ERDC/EL TR-12-5 101thoroughly document soil conditions, including pH, in addition to <strong>the</strong>rationale for identifying <strong>the</strong> soil as hydric (e.g., l<strong>and</strong>scape position, vegetation,evidence <strong>of</strong> hydrology, etc.). The concept <strong>of</strong> high pH includes <strong>the</strong>USDA terms Moderately Alkaline, Strongly Alkaline, <strong>and</strong> Very StronglyAlkaline (USDA Natural Resources Conservation Service 2002).2. Fluvial Sediments within Floodplains. These soils commonly occuron vegetated bars within <strong>the</strong> active channel <strong>of</strong> rivers <strong>and</strong> streams, <strong>and</strong><strong>of</strong>ten occur above <strong>the</strong> bankfull stage. In some cases, <strong>the</strong>se soils lack hydricsoil indicators due to yearly or seasonal deposition <strong>of</strong> new soil material,low iron or manganese content, <strong>and</strong>/or low organic-matter content. Redoxconcentrations can sometimes be found on <strong>the</strong> bottoms <strong>of</strong> coarse fragmentsor between stratifications where organic matter gets buried <strong>and</strong>should be examined closely to see if <strong>the</strong>y satisfy an indicator.3. Recently Developed Wetl<strong>and</strong>s. Recently developed wetl<strong>and</strong>s includemitigation sites, wetl<strong>and</strong> management areas (e.g., for waterfowl), o<strong>the</strong>rwetl<strong>and</strong>s intentionally or unintentionally produced by human activities,<strong>and</strong> naturally occurring wetl<strong>and</strong>s that have not been in place long enoughto develop hydric soil indicators.4. Seasonally Ponded Soils. Seasonally ponded, depressional wetl<strong>and</strong>soccur throughout <strong>the</strong> Hawai‘i <strong>and</strong> <strong>Pacific</strong> Isl<strong>and</strong>s Region. Most areperched systems, with water ponding above a restrictive soil layer, such asa hardpan, bedrock, or clay layer that is at or near <strong>the</strong> surface. Some <strong>of</strong><strong>the</strong>se wetl<strong>and</strong>s lack hydric soil indicators due to <strong>the</strong> limited saturationdepth, saline conditions, or o<strong>the</strong>r factors.5. Dark-Colored Mineral Soils Due to Organic Matter Accumulation.As little as 1.5 percent organic matter can color a soil black. Thestrong coloring properties <strong>of</strong> organic matter can mask redoximorphicfeatures in hydric soils. It is important to examine dark soils closely forsmall redox features (e.g., see indicator F6 – Redox Dark Surface), letsaturated soils dry to a moist condition before describing <strong>the</strong> soil, <strong>and</strong> lookbelow <strong>the</strong> dark surface layer(s) for a depleted or gleyed matrix (seeindicators A11 – Depleted Below Dark Surface <strong>and</strong> A12 – Thick DarkSurface). Assistance from a soil scientist with local experience may benecessary when working with dark-colored soils.
ERDC/EL TR-12-5 1026. Red Soils. Red soils occur in <strong>the</strong> region <strong>and</strong> can be difficult to interpret.These soils formed under conditions <strong>of</strong> long-term wea<strong>the</strong>ring <strong>and</strong>oxidation, <strong>and</strong> are primarily found on older isl<strong>and</strong>s (e.g., Kaua‘i, O‘ahu,Moloka‘i, Lāna‘i, <strong>and</strong> Maui in <strong>the</strong> <strong>Hawaii</strong>an chain). Some red hydric soilswill exhibit hydric soil indicators <strong>and</strong> o<strong>the</strong>rs will not. Caution must betaken in evaluating soil indicators in <strong>the</strong>se areas, due to <strong>the</strong> potential forred soils to enhance or mask certain redox features. Indicator F21 (RedParent Material) is applicable in problem situations in areas containing redsoils. Indicator F8 (Redox Depressions) may also be useful in areas thatare subject to ponding, such as riparian depressions containing red soils.Nodules <strong>and</strong> concretions can be relict soil features <strong>and</strong> do not count asredox concentrations when applying hydric soil indicators.7. Carbonate S<strong>and</strong>s. The formation <strong>of</strong> redox features requires microbialactivity <strong>and</strong> <strong>the</strong> presence <strong>of</strong> iron, manganese, <strong>and</strong> organic matter. Carbonates<strong>and</strong>s are common in <strong>the</strong> region <strong>and</strong> are derived from wea<strong>the</strong>redshells, coral rubble, foraminifera, <strong>and</strong> coralline algae. Therefore, <strong>the</strong>y maylack <strong>the</strong> components required for <strong>the</strong> development <strong>of</strong> redox features. Thismakes carbonate s<strong>and</strong>s difficult to interpret. Care should be taken toexamine <strong>the</strong> soil closely, as redox concentrations <strong>and</strong> depletions can bevery small <strong>and</strong> have diffuse boundaries. Look for redox features along anyvisible roots or organic-matter sources. Organic-matter accumulations canbe used to identify some hydric soils in carbonate s<strong>and</strong>s; consider indicatorsS7 (Dark Surface) <strong>and</strong> S1 (S<strong>and</strong>y Mucky Mineral).8. Very Shallow Mineral Soils. In areas where bedrock is close to <strong>the</strong>surface, hydric mineral soils may meet <strong>the</strong> color requirements but not <strong>the</strong>thickness requirements <strong>of</strong> one or more hydric soil indicators. Someshallow hydric soils in depressions in pāhoehoe lava flows may meet allrequirements for indicator TF12 (Very Shallow Dark Surface).Soils with relict or induced hydric soil indicatorsSome soils in <strong>the</strong> Hawai‘i <strong>and</strong> <strong>Pacific</strong> Isl<strong>and</strong>s Region exhibit redoximorphicfeatures <strong>and</strong> hydric soil indicators that formed in <strong>the</strong> recent or distantpast when conditions may have been wetter than <strong>the</strong>y are today. Thesefeatures have persisted even though wetl<strong>and</strong> hydrology may no longer bepresent. For example, wetl<strong>and</strong>s drained long ago for agricultural purposesmay contain persistent hydric soil features. Wetl<strong>and</strong> soils drained duringhistoric times are still considered to be hydric but <strong>the</strong>y may no longer supportwetl<strong>and</strong>s. Relict hydric soil features may be difficult to distinguish
ERDC/EL TR-12-5 103from contemporary features. However, if indicators <strong>of</strong> hydrophytic vegetation<strong>and</strong> wetl<strong>and</strong> hydrology are present, <strong>the</strong>n hydric soil indicators canbe assumed to be contemporary.Relict redoximorphic features are no longer active due to geologic or o<strong>the</strong>rchanges that have permanently altered <strong>the</strong> hydrologic regime. Only onclose examination is it evident that hydric soil morphologies are notpresent. Several morphological characteristics that can help distinguishbetween contemporary <strong>and</strong> relict redoximorphic features (Vepraskas1992) are described below.1. Contemporary hydric soils may have nodules or concretions with diffuseboundaries or irregular surfaces. If surfaces are smooth <strong>and</strong> round, <strong>the</strong>nred to yellow coronas should be present. Relict hydric soils may havenodules or concretions with abrupt boundaries <strong>and</strong> smooth surfaceswithout accompanying coronas.2. Contemporary hydric soils may have Fe depletions along stable macroporesin which roots repeatedly grow that are not overlain by iron-richcoatings (redox concentrations). Relict hydric soils may have Fe depletionsalong stable macropores in which roots repeatedly grow that are overlainby iron-rich coatings.3. Contemporary hydric soils may have iron-enriched redox concentrationswith Munsell colors <strong>of</strong> 5YR or yellower <strong>and</strong> with a value <strong>and</strong> chroma <strong>of</strong> 4or more. Relict hydric soils may have iron-enriched redox concentrationswith colors redder than 5YR <strong>and</strong> a value <strong>and</strong> chroma less than 4.4. Contemporary pore linings may be continuous while relict pore liningsmay be broken or discontinuous (Hurt <strong>and</strong> Galbraith 2005).There are also areas where hydric soil features have developed in formerupl<strong>and</strong>s due to human activities, such as <strong>the</strong> diversion <strong>of</strong> water for irrigationor o<strong>the</strong>r uses. The application <strong>of</strong> irrigation water to upl<strong>and</strong> areas cancreate wetl<strong>and</strong> hydrology <strong>and</strong>, given adequate time, induce <strong>the</strong> formation<strong>of</strong> hydric soil indicators. In some cases, a soil scientist can distinguishnaturally occurring hydric soil features from those induced by irrigation.Characterizing <strong>the</strong> naturally occurring hydrology is <strong>of</strong>ten important to <strong>the</strong>determination, <strong>and</strong> <strong>the</strong> timing <strong>of</strong> field observations can be critical. Observationsmade during <strong>the</strong> normal wet season, when natural hydrology is
ERDC/EL TR-12-5 104<strong>of</strong>ten at its peak <strong>and</strong> irrigation has not yet begun, may help to differentiatenaturally occurring <strong>and</strong> irrigation-induced hydric soil features.ProcedureSoils that are thought to meet <strong>the</strong> definition <strong>of</strong> a hydric soil but do notexhibit any <strong>of</strong> <strong>the</strong> indicators described in Chapter 3 can be identified by<strong>the</strong> following recommended procedure. This procedure should be usedonly where indicators <strong>of</strong> hydrophytic vegetation <strong>and</strong> wetl<strong>and</strong> hydrologyare present (or are absent due to disturbance or o<strong>the</strong>r problem situations),but indicators <strong>of</strong> hydric soil are not evident.1. Verify that one or more indicators <strong>of</strong> hydrophytic vegetation are present,or that vegetation is problematic or has been altered (e.g., by tillage oro<strong>the</strong>r l<strong>and</strong> alteration). If so, proceed to step 2.2. Verify that at least one primary or two secondary indicators <strong>of</strong> wetl<strong>and</strong>hydrology are present or that indicators are absent due to disturbance oro<strong>the</strong>r factors. If so, proceed to step 3. If indicators <strong>of</strong> hydrophytic vegetation<strong>and</strong>/or wetl<strong>and</strong> hydrology are absent, <strong>the</strong>n <strong>the</strong> area is probably nonwetl<strong>and</strong><strong>and</strong> no fur<strong>the</strong>r analysis is required.3. Thoroughly describe <strong>and</strong> document <strong>the</strong> soil pr<strong>of</strong>ile <strong>and</strong> l<strong>and</strong>scape setting.Verify that <strong>the</strong> area is in a l<strong>and</strong>scape position that is likely to collect orconcentrate water. Appropriate settings are listed below. If <strong>the</strong> l<strong>and</strong>scapesetting is appropriate, proceed to step 4.a. Concave surface (e.g., depression or swale)b. Floodplainc. Level or nearly level area (e.g., 0- to 3-percent slope)d. Toe slope (Figure 7) or an area <strong>of</strong> convergent slopes (Figure 6)e. Fringe <strong>of</strong> ano<strong>the</strong>r wetl<strong>and</strong> or water bodyf. Area with a restrictive soil layer or aquitard within 24 in. (60 cm) <strong>of</strong> <strong>the</strong>surfaceg. Area where groundwater discharges (e.g., a seep)h. O<strong>the</strong>r (explain in field notes why this area is likely to be inundated orsaturated for long periods)4. Use one or more <strong>of</strong> <strong>the</strong> following approaches to determine whe<strong>the</strong>r <strong>the</strong> soilis hydric. In <strong>the</strong> remarks section <strong>of</strong> <strong>the</strong> data form or in <strong>the</strong> delineationreport, explain why it is believed that <strong>the</strong> soil lacks any <strong>of</strong> <strong>the</strong> NTCHS
ERDC/EL TR-12-5 105hydric soil indicators described in Chapter 3 <strong>and</strong> why it is believed that <strong>the</strong>soil meets <strong>the</strong> definition <strong>of</strong> a hydric soil.a. Determine whe<strong>the</strong>r one or more <strong>of</strong> <strong>the</strong> following indicators <strong>of</strong>problematic hydric soils is present. See <strong>the</strong> descriptions <strong>of</strong> eachindicator given in Chapter 3. If one or more indicators is present, <strong>the</strong>n<strong>the</strong> soil is hydric.(1) Stratified Layers (A5)(2) S<strong>and</strong>y Mucky Mineral (S1)(3) Red Parent Material (F21)(4) Very Shallow Dark Surface (TF12)b. Determine whe<strong>the</strong>r one or more <strong>of</strong> <strong>the</strong> following problematic soilsituations is present. If present, consider <strong>the</strong> soil to be hydric.(1) Moderately to Very Strongly Alkaline Soils(2) Fluvial Sediments within Floodplains(3) Recently Developed Wetl<strong>and</strong>s(4) Seasonally Ponded Soils(5) Dark-Colored Mineral Soils Due to Organic-Matter Accumulation(6) Red Soils(7) Carbonate S<strong>and</strong>s(8) Very Shallow Mineral Soils(9) O<strong>the</strong>r (in field notes, describe <strong>the</strong> problematic soil situation <strong>and</strong>explain why it is believed that <strong>the</strong> soil meets <strong>the</strong> hydric soildefinition)c. Soils that have been saturated for long periods <strong>and</strong> have becomechemically reduced may change color when exposed to air due to <strong>the</strong>rapid oxidation <strong>of</strong> ferrous iron (Fe 2+ ) to Fe 3+ (i.e., a reduced matrix)(Figures 60 <strong>and</strong> 61). If <strong>the</strong> soil contains sufficient iron, this can result inan observable color change, especially in hue or chroma. The soil ishydric if a mineral layer 4 in. (10 cm) or more thick starting within12 in. (30 cm) <strong>of</strong> <strong>the</strong> soil surface that has a matrix value <strong>of</strong> 4 or more<strong>and</strong> chroma <strong>of</strong> 2 or less becomes redder by one or more pages in hue<strong>and</strong>/or increases one or more in chroma when exposed to air within30 minutes (Vepraskas 1992).
ERDC/EL TR-12-5 106ReducedFigure 60. This soil exhibits colors associatedwith reducing conditions. Scale is 1 cm.OxidizedFigure 61. The same soil as in Figure 60 afterexposure to <strong>the</strong> air <strong>and</strong> oxidation has occurred.d. Care must be taken to obtain an accurate color <strong>of</strong> <strong>the</strong> soil sampleimmediately upon excavation. The colors should be observed closely<strong>and</strong> examined again after several minutes. Do not allow <strong>the</strong> sample tobecome dry. Dry soils will usually have a different color than wet ormoist soils. As always, do not attempt to determine colors whilewearing sunglasses or tinted lenses. Colors must be obtained in <strong>the</strong>field under natural light <strong>and</strong> not under artificial light.e. If <strong>the</strong> soil is saturated at <strong>the</strong> time <strong>of</strong> sampling, alpha, alpha-dipyridylcan be used in <strong>the</strong> following procedure to determine if reduced(ferrous) iron is present. If ferrous iron is present as described below,<strong>the</strong>n <strong>the</strong> soil is hydric.Alpha, alpha-dipyridyl is a reagent that reacts with reduced iron. Insome cases, it can be used to provide evidence that a soil is hydric whenit lacks o<strong>the</strong>r hydric soil indicators. The soil is likely to be hydric ifapplication <strong>of</strong> alpha, alpha-dipyridyl to mineral soil material in at least60 percent <strong>of</strong> a layer at least 4 in. (10 cm) thick within a depth <strong>of</strong> 12 in.
ERDC/EL TR-12-5 107(30 cm) <strong>of</strong> <strong>the</strong> soil surface results in a positive reaction within30 seconds evidenced by a pink or red coloration to <strong>the</strong> reagent during<strong>the</strong> growing season.Using a dropper, apply a small amount <strong>of</strong> reagent to a freshly brokenped face to avoid any chance <strong>of</strong> a false positive test due to iron contaminationfrom digging tools. Look closely at <strong>the</strong> treated soil for evidence<strong>of</strong> color change. If in doubt, apply <strong>the</strong> reagent to a sample <strong>of</strong> knownupl<strong>and</strong> soil <strong>and</strong> compare <strong>the</strong> reaction to <strong>the</strong> sample <strong>of</strong> interest. Apositive reaction will not occur in soils that lack iron <strong>and</strong> may not occurin soils with high pH. The lack <strong>of</strong> a positive reaction to <strong>the</strong> reagent doesnot preclude <strong>the</strong> presence <strong>of</strong> a hydric soil. Specific information about<strong>the</strong> use <strong>of</strong> alpha, alpha-dipyridyl can be found in NRCS Hydric SoilsTechnical Note 8 (http://soils.usda.gov/use/hydric/ntchs/tech_notes/index.html).f. Using gauge data, water-table monitoring data, or repeated directhydrologic observations, determine whe<strong>the</strong>r <strong>the</strong> soil is ponded orflooded, or <strong>the</strong> water table is 12 in. (30 cm) or less from <strong>the</strong> surface, for14 or more consecutive days during <strong>the</strong> growing season in most years(at least 5 years in 10, or 50 percent or higher probability) (U.S. <strong>Army</strong><strong>Corps</strong> <strong>of</strong> <strong>Engineers</strong> 2005). If so, <strong>the</strong>n <strong>the</strong> soil is hydric. Fur<strong>the</strong>rmore,any soil that meets <strong>the</strong> NTCHS hydric soil technical st<strong>and</strong>ard (NRCSHydric Soils Technical Note 11, http://soils.usda.gov/use/hydric/ntchs/tech_notes/index.html) is hydric.Wetl<strong>and</strong>s that periodically lack indicators <strong>of</strong> wetl<strong>and</strong> hydrologyDescription <strong>of</strong> <strong>the</strong> problemWetl<strong>and</strong>s are areas that are flooded or ponded, or have soils that aresaturated with water, for long periods in most years. If <strong>the</strong> site is visitedduring a time <strong>of</strong> normal precipitation amounts <strong>and</strong> it is inundated or <strong>the</strong>water table is near <strong>the</strong> surface, <strong>the</strong>n <strong>the</strong> wetl<strong>and</strong> hydrology determinationis straightforward. During <strong>the</strong> dry season, however, surface water recedesfrom wetl<strong>and</strong> margins, water tables drop, <strong>and</strong> many wetl<strong>and</strong>s dry outcompletely. Fur<strong>the</strong>rmore, not all wetl<strong>and</strong>s become inundated or saturatedevery year. Wetl<strong>and</strong>s in general are inundated or saturated at least 5 yearsin 10 (50 percent or higher probability) over a long-term record. Therefore,some wetl<strong>and</strong>s in <strong>the</strong> region may not become inundated or saturatedin some years.
ERDC/EL TR-12-5 108Wetl<strong>and</strong> hydrology determinations are based on indicators, many <strong>of</strong> whichwere designed to be used during dry periods when <strong>the</strong> direct observation<strong>of</strong> surface water or a shallow water table is not possible. However, somewetl<strong>and</strong>s may lack any <strong>of</strong> <strong>the</strong> listed hydrology indicators, particularlyduring <strong>the</strong> dry season or in a dry year. The evaluation <strong>of</strong> wetl<strong>and</strong> hydrologyrequires special care on any site where indicators <strong>of</strong> hydrophyticvegetation <strong>and</strong> hydric soil are present but hydrology indicators appear tobe absent. Among o<strong>the</strong>r factors, this evaluation should consider <strong>the</strong> timing<strong>of</strong> <strong>the</strong> site visit in relation to normal seasonal <strong>and</strong> annual hydrologic variability,<strong>and</strong> whe<strong>the</strong>r <strong>the</strong> amount <strong>of</strong> rainfall prior to <strong>the</strong> site visit has beennormal. This section describes a number <strong>of</strong> approaches that can be used todetermine whe<strong>the</strong>r wetl<strong>and</strong> hydrology is present on sites where indicators<strong>of</strong> hydrophytic vegetation <strong>and</strong> hydric soil are present but hydrologyindicators may be lacking due to normal variations in rainfall or run<strong>of</strong>f,human activities that destroy hydrology indicators, <strong>and</strong> o<strong>the</strong>r factors.Procedure1. Verify that indicators <strong>of</strong> hydrophytic vegetation <strong>and</strong> hydric soil are present,or are absent due to disturbance or o<strong>the</strong>r problem situations. If so, proceedto step 2.2. Verify that <strong>the</strong> site is in a l<strong>and</strong>scape position that is likely to collect orconcentrate water. Appropriate settings are listed below. If <strong>the</strong> l<strong>and</strong>scapesetting is appropriate, proceed to step 3.a. Concave surface (e.g., depression or swale)b. Floodplainc. Level or nearly level area (e.g., 0- to 3-percent slope)d. Toe slope (Figure 7) or an area <strong>of</strong> convergent slopes (Figure 6)e. Fringe <strong>of</strong> ano<strong>the</strong>r wetl<strong>and</strong> or water bodyf. Area with a restrictive soil layer or aquitard within 24 in. (60 cm) <strong>of</strong> <strong>the</strong>surfaceg. Area where groundwater discharges (e.g., a seep)h. O<strong>the</strong>r (explain in field notes why this area is likely to be inundated orsaturated for long periods)3. Use one or more <strong>of</strong> <strong>the</strong> following approaches to determine whe<strong>the</strong>rwetl<strong>and</strong> hydrology is present <strong>and</strong> <strong>the</strong> site is a wetl<strong>and</strong>. In <strong>the</strong> remarkssection <strong>of</strong> <strong>the</strong> data form or in <strong>the</strong> delineation report, explain <strong>the</strong> rationalefor concluding that wetl<strong>and</strong> hydrology is present even though indicators <strong>of</strong>
ERDC/EL TR-12-5 109wetl<strong>and</strong> hydrology described in Chapter 4 were not observed.a. Site visits during <strong>the</strong> dry season. Determine whe<strong>the</strong>r <strong>the</strong> site visitoccurred during <strong>the</strong> normal annual “dry season.” The dry season, asused in this supplement, is <strong>the</strong> period <strong>of</strong> <strong>the</strong> year when soil moisture isnormally being depleted <strong>and</strong> water tables are falling to low levels inresponse to decreased precipitation <strong>and</strong>/or increased evapotranspiration.Typical dry-season months in <strong>the</strong> region are (USDA NaturalResources Conservation Service 2006):<strong>Hawaii</strong>an Isl<strong>and</strong>s – June through OctoberGuam <strong>and</strong> <strong>the</strong> Nor<strong>the</strong>rn Mariana Isl<strong>and</strong>s – January through MayAmerican Samoa – June through SeptemberIn many wetl<strong>and</strong>s, direct observation <strong>of</strong> flooding, ponding, or a shallowwater table would be unexpected during <strong>the</strong> dry season. Wetl<strong>and</strong>hydrology indicators, if present, would most likely be limited toindirect evidence, such as water marks, drift deposits, or surfacecracks. In some situations, particularly in seasonally saturated wetl<strong>and</strong>systems, hydrology indicators may be absent during <strong>the</strong> dry season. Atsuch times, <strong>the</strong> wetl<strong>and</strong> determination should be based on <strong>the</strong> preponderance<strong>of</strong> evidence that <strong>the</strong> site ei<strong>the</strong>r is or is not wetl<strong>and</strong>. If <strong>the</strong>site visit occurred during <strong>the</strong> dry season on a site that contains hydricsoils <strong>and</strong> hydrophytic vegetation <strong>and</strong> no evidence <strong>of</strong> hydrologicmanipulation (e.g., no dams, levees, water diversions, l<strong>and</strong> grading,etc., <strong>and</strong> <strong>the</strong> site is not within <strong>the</strong> zone <strong>of</strong> influence <strong>of</strong> any ditches orsubsurface drains), <strong>the</strong>n consider <strong>the</strong> site to be a wetl<strong>and</strong>. If necessary,revisit <strong>the</strong> site during <strong>the</strong> normal wet season <strong>and</strong> check again for <strong>the</strong>presence or absence <strong>of</strong> wetl<strong>and</strong> hydrology indicators. If wetl<strong>and</strong>hydrology indicators are absent during <strong>the</strong> wet season in a normal orwetter-than-normal rainfall year, <strong>the</strong> site is probably non-wetl<strong>and</strong>.b. Periods with below-normal rainfall. Determine whe<strong>the</strong>r <strong>the</strong> amount<strong>of</strong> rainfall that occurred in <strong>the</strong> 2 to 3 months preceding <strong>the</strong> site visitwas normal, above normal, or below normal based on <strong>the</strong> normalrange reported in WETS tables. WETS tables are provided by <strong>the</strong>NRCS National Water <strong>and</strong> Climate Center (http://www.wcc.nrcs.usda.gov/climate/wetl<strong>and</strong>s.html) <strong>and</strong> are calculated from long-term (30-year) wea<strong>the</strong>rrecords ga<strong>the</strong>red at National Wea<strong>the</strong>r Service meteorological stations.To determine whe<strong>the</strong>r precipitation was normal prior to <strong>the</strong> site visit,
ERDC/EL TR-12-5 110actual rainfall in <strong>the</strong> current month <strong>and</strong> previous 2 to 3 months shouldbe compared with <strong>the</strong> normal ranges for each month given in <strong>the</strong>WETS table (USDA Natural Resources Conservation Service 1997;Sprecher <strong>and</strong> Warne 2000). The lower <strong>and</strong> upper limits <strong>of</strong> <strong>the</strong> normalrange are indicated by <strong>the</strong> columns labeled “30% chance will have lessthan” <strong>and</strong> “30% chance will have more than” in <strong>the</strong> WETS table. TheUSDA Natural Resources Conservation Service (1997, Section650.1903) also gives a procedure that can be used to weight <strong>the</strong> informationfrom each month <strong>and</strong> determine whe<strong>the</strong>r <strong>the</strong> entire period wasnormal, wet, or dry. Average precipitation can vary considerably overshort distances, particularly on <strong>the</strong> higher isl<strong>and</strong>s with mountainranges <strong>and</strong> peaks. Therefore, use caution in areas where elevation,aspect, rain-shadow effects, or o<strong>the</strong>r conditions differ between <strong>the</strong> site<strong>and</strong> <strong>the</strong> location <strong>of</strong> <strong>the</strong> nearest wea<strong>the</strong>r station. Sometimes a moredistant station is more representative <strong>of</strong> <strong>the</strong> site in question.When precipitation has been below normal, wetl<strong>and</strong>s may not flood,pond, or develop shallow water tables even during <strong>the</strong> typical wetseason <strong>and</strong> may not exhibit o<strong>the</strong>r indicators <strong>of</strong> wetl<strong>and</strong> hydrology.Therefore, if precipitation was below normal prior to <strong>the</strong> site visit, <strong>and</strong><strong>the</strong> site contains hydric soils <strong>and</strong> hydrophytic vegetation <strong>and</strong> no evidence<strong>of</strong> hydrologic manipulation (e.g., no dams, levees, water diversions,l<strong>and</strong> grading, etc., <strong>and</strong> <strong>the</strong> site is not within <strong>the</strong> zone <strong>of</strong> influence<strong>of</strong> any ditches or subsurface drains), it should be identified as a wetl<strong>and</strong>.If necessary, <strong>the</strong> site can be re-visited during a period <strong>of</strong> normalrainfall <strong>and</strong> checked again for hydrology indicators.c. Drought years. Determine whe<strong>the</strong>r <strong>the</strong> area has been subject todrought. Drought periods can be identified by comparing annualrainfall totals with <strong>the</strong> normal range <strong>of</strong> annual rainfall given in WETStables or by examining trends in drought indices. For <strong>the</strong> <strong>Hawaii</strong>anIsl<strong>and</strong>s, <strong>the</strong> U.S. Drought Monitor (http://drought.unl.edu/dm/monitor.html)provides maps <strong>of</strong> drought severity through time based on a multi-indexapproach. In addition, Sprecher <strong>and</strong> Warne (2000) give an overview <strong>of</strong>various methods for evaluating meteorological data as part <strong>of</strong> a wetl<strong>and</strong>determination. If wetl<strong>and</strong> hydrology indicators appear to beabsent on a site that has hydrophytic vegetation <strong>and</strong> hydric soils, nosignificant hydrologic manipulation (e.g., no dams, levees, water diversions,l<strong>and</strong> grading, etc., <strong>and</strong> <strong>the</strong> site is not within <strong>the</strong> zone <strong>of</strong> influence<strong>of</strong> any ditches or subsurface drains), <strong>and</strong> <strong>the</strong> region has been affected
ERDC/EL TR-12-5 111by drought, <strong>the</strong>n <strong>the</strong> area should be identified as a wetl<strong>and</strong>.d. Reference sites. If indicators <strong>of</strong> hydric soil <strong>and</strong> hydrophytic vegetationare present on a site that lacks wetl<strong>and</strong> hydrology indicators, <strong>the</strong> sitemay be considered to be a wetl<strong>and</strong> if <strong>the</strong> l<strong>and</strong>scape setting, topography,soils, <strong>and</strong> vegetation are substantially <strong>the</strong> same as those on nearbywetl<strong>and</strong> reference areas with known hydrology. Hydrology <strong>of</strong> wetl<strong>and</strong>reference areas should be documented through long-term monitoring(see item g below) or by application <strong>of</strong> <strong>the</strong> procedure described in item5b on page 101 (Direct Hydrologic Observations) <strong>of</strong> <strong>the</strong> procedure forProblematic Hydrophytic Vegetation in this chapter. Reference sitesshould be minimally disturbed <strong>and</strong> should provide long-term access.Soils, vegetation, <strong>and</strong> hydrologic conditions should be thoroughlydocumented <strong>and</strong> <strong>the</strong> data kept on file in <strong>the</strong> District or field <strong>of</strong>fice.e. Hydrology tools. The “Hydrology Tools for Wetl<strong>and</strong> Determination”(USDA Natural Resources Conservation Service 1997) is a collection <strong>of</strong>methods that can be used to determine whe<strong>the</strong>r wetl<strong>and</strong> hydrology ispresent on a potential wetl<strong>and</strong> site that lacks indicators due to disturbanceor o<strong>the</strong>r reasons, particularly on l<strong>and</strong>s used for agriculture.Generally <strong>the</strong>y require additional information, such as aerial photographsor stream-gauge data, or involve hydrologic modeling <strong>and</strong>approximation techniques. They should be used only when an indicator-basedwetl<strong>and</strong> hydrology determination is not possible or wouldgive misleading results. A hydrologist may be needed to help select <strong>and</strong>carry out <strong>the</strong> proper analysis. The six hydrology tools that are applicableto <strong>the</strong> Hawai‘i <strong>and</strong> <strong>Pacific</strong> Isl<strong>and</strong>s Region are:(1) Analyze stream <strong>and</strong> lake gauge data(2) Estimate run<strong>of</strong>f volumes to determine duration <strong>and</strong> frequency <strong>of</strong>ponding in depressional areas(3) Evaluate <strong>the</strong> frequency <strong>of</strong> wetness signatures on aerial photography(see item f below for additional information)(4) Model water-table fluctuations in fields with parallel drainagesystems using <strong>the</strong> DRAINMOD model(5) Estimate <strong>the</strong> “scope <strong>and</strong> effect” <strong>of</strong> ditches or subsurface drain lines(6) Analyze data from groundwater monitoring wells (see item g belowfor additional information)
ERDC/EL TR-12-5 112f. Evaluating multiple years <strong>of</strong> aerial photography. NRCS has developedan <strong>of</strong>fsite procedure that uses aerial photography to make wetl<strong>and</strong>hydrology determinations (USDA Natural Resources ConservationService 1997, Section 650.1903). The method is intended for useon agricultural l<strong>and</strong>s where human activity has altered or destroyedo<strong>the</strong>r wetl<strong>and</strong> indicators. However, <strong>the</strong> same approach may be usefulin o<strong>the</strong>r environments.The procedure uses five or more years <strong>of</strong> photography <strong>and</strong> evaluateseach photo for wetness signatures that are listed in Part 513.30 <strong>of</strong> <strong>the</strong>National Food Security Act Manual (USDA Natural Resources ConservationService 1994). Wetness signatures include surface water,saturated soils, flooded or drowned-out crops, stressed crops due towetness, differences in vegetation patterns due to different plantingdates, inclusion <strong>of</strong> wet areas into set-aside programs, unharvestedcrops, isolated areas that are not farmed with <strong>the</strong> rest <strong>of</strong> <strong>the</strong> field,patches <strong>of</strong> greener vegetation during dry periods, <strong>and</strong> o<strong>the</strong>r evidence <strong>of</strong>wet conditions. For each photo, <strong>the</strong> procedure described in item babove is used to determine whe<strong>the</strong>r <strong>the</strong> amount <strong>of</strong> rainfall in <strong>the</strong> 2 to3 months prior to <strong>the</strong> date <strong>of</strong> <strong>the</strong> photo was normal, below normal, orabove normal. Only photos taken in normal rainfall years, or an equalnumber <strong>of</strong> wetter-than-normal <strong>and</strong> drier-than-normal years, are usedin <strong>the</strong> analysis. If wetness signatures are observed on photos in morethan half <strong>of</strong> <strong>the</strong> years included in <strong>the</strong> analysis, <strong>the</strong>n wetl<strong>and</strong> hydrologyis present. Data forms that may be used to document <strong>the</strong> wetl<strong>and</strong>hydrology determination are given in section 650.1903 <strong>of</strong> USDANatural Resources Conservation Service (1997).g. Long-term hydrologic monitoring. On sites where <strong>the</strong> hydrology hasbeen manipulated by man (e.g., with ditches, subsurface drains, dams,levees, water diversions, l<strong>and</strong> grading or bedding) or where naturalevents (e.g., downcutting <strong>of</strong> streams) have altered conditions such thathydrology indicators may be missing or misleading, direct monitoring<strong>of</strong> surface <strong>and</strong> groundwater may be needed to determine <strong>the</strong> presenceor absence <strong>of</strong> wetl<strong>and</strong> hydrology. The U.S. <strong>Army</strong> <strong>Corps</strong> <strong>of</strong> <strong>Engineers</strong>(2005) provides minimum st<strong>and</strong>ards for <strong>the</strong> design, construction, <strong>and</strong>installation <strong>of</strong> water-table monitoring wells, <strong>and</strong> for <strong>the</strong> collection <strong>and</strong>interpretation <strong>of</strong> groundwater monitoring data, in cases where directhydrologic measurements are needed to determine whe<strong>the</strong>r wetl<strong>and</strong>sare present on highly disturbed or problematic sites. This st<strong>and</strong>ard
ERDC/EL TR-12-5 113calls for 14 or more consecutive days <strong>of</strong> flooding, ponding, or a watertable 12 in. (30 cm) or less below <strong>the</strong> soil surface during <strong>the</strong> growingseason at a minimum frequency <strong>of</strong> 5 years in 10 (50 percent or higherprobability), unless a different st<strong>and</strong>ard has been established for aparticular geographic area or wetl<strong>and</strong> type. A disturbed or problematicsite that meets this st<strong>and</strong>ard has wetl<strong>and</strong> hydrology. If <strong>the</strong> site inquestion is naturally hummocky or has been graded to enhance microtopography(e.g., ab<strong>and</strong>oned sugar cane plantations), <strong>the</strong>n topographichighs <strong>and</strong> lows should be evaluated separately. This region has a yearroundgrowing season. Therefore, wetl<strong>and</strong> hydrology is present on adisturbed or problematic site if <strong>the</strong> minimum requirements for duration<strong>and</strong> frequency <strong>of</strong> flooding, ponding, or high water tables are met atany time <strong>of</strong> year. This st<strong>and</strong>ard is not intended (1) to overrule anindicator-based wetl<strong>and</strong> determination on a site that is not disturbedor problematic, or (2) to test or validate existing or proposed wetl<strong>and</strong>indicators.Wetl<strong>and</strong>/non-wetl<strong>and</strong> mosaicsDescription <strong>of</strong> <strong>the</strong> problemIn this supplement, “mosaic” refers to a l<strong>and</strong>scape where wetl<strong>and</strong> <strong>and</strong>non-wetl<strong>and</strong> components are too closely associated to be easily delineatedor mapped separately. These areas <strong>of</strong>ten have complex microtopography,with repeated small changes in elevation occurring over short distances.Tops <strong>of</strong> ridges or hummocks are <strong>of</strong>ten non-wetl<strong>and</strong> but are interspersedwith wetl<strong>and</strong>s having clearly hydrophytic vegetation, hydric soils, <strong>and</strong>wetl<strong>and</strong> hydrology. Potential examples <strong>of</strong> wetl<strong>and</strong>/non-wetl<strong>and</strong> mosaics in<strong>the</strong> Hawai‘i <strong>and</strong> <strong>Pacific</strong> Isl<strong>and</strong>s Region include scattered wetl<strong>and</strong>s occupyingmicrotopographic lows created by cracks, folds, <strong>and</strong> depressions insome undulating pāhoehoe lava flows (Wakeley et al. 1996); hummockymicrotopography in floodplains caused by braided stream-flow patterns;<strong>and</strong> montane bog complexes.Wetl<strong>and</strong> components <strong>of</strong> a mosaic are <strong>of</strong>ten not difficult to identify. Theproblem for <strong>the</strong> wetl<strong>and</strong> delineator is that microtopographic features aretoo small <strong>and</strong> intermingled, <strong>and</strong> <strong>the</strong>re are too many such features on <strong>the</strong>site, to delineate <strong>and</strong> map <strong>the</strong>m accurately. Instead, <strong>the</strong> following samplingapproach can be used to estimate <strong>the</strong> percentage <strong>of</strong> wetl<strong>and</strong> in <strong>the</strong>mosaic. From this, <strong>the</strong> number <strong>of</strong> acres <strong>of</strong> wetl<strong>and</strong> on <strong>the</strong> site can becalculated, if needed.
ERDC/EL TR-12-5 114ProcedureFirst, identify <strong>and</strong> flag all contiguous areas <strong>of</strong> ei<strong>the</strong>r wetl<strong>and</strong> or nonwetl<strong>and</strong>on <strong>the</strong> site that are large enough to be delineated <strong>and</strong> mappedseparately. The remaining area should be mapped as “wetl<strong>and</strong>/nonwetl<strong>and</strong>mosaic” <strong>and</strong> <strong>the</strong> approximate percentage <strong>of</strong> wetl<strong>and</strong> within <strong>the</strong>area determined by <strong>the</strong> following procedure.1. Establish one or more continuous line transects across <strong>the</strong> mosaic area, asneeded. Measure <strong>the</strong> total length <strong>of</strong> each transect. A convenient method isto stretch a measuring tape along <strong>the</strong> transect <strong>and</strong> leave it in place whilesampling. If <strong>the</strong> site is shaped appropriately <strong>and</strong> multiple transects areused, <strong>the</strong>y should be arranged in parallel with each transect starting from ar<strong>and</strong>om point along one edge <strong>of</strong> <strong>the</strong> site. However, o<strong>the</strong>r arrangements <strong>of</strong>transects may be needed for oddly shaped sites.2. Use separate data forms for <strong>the</strong> swale or trough <strong>and</strong> for <strong>the</strong> ridges or hummocks.Sampling <strong>of</strong> vegetation, soil, <strong>and</strong> hydrology should follow <strong>the</strong>general procedures described in <strong>the</strong> <strong>Corps</strong> Manual <strong>and</strong> this supplement.Plot sizes <strong>and</strong> shapes for vegetation sampling must be adjusted to fit <strong>the</strong>microtopographic features on <strong>the</strong> site. Plots intended to sample <strong>the</strong>troughs should not overlap adjacent hummocks, <strong>and</strong> vice versa. Only oneor two data forms are required for each microtopographic position, <strong>and</strong> donot need to be repeated for similar features or plant communities.3. Identify every wetl<strong>and</strong> boundary in every trough or swale encounteredalong each transect. Each boundary location may be marked with a pin flagor simply recorded as a distance along <strong>the</strong> stretched tape.4. Determine <strong>the</strong> total distance along each transect that is occupied by wetl<strong>and</strong>s<strong>and</strong> non-wetl<strong>and</strong>s until <strong>the</strong> entire length <strong>of</strong> <strong>the</strong> line has beenaccounted for. Sum <strong>the</strong>se distances across transects, if needed. Determine<strong>the</strong> percentage <strong>of</strong> wetl<strong>and</strong> in <strong>the</strong> wetl<strong>and</strong>/non-wetl<strong>and</strong> mosaic by <strong>the</strong>following formula.Total wetl<strong>and</strong> distance along all transects% wetl<strong>and</strong> = ´100Total length <strong>of</strong> all transectsAn alternative approach involves point-intercept sampling at fixed intervalsalong transects across <strong>the</strong> area designated as wetl<strong>and</strong>/non-wetl<strong>and</strong>mosaic. This method avoids <strong>the</strong> need to identify wetl<strong>and</strong> boundaries in
ERDC/EL TR-12-5 115each swale, <strong>and</strong> can be carried out by pacing ra<strong>the</strong>r than stretching ameasuring tape across <strong>the</strong> site. The investigator uses a compass or o<strong>the</strong>rmeans to follow <strong>the</strong> selected transect line. At a fixed number <strong>of</strong> paces (e.g.,every two steps) <strong>the</strong> wetl<strong>and</strong> status <strong>of</strong> that point is determined byobserving indicators <strong>of</strong> hydrophytic vegetation, hydric soil, <strong>and</strong> wetl<strong>and</strong>hydrology. Again, a completed data form is not required at every point butat least one representative swale <strong>and</strong> hummock should be documentedwith completed forms. After all transects have been sampled, <strong>the</strong> result is anumber <strong>of</strong> wetl<strong>and</strong> sampling points <strong>and</strong> a number <strong>of</strong> non-wetl<strong>and</strong> points.Estimate <strong>the</strong> percentage <strong>of</strong> wetl<strong>and</strong> in <strong>the</strong> wetl<strong>and</strong>/non-wetl<strong>and</strong> mosaic by<strong>the</strong> following formula:Number <strong>of</strong> wetl<strong>and</strong> points along all transects%wetl<strong>and</strong>= × 100Total number <strong>of</strong> points sampled along all transects
ERDC/EL TR-12-5 116ReferencesBarbour, M. G., J. H. Burk, W. D. Pitts, F. S. Gilliam, <strong>and</strong> M. W. Schwartz. 1999.Terrestrial plant ecology, third edition. Toronto, Canada: Addison Wesley.Carroll, D., <strong>and</strong> J. C. Hathaway. 1963. Mineralogy <strong>of</strong> selected soils from Guam.Pr<strong>of</strong>essional Paper 403-F. Washington, DC: U.S. Department <strong>of</strong> <strong>the</strong> Interior,Geological Survey.Cox, G. 1990. Laboratory manual <strong>of</strong> general ecology, sixth edition. Dubuque, IA:William C. Brown.Deenik, J., <strong>and</strong> A. T. McClellan. 2007. Soils <strong>of</strong> Hawai‘i. Honolulu, HI: University <strong>of</strong>Hawai‘i at Mānoa, Cooperative Extension Service.Environmental Laboratory. 1987. <strong>Corps</strong> <strong>of</strong> <strong>Engineers</strong> wetl<strong>and</strong>s delineation manual.Technical Report Y-87-1. Vicksburg, MS: U.S. <strong>Army</strong> Engineer WaterwaysExperiment Station. (http://el.erdc.usace.army.mil/wetl<strong>and</strong>s/pdfs/wlman87.pdf)Erickson, T. A., <strong>and</strong> C. F. Puttock. 2006. Hawai‘i wetl<strong>and</strong> field guide. Honolulu, HI: BessPress.Freeze, R. A., <strong>and</strong> J. A. Cherry. 1979. Groundwater. Englewood Cliffs, NJ: Prentice-Hall.Gretag/Macbeth. 2000. Munsell® color. New Windsor, NY.Grimes, B. H., M. T. Huish, J. H. Kerby, <strong>and</strong> D. Moran. 1989. Atlantic marsh fiddler. InSpecies pr<strong>of</strong>iles: Life histories <strong>and</strong> environmental requirements <strong>of</strong> coastal fishes<strong>and</strong> invertebrates (Mid-Atlantic). Biological Report 82(11.114). Washington, DC:U.S. Fish <strong>and</strong> Wildlife Service.Hurt, G. W., <strong>and</strong> J. M. Galbraith. 2005. Using soil morphology <strong>and</strong> soil survey data forrestoring <strong>and</strong> creating wetl<strong>and</strong>s. Soil Survey Horizons 46(3): 109-119.Juvik, S. P., <strong>and</strong> J. O. Juvik. 1998. Atlas <strong>of</strong> Hawai‘i, third edition. Honolulu, HI:University <strong>of</strong> Hawai‘i Press.Kent, M., <strong>and</strong> P. Coker. 1992. Vegetation description <strong>and</strong> analysis: A practicalapproach. New York, NY: Wiley.Micheli, F., F. Gherardi, <strong>and</strong> M. Vannini. 1991. Feeding <strong>and</strong> burrowing ecology <strong>of</strong> twoEast African mangrove crabs. Marine Biology 111: 247-254.Mueller-Dombois, D., <strong>and</strong> H. Ellenberg. 1974. Aims <strong>and</strong> methods <strong>of</strong> vegetation ecology.New York, NY: Wiley.Mueller-Dombois, D., <strong>and</strong> F. R. Fosberg. 1998. Vegetation <strong>of</strong> <strong>the</strong> tropical <strong>Pacific</strong> isl<strong>and</strong>s.New York, NY: Springer.
ERDC/EL TR-12-5 117Nakamura, S. 1984. Soil survey <strong>of</strong> American Samoa. Washington, DC: U.S. Department<strong>of</strong> Agriculture, Soil Conservation Service.(http://soils.usda.gov/survey/online_surveys/pacific_basin/index.html)National Research Council. 1995. Wetl<strong>and</strong>s: Characteristics <strong>and</strong> boundaries.Washington, DC: National Academy Press.Neil, E. H. 1966. Observations on <strong>the</strong> behavior <strong>of</strong> Tilapia mossambica (Pisces, Cichlidae)in <strong>Hawaii</strong>an ponds. Copeia 1966: 50-56.Popma, T., <strong>and</strong> M. Masser. 1999. Tilapia – life history <strong>and</strong> biology. Publication No. 283.Stoneville, MS: Sou<strong>the</strong>rn Regional Aquaculture Center.(http://www.aquanic.org/publicat/usda_rac/efs/srac/283fs.pdf, accessed 27 February2009)Rabenhorst, M. C., <strong>and</strong> S. Parikh. 2000. Propensity <strong>of</strong> soils to develop redoximorphiccolor changes. Soil Science Society <strong>of</strong> America Journal 64:1904-1910.Ragone, D., <strong>and</strong> D. H. Lorence. 2006. Botanical <strong>and</strong> ethnobotanical inventories <strong>of</strong> <strong>the</strong>National Park <strong>of</strong> American Samoa. Draft Technical Report. Honolulu, HI:University <strong>of</strong> Hawai‘i at Mānoa, <strong>Pacific</strong> Cooperative Studies Unit.Reed, P. B., Jr. 1988. National list <strong>of</strong> plant species that occur in wetl<strong>and</strong>s: 1988 nationalsummary. Biological Report 88(24). Washington, DC: U.S. Fish <strong>and</strong> WildlifeService. (http://www.usace.army.mil/CECW/Documents/cecwo/reg/plants/list88.pdf)Shinn, E. A. 1968. Burrowing in recent lime sediments <strong>of</strong> Florida <strong>and</strong> <strong>the</strong> Bahamas.Journal <strong>of</strong> Paleontology 42: 879-894.Sprecher, S. W., <strong>and</strong> A. G. Warne. 2000. Accessing <strong>and</strong> using meteorological data toevaluate wetl<strong>and</strong> hydrology. ERDC/EL TR-WRAP-00-1. Vicksburg, MS: U.S.<strong>Army</strong> Engineer Research <strong>and</strong> Development Center.(http://el.erdc.usace.army.mil/elpubs/pdf/wrap00-1/wrap00-1.pdf)Takhtajan, Armen. 1986. Floristic regions <strong>of</strong> <strong>the</strong> world. (Translated by T. J. Crovello,edited by A. Cronquist). Berkeley, CA: University <strong>of</strong> California Press.Thurman, C. L., II. 1984. Ecological notes on fiddler crabs <strong>of</strong> south Texas, with specialreference to Uca subcylindrica. Journal <strong>of</strong> Crustacean Biology 4: 665-681.Tiner, R. W. 1999. Wetl<strong>and</strong> indicators: A guide to wetl<strong>and</strong> identification, delineation,classification, <strong>and</strong> mapping. Boca Raton, FL: Lewis Publishers.Tracey, J. I., Jr., S. O. Schlanger, J. T. Stark, D. B. Doan, <strong>and</strong> H. G. May. 1964. Generalgeology <strong>of</strong> Guam. Pr<strong>of</strong>essional Paper 403-A. Washington, DC: U.S. Department<strong>of</strong> <strong>the</strong> Interior, Geological Survey.U.S. <strong>Army</strong> <strong>Corps</strong> <strong>of</strong> <strong>Engineers</strong>. 2005. Technical st<strong>and</strong>ard for water-table monitoring <strong>of</strong>potential wetl<strong>and</strong> sites. ERDC TN-WRAP-05-02. Vicksburg, MS: U.S. <strong>Army</strong>Engineer Research <strong>and</strong> Development Center.(http://el.erdc.usace.army.mil/wrap/pdf/tnwrap05-2.pdf)U.S. <strong>Army</strong> <strong>Corps</strong> <strong>of</strong> <strong>Engineers</strong>. 2009. National wetl<strong>and</strong> plant list.(https://rsgis.crrel.usace.army.mil/apex/f?p=703)
ERDC/EL TR-12-5 118U.S. Central Intelligence Agency (CIA). 2008. The 2008 world fact book. Washington,DC. (https://www.cia.gov/library/index.html)USDA Natural Resources Conservation Service. 1994. National food security act manual,third edition (as amended). Washington, DC.(http://www.nrcs.usda.gov/programs/compliance/index.html)USDA Natural Resources Conservation Service. 1997. Hydrology tools for wetl<strong>and</strong>determination. Chapter 19, Engineering Field H<strong>and</strong>book. Fort Worth, TX: U.S.Department <strong>of</strong> Agriculture.(http://policy.nrcs.usda.gov/OpenNonWebContent.aspx?content=17556.wba)USDA Natural Resources Conservation Service. 1999. Soil taxonomy: A basic system <strong>of</strong> soilclassification for making <strong>and</strong> interpreting soil surveys. Agricultural H<strong>and</strong>book436. Washington, DC: U.S. Department <strong>of</strong> Agriculture.(http://soils.usda.gov/technical/classification/taxonomy/)USDA Natural Resources Conservation Service. 2002. Field book for describing <strong>and</strong>sampling soils, version 2.0. ed. P. J. Schoeneberger, D. A. Wysocki, E. C. Benham,<strong>and</strong> W. D. Broderson. Lincoln, NE: National Soil Survey Center.(http://soils.usda.gov/technical/fieldbook/)USDA Natural Resources Conservation Service. 2005. National soil survey h<strong>and</strong>book, part629, glossary. Washington, DC: U.S. Department <strong>of</strong> Agriculture. (ftp://ftpfc.sc.egov.usda.gov/NSSC/Soil_Survey_H<strong>and</strong>book/629_glossary.pdf)USDA Natural Resources Conservation Service. 2006. L<strong>and</strong> resource regions <strong>and</strong> majorl<strong>and</strong> resource areas <strong>of</strong> <strong>the</strong> United States, <strong>the</strong> Caribbean, <strong>and</strong> <strong>the</strong> <strong>Pacific</strong> Basin.Agriculture H<strong>and</strong>book 296. Washington, DC: U.S. Department <strong>of</strong> Agriculture.(http://soils.usda.gov/survey/geography/mlra/index.html)USDA Natural Resources Conservation Service. 2007. Hydric soil technical note 8: Use <strong>of</strong>alpha-alpha Dipyridyl. Washington, DC: USDA NRCS in cooperation withRichard Griffin <strong>and</strong> <strong>the</strong> National Technical Committee for Hydric Soils.(http://soils.usda.gov/use/hydric/ntchs/tech_notes/index.html).USDA Natural ResourcesConservation Service. 2007. Hydric soil technical note 11: The hydric soiltechnical st<strong>and</strong>ard. Washington, DC: USDA NRCS in cooperation with <strong>the</strong>National Technical Committee for Hydric Soils.(http://soils.usda.gov/use/hydric/ntchs/tech_notes/index.html).USDA Natural Resources Conservation Service. 2010. Field indicators <strong>of</strong> hydric soils in<strong>the</strong> United States, version 7.0. ed. L. M. Vasilas, G. W. Hurt, <strong>and</strong> C. V. Noble.Washington, DC: USDA NRCS in cooperation with <strong>the</strong> National TechnicalCommittee for Hydric Soils. (http://soils.usda.gov/use/hydric/)USDA Soil Conservation Service. 1994. Changes in hydric soils <strong>of</strong> <strong>the</strong> United States.Federal Register 59(133): 35680-35681, July 13, 1994.USDI Bureau <strong>of</strong> L<strong>and</strong> Management. 1996. Sampling vegetation attributes. BLM/RS/ST-96/002+1730. Denver, CO.USDI Bureau <strong>of</strong> L<strong>and</strong> Management. 1998. Measuring <strong>and</strong> monitoring plant populations.BLM/RS/ST-98/005+1730. Denver, CO.
ERDC/EL TR-12-5 119Vepraskas, M. J. 1992. Redoximorphic features for identifying aquic conditions. TechnicalBulletin 301. Raleigh, NC: North Carolina Agricultural Research Service, NorthCarolina State Univ.Vepraskas, M. J., <strong>and</strong> S. W. Sprecher. 1997. Aquic conditions <strong>and</strong> hydric soils: Theproblem soils. Special Publication Number 50. Madison, WI: Soil Science Society<strong>of</strong> America.Wakeley, J. S., <strong>and</strong> R. W. Lichvar. 1997. Disagreement between plot-based prevalenceindices <strong>and</strong> dominance ratios in evaluations <strong>of</strong> wetl<strong>and</strong> vegetation. Wetl<strong>and</strong>s 17:301-309.Wakeley, J. S., S. W. Sprecher, <strong>and</strong> R. W. Lichvar. 1996. Relationships among wetl<strong>and</strong>indicators in <strong>Hawaii</strong>an rain forest. Wetl<strong>and</strong>s 16: 173-184.Warner, G. F. 1969. The occurrence <strong>and</strong> distribution <strong>of</strong> crabs in a Jamaican mangroveswamp. Journal <strong>of</strong> Animal Ecology 38: 379-389.Wentworth, T. R., G. P. Johnson, <strong>and</strong> R. L. Kologiski. 1988. Designation <strong>of</strong> wetl<strong>and</strong>s byweighted averages <strong>of</strong> vegetation data: A preliminary evaluation. Water ResourcesBulletin 24: 389-396.Young, F. J. 1988. Soil survey <strong>of</strong> Territory <strong>of</strong> Guam. Washington, DC: U.S. Department<strong>of</strong> Agriculture, Soil Conservation Service.(http://soils.usda.gov/survey/online_surveys/pacific_basin/index.html)Young, F. J. 1989. Soil survey <strong>of</strong> <strong>the</strong> Isl<strong>and</strong>s <strong>of</strong> Aguijan, Rota, Saipan, <strong>and</strong> Tinian,Commonwealth <strong>of</strong> <strong>the</strong> Nor<strong>the</strong>rn Mariana Isl<strong>and</strong>s. Washington, DC: U.S.Department <strong>of</strong> Agriculture, Soil Conservation Service.(http://soils.usda.gov/survey/online_surveys/pacific_basin/index.html)
ERDC/EL TR-12-5 120Appendix A: GlossaryThis glossary is intended to supplement those given in <strong>the</strong> <strong>Corps</strong> Manual<strong>and</strong> o<strong>the</strong>r available sources. See <strong>the</strong> following publications for terms notlisted here: <strong>Corps</strong> Manual (Environmental Laboratory 1987)(http://el.erdc.usace.army.mil/wetl<strong>and</strong>s/pdfs/wlman87.pdf). Field Indicators <strong>of</strong> Hydric Soils in <strong>the</strong> United States (USDA NaturalResources Conservation Service 2010) (http://soils.usda.gov/use/hydric/). National Soil Survey H<strong>and</strong>book, Part 629 (USDA Natural ResourcesConservation Service 2005) (ftp://ftp-fc.sc.egov.usda.gov/NSSC/Soil_Survey_H<strong>and</strong>book/629_glossary.pdf).Absolute cover. In vegetation sampling, <strong>the</strong> percentage <strong>of</strong> <strong>the</strong> groundsurface that is covered by <strong>the</strong> aerial portions (leaves <strong>and</strong> stems) <strong>of</strong> a plantspecies when viewed from above. Due to overlapping plant canopies, <strong>the</strong>sum <strong>of</strong> absolute cover values for all species in a community or stratummay exceed 100 percent. In contrast, “relative cover” is <strong>the</strong> absolute cover<strong>of</strong> a species divided by <strong>the</strong> total coverage <strong>of</strong> all species in that stratum,expressed as a percent. Relative cover cannot be used to calculate <strong>the</strong>prevalence index.Aquitard. A layer <strong>of</strong> soil or rock that retards <strong>the</strong> downward flow <strong>of</strong> water<strong>and</strong> is capable <strong>of</strong> perching water above it. For <strong>the</strong> purposes <strong>of</strong> this supplement,<strong>the</strong> term aquitard also includes <strong>the</strong> term aquiclude, which is a soil orrock layer that is incapable <strong>of</strong> transmitting significant quantities <strong>of</strong> waterunder ordinary hydraulic gradients.Contrast. The color difference between a redox concentration <strong>and</strong> <strong>the</strong>dominant matrix color. Differences are classified as faint, distinct, orprominent <strong>and</strong> are defined in <strong>the</strong> glossary <strong>of</strong> USDA Natural ResourcesConservation Service (2010) <strong>and</strong> illustrated in Table A1.
ERDC/EL TR-12-5 121Table A1. Tabular key for contrast determinations using Munsell notation.Hues are <strong>the</strong> same ( h = 0) Hues differ by 2 pages ( h = 2) Value Chroma Contrast Value Chroma Contrast0 1 Faint 0 0 Faint0 2 Distinct 0 1 Distinct0 3 Distinct 0 2 Prominent0 4 Prominent 1 1 Distinct1 1 Faint 1 2 Prominent1 2 Distinct 2 --- Prominent1 3 Distinct1 4 Prominent2 1 Faint2 2 Distinct2 3 Distinct2 4 Prominent3 1 Distinct3 2 Distinct3 3 Distinct3 4 Prominent4 --- ProminentHues differ by 1 page ( h = 1) Hues differ by 3 or more pages ( h 3) Value Chroma Contrast Value Chroma Contrast0 1 Faint Color contrast is prominent, except for Prominent0 2 Distinctlow chroma <strong>and</strong> value.0 3 Prominent1 1 Faint1 2 Distinct1 3 Prominent2 1 Distinct2 2 Distinct2 3 Prominent3 --- ProminentNote: If both colors have values <strong>of</strong> ≤3 <strong>and</strong> chromas <strong>of</strong> ≤2, <strong>the</strong> color contrast is Faint (regardless <strong>of</strong> <strong>the</strong> difference in hue).Adapted from USDA Natural Resources Conservation Service (2002).
ERDC/EL TR-12-5 122Depleted matrix. The volume <strong>of</strong> a soil horizon or subhorizon fromwhich iron has been removed or transformed by processes <strong>of</strong> reduction<strong>and</strong> translocation to create colors <strong>of</strong> low chroma <strong>and</strong> high value. A, E, <strong>and</strong>calcic horizons may have low chromas <strong>and</strong> high values <strong>and</strong> may <strong>the</strong>reforebe mistaken for a depleted matrix. However, <strong>the</strong>y are excluded from <strong>the</strong>concept <strong>of</strong> depleted matrix unless common or many, distinct or prominentredox concentrations as s<strong>of</strong>t masses or pore linings are present. In someplaces <strong>the</strong> depleted matrix may change color upon exposure to air(reduced matrix); this phenomenon is included in <strong>the</strong> concept <strong>of</strong> depletedmatrix. The following combinations <strong>of</strong> value <strong>and</strong> chroma identify adepleted matrix:Matrix value <strong>of</strong> 5 or more <strong>and</strong> chroma <strong>of</strong> 1, with or without redoxconcentrations occurring as s<strong>of</strong>t masses <strong>and</strong>/or pore linings, orMatrix value <strong>of</strong> 6 or more <strong>and</strong> chroma <strong>of</strong> 2 or 1, with or without redoxconcentrations occurring as s<strong>of</strong>t masses <strong>and</strong>/or pore linings, orMatrix value <strong>of</strong> 4 or 5 <strong>and</strong> chroma <strong>of</strong> 2, with 2 percent or more distinctor prominent redox concentrations occurring as s<strong>of</strong>t masses <strong>and</strong>/orpore linings, orMatrix value <strong>of</strong> 4 <strong>and</strong> chroma <strong>of</strong> 1, with 2 percent or more distinct orprominent redox concentrations occurring as s<strong>of</strong>t masses <strong>and</strong>/or porelinings (USDA Natural Resources Conservation Service 2010).Common (2 to less than 20 percent) to many (20 percent or more) redoxconcentrations (USDA Natural Resources Conservation Service 2002) arerequired in soils with matrix colors <strong>of</strong> 4/1, 4/2, <strong>and</strong> 5/2 (Figure A1). Redoxconcentrations include iron <strong>and</strong> manganese masses <strong>and</strong> pore linings(Vepraskas 1992). See “contrast” in this glossary for <strong>the</strong> definitions <strong>of</strong>“distinct” <strong>and</strong> “prominent.”Diapause. A period during which growth or development is suspended<strong>and</strong> physiological activity is diminished, as in certain aquatic invertebratesin response to drying <strong>of</strong> temporary wetl<strong>and</strong>s.Distinct. See Contrast.Episaturation. Condition in which <strong>the</strong> soil is saturated with water at ornear <strong>the</strong> surface, but also has one or more unsaturated layers below <strong>the</strong>saturated zone. The zone <strong>of</strong> saturation is perched on top <strong>of</strong> a relativelyimpermeable layer.
ERDC/EL TR-12-5 123Figure A1. Illustration <strong>of</strong> values <strong>and</strong> chromas that require 2 percent or moredistinct or prominent redox concentrations <strong>and</strong> those that do not, for hue10YR, to meet <strong>the</strong> definition <strong>of</strong> a depleted matrix. Due to inaccurate colorreproduction, do not use this page to determine soil colors in <strong>the</strong> field.Background image from <strong>the</strong> Munsell Soil Color Charts reprinted courtesy <strong>of</strong>Munsell Color Services Lab, a part <strong>of</strong> X-Rite, Inc. (Gretag/Macbeth 2000).Fragmental soil material. Soil material that consists <strong>of</strong> 90 percent ormore rock fragments; less than 10 percent <strong>of</strong> <strong>the</strong> soil consists <strong>of</strong> particles2 mm or smaller (USDA Natural Resources Conservation Service 2010).
ERDC/EL TR-12-5 124Gleyed matrix. A gleyed matrix has one <strong>of</strong> <strong>the</strong> following combinations <strong>of</strong>hue, value, <strong>and</strong> chroma <strong>and</strong> <strong>the</strong> soil is not glauconitic (Figure A2):Figure A2. For hydric soil determinations, a gleyed matrix has <strong>the</strong> hues <strong>and</strong> chroma identifiedin this illustration with a value <strong>of</strong> 4 or more. Due to inaccurate color reproduction, do not usethis page to determine soil colors in <strong>the</strong> field. Background image from <strong>the</strong> Munsell Soil ColorCharts reprinted courtesy <strong>of</strong> Munsell Color Services Lab, a part <strong>of</strong> X-Rite, Inc.(Gretag/Macbeth 2000).10Y, 5GY, 10GY, 10G, 5BG, 10BG, 5B, 10B, or 5PB with value <strong>of</strong> 4 or more<strong>and</strong> chroma <strong>of</strong> 1; or5G with value <strong>of</strong> 4 or more <strong>and</strong> chroma <strong>of</strong> 1 or 2; orN with value <strong>of</strong> 4 or more (USDA Natural Resources ConservationService 2010).Growing season. The period <strong>of</strong> <strong>the</strong> year when plants <strong>and</strong> soils arebiologically active, causing <strong>the</strong> depletion <strong>of</strong> oxygen <strong>and</strong> chemical reduction<strong>of</strong> nitrogen, iron, <strong>and</strong> o<strong>the</strong>r elements in soils that are saturated for morethan a few days. In <strong>the</strong> Hawai‘i <strong>and</strong> <strong>Pacific</strong> Isl<strong>and</strong>s Region, <strong>the</strong> growingseason is year-round or 365 days long.
ERDC/EL TR-12-5 125High pH. pH <strong>of</strong> 7.9 or higher. Includes Slightly Alkaline, ModeratelyAlkaline, Strongly Alkaline, <strong>and</strong> Very Strongly Alkaline (USDA NaturalResources Conservation Service 2002).Nodules <strong>and</strong> concretions. Irregularly shaped, firm to extremely firmaccumulations <strong>of</strong> iron <strong>and</strong> manganese oxides. When broken open, noduleshave uniform internal structure whereas concretions have concentriclayers (Vepraskas 1992).Petrocalcic layer. A soil horizon in which calcium carbonate hasaccumulated to <strong>the</strong> extent that <strong>the</strong> layer is cemented or indurated.Prominent. See Contrast.Red parent material. Parent material with a natural inherent reddishcolor attributable to <strong>the</strong> presence <strong>of</strong> iron oxides occurring as coatings on<strong>and</strong> occluded within <strong>the</strong> mineral grains. Soils that formed in red parentmaterial have conditions that greatly retard <strong>the</strong> development <strong>and</strong> extent <strong>of</strong><strong>the</strong> redoximorphic features that normally occur under prolonged aquicconditions. Most commonly, <strong>the</strong> material consists <strong>of</strong> dark red,consolidated Mesozoic or Paleozoic sedimentary rocks, such as shale,siltstone, <strong>and</strong> s<strong>and</strong>stone, or alluvial materials derived from such rocks.Assistance from a local soil scientist may be needed to determine wherered parent material occurs.Reduced matrix. Soil matrix that has a low chroma in situ due topresence <strong>of</strong> reduced iron, but whose color changes in hue or chroma whenexposed to air as Fe 2+ is oxidized to Fe 3+ (Vepraskas 1992).Saprolite. S<strong>of</strong>t, friable, wea<strong>the</strong>red bedrock.Saturation. For wetl<strong>and</strong> delineation purposes, a soil layer is saturated ifvirtually all pores between soil particles are filled with water (NationalResearch Council 1995; Vepraskas <strong>and</strong> Sprecher 1997). This definitionincludes part <strong>of</strong> <strong>the</strong> capillary fringe above <strong>the</strong> water table (i.e., <strong>the</strong> tensionsaturatedzone) in which soil water content is approximately equal to thatbelow <strong>the</strong> water table (Freeze <strong>and</strong> Cherry 1979).
ERDC/EL TR-12-5 126Appendix B: Point-Intercept SamplingProcedure for Determining HydrophyticVegetationThe following procedure for point-intercept sampling is an alternative toplot-based sampling methods to estimate <strong>the</strong> abundance <strong>of</strong> plant speciesin a community. The approach may be used with <strong>the</strong> approval <strong>of</strong> <strong>the</strong>appropriate <strong>Corps</strong> <strong>of</strong> <strong>Engineers</strong> District to evaluate vegetation as part <strong>of</strong> awetl<strong>and</strong> delineation. Advantages <strong>of</strong> point-intercept sampling includebetter quantification <strong>of</strong> plant species abundance <strong>and</strong> reduced bias comparedwith visual estimates <strong>of</strong> cover. The method is useful in communitieswith high species diversity, <strong>and</strong> in areas where vegetation is patchy orheterogeneous, making it difficult to identify representative locations forplot sampling. Disadvantages include <strong>the</strong> increased time required forsampling <strong>and</strong> <strong>the</strong> need for vegetation units large enough to permit <strong>the</strong>establishment <strong>of</strong> one or more transect lines within <strong>the</strong>m. The approachalso assumes that soil <strong>and</strong> hydrologic conditions are uniform across <strong>the</strong>area where transects are located. In particular, transects should not cross<strong>the</strong> wetl<strong>and</strong> boundary. Point-intercept sampling is generally used with atransect-based prevalence index (see below) to determine whe<strong>the</strong>rvegetation is hydrophytic.In point-intercept sampling, plant occurrence is determined at pointslocated at fixed intervals along one or more transects established inr<strong>and</strong>om locations within <strong>the</strong> plant community or vegetation unit. If atransect is being used to sample <strong>the</strong> vegetation near a wetl<strong>and</strong> boundary,<strong>the</strong> transect should be placed parallel to <strong>the</strong> boundary <strong>and</strong> should notcross ei<strong>the</strong>r <strong>the</strong> wetl<strong>and</strong> boundary or into o<strong>the</strong>r communities. Usually ameasuring tape is laid on <strong>the</strong> ground <strong>and</strong> used for <strong>the</strong> transect line.Transect length depends upon <strong>the</strong> size <strong>and</strong> complexity <strong>of</strong> <strong>the</strong> plant community<strong>and</strong> may range from 100 to 300 ft (30 to 90 m) or more. Plantoccurrence data are collected at fixed intervals along <strong>the</strong> line, for exampleevery 2 ft (0.6 m). At each interval, a “hit” on a species is recorded if avertical line at that point would intercept <strong>the</strong> stem or foliage <strong>of</strong> that species.Only one “hit” is recorded for a species at a point even if <strong>the</strong> samespecies would be intercepted more than once at that point. Vertical interceptscan be determined using a long pin or rod protruding into <strong>and</strong>
ERDC/EL TR-12-5 127through <strong>the</strong> various vegetation layers, a sighting device (e.g., for <strong>the</strong>canopy), or an imaginary vertical line. The total number <strong>of</strong> “hits” for eachspecies along <strong>the</strong> transect is <strong>the</strong>n determined. The result is a list <strong>of</strong> species<strong>and</strong> <strong>the</strong>ir frequencies <strong>of</strong> occurrence along <strong>the</strong> line (Mueller-Dombois <strong>and</strong>Ellenberg 1974; Tiner 1999). Species are <strong>the</strong>n categorized by wetl<strong>and</strong>indicator status (i.e., OBL, FACW, FAC, FACU, or UPL), <strong>the</strong> total number<strong>of</strong> hits determined within each category, <strong>and</strong> <strong>the</strong> data used to calculate atransect-based prevalence index. The formula is similar to that given inChapter 2 for <strong>the</strong> plot-based prevalence index (see Indicator 3), exceptthat frequencies are used in place <strong>of</strong> cover estimates. The community ishydrophytic if <strong>the</strong> prevalence index is 3.0 or less. To be valid, more than80 percent <strong>of</strong> “hits” on <strong>the</strong> transect must be <strong>of</strong> species that have beenidentified correctly <strong>and</strong> placed in an indicator category.The transect-based prevalence index is calculated using <strong>the</strong> followingformula:F + 2F + 3F + 4F + 5FPI =FOBL + FFACW + FFAC + FFACU + FUPLOBL FACW FAC FACU UPLwhere:PI = prevalence indexF OBL = frequency <strong>of</strong> obligate (OBL) plant species;F FACW = frequency <strong>of</strong> facultative wetl<strong>and</strong> (FACW) plant species;F FAC = frequency <strong>of</strong> facultative (FAC) plant species;F FACU = frequency <strong>of</strong> facultative upl<strong>and</strong> (FACU) plant species;F UPL = frequency <strong>of</strong> upl<strong>and</strong> (UPL) plant species.
ERDC/EL TR-12-5 128Appendix C: Data Form
WETLAND DETERMINATION DATA FORM – Hawai‘i <strong>and</strong> <strong>Pacific</strong> Isl<strong>and</strong>s RegionProject/Site: City: Sampling Date: Time:Applicant/Owner: State/Terr/Comlth.: Isl<strong>and</strong>: Sampling Point:Investigator(s):TMK/Parcel:L<strong>and</strong>form (hillslope, coastal plain, etc.):Local relief (concave, convex, none):Lat: Long: Datum: Slope (%):Soil Map Unit Name:NWI classification:Are climatic / hydrologic conditions on <strong>the</strong> site typical for this time <strong>of</strong> year? Yes No (If no, explain in Remarks.)Are Vegetation , Soil , or Hydrology significantly disturbed? Are “Normal Circumstances” present? Yes NoAre Vegetation , Soil , or Hydrology naturally problematic? (If needed, explain any answers in Remarks.)SUMMARY OF FINDINGS – Attach site map showing sampling point locations, transects, important features, etc.Hydrophytic Vegetation Present? Yes NoHydric Soil Present? Yes NoWetl<strong>and</strong> Hydrology Present? Yes NoRemarks:Is <strong>the</strong> Sampled Areawithin a Wetl<strong>and</strong>? Yes NoVEGETATION – Use scientific names <strong>of</strong> plants.Absolute Dominant IndicatorTree Stratum (Plot size: ) % Cover Species? Status1.2.3.4.5.= Total CoverSapling/Shrub Stratum (Plot size: )1.2.3.4.5.= Total CoverHerb Stratum (Plot size: )1.2.3.4.5.6.7.8.= Total CoverWoody Vine Stratum (Plot size: )1.2.= Total CoverRemarks:Dominance Test worksheet:Number <strong>of</strong> Dominant SpeciesThat Are OBL, FACW, or FAC:Total Number <strong>of</strong> DominantSpecies Across All Strata:Percent <strong>of</strong> Dominant SpeciesThat Are OBL, FACW, or FAC:(A)(B)(A/B)Prevalence Index worksheet:Total % Cover <strong>of</strong>:Multiply by:OBL species x 1 =FACW species x 2 =FAC species x 3 =FACU species x 4 =UPL species x 5 =Column Totals: (A) (B)Prevalence Index = B/A =Hydrophytic Vegetation Indicators:1 - Rapid Test for Hydrophytic Vegetation2 - Dominance Test is >50%3 - Prevalence Index is ≤3.0 1Problematic Hydrophytic Vegetation 1 (Explain inRemarks or in <strong>the</strong> delineation report)1Indicators <strong>of</strong> hydric soil <strong>and</strong> wetl<strong>and</strong> hydrology mustbe present, unless disturbed or problematic.HydrophyticVegetationPresent? Yes NoUS <strong>Army</strong> <strong>Corps</strong> <strong>of</strong> <strong>Engineers</strong> Hawai‘i <strong>and</strong> <strong>Pacific</strong> Isl<strong>and</strong>s Region –Version 2.0
SOILSampling Point:Pr<strong>of</strong>ile Description: (Describe to <strong>the</strong> depth needed to document <strong>the</strong> indicator or confirm <strong>the</strong> absence <strong>of</strong> indicators.)Depth Matrix Redox Features(inches) Color (moist) % Color (moist) % Type 1 Loc 2 Texture Remarks1Type: C=Concentration, D=Depletion, RM=Reduced Matrix, MS=Masked S<strong>and</strong> Grains.2 Location: PL=Pore Lining, M=Matrix.Hydric Soil Indicators: Indicators for Problematic Hydric Soils 3 :Histosol (A1) S<strong>and</strong>y Redox (S5) Stratified Layers (A5)Histic Epipedon (A2) Dark Surface (S7) S<strong>and</strong>y Mucky Mineral (S1)Black Histic (A3) Loamy Gleyed Matrix (F2) Red Parent Material (F21)Hydrogen Sulfide (A4) Depleted Matrix (F3) Very Shallow Dark Surface (TF12)Muck Presence (A8) Redox Dark Surface (F6) O<strong>the</strong>r (Explain in Remarks)Depleted Below Dark Surface (A11) Depleted Dark Surface (F7)Thick Dark Surface (A12)Redox Depressions (F8)3 Indicators <strong>of</strong> hydrophytic vegetation <strong>and</strong> wetl<strong>and</strong> hydrologyS<strong>and</strong>y Gleyed Matrix (S4)must be present, unless disturbed or problematic.Restrictive Layer (if observed):Type:Depth (inches): Hydric Soil Present? Yes NoRemarks:HYDROLOGYWetl<strong>and</strong> Hydrology Indicators: (Explain observations in Remarks, if needed.)Primary Indicators (minimum <strong>of</strong> one required; check all that apply)Secondary Indicators (minimum <strong>of</strong> two required)Surface Water (A1) Aquatic Fauna (B13) Surface Soil Cracks (B6)High Water Table (A2) Tilapia Nests (B17) Sparsely Vegetated Concave Surface (B8)Saturation (A3) Hydrogen Sulfide Odor (C1) Drainage Patterns (B10)Water Marks (B1) Oxidized Rhizospheres on Living Roots (C3) Dry-Season Water Table (C2)Sediment Deposits (B2) Presence <strong>of</strong> Reduced Iron (C4) Salt Deposits (C5)Drift Deposits (B3) Recent Iron Reduction in Tilled Soils (C6) Stunted or Stressed Plants (D1)Algal Mat or Crust (B4) Thin Muck Surface (C7) Geomorphic Position (D2)Iron Deposits (B5) Fiddler Crab Burrows (C10) (Guam, CNMI, Shallow Aquitard (D3)Inundation Visible on Aerial Imagery (B7) <strong>and</strong> American Samoa) FAC-Neutral Test (D5)Water-Stained Leaves (B9)O<strong>the</strong>r (Explain in Remarks)Field Observations:Surface Water Present? Yes No Depth (inches):Water Table Present? Yes No Depth (inches):Saturation Present? Yes No Depth (inches):Wetl<strong>and</strong> Hydrology Present? Yes No(includes capillary fringe)Describe Recorded Data (stream gauge, monitoring well, aerial photos, previous inspections), if available:Remarks:US <strong>Army</strong> <strong>Corps</strong> <strong>of</strong> <strong>Engineers</strong> Hawai‘i <strong>and</strong> <strong>Pacific</strong> Isl<strong>and</strong>s Region –Version 2.0
REPORT DOCUMENTATION PAGEForm ApprovedOMB No. 0704-0188Public reporting burden for this collection <strong>of</strong> information is estimated to average 1 hour per response, including <strong>the</strong> time for reviewing instructions, searching existing data sources, ga<strong>the</strong>ring <strong>and</strong> maintaining<strong>the</strong> data needed, <strong>and</strong> completing <strong>and</strong> reviewing this collection <strong>of</strong> information. Send comments regarding this burden estimate or any o<strong>the</strong>r aspect <strong>of</strong> this collection <strong>of</strong> information, including suggestions forreducing this burden to Department <strong>of</strong> Defense, Washington Headquarters Services, Directorate for Information Operations <strong>and</strong> Reports (0704-0188), 1215 Jefferson Davis Highway, Suite 1204, Arlington,VA 22202-4302. Respondents should be aware that notwithst<strong>and</strong>ing any o<strong>the</strong>r provision <strong>of</strong> law, no person shall be subject to any penalty for failing to comply with a collection <strong>of</strong> information if it does notdisplay a currently valid OMB control number. PLEASE DO NOT RETURN YOUR FORM TO THE ABOVE ADDRESS.1. REPORT DATE (DD-MM-YYYY)3. DATES COVERED (From - To)February 20124. TITLE AND SUBTITLE2. REPORT TYPEFinal reportInterim Regional Supplement to <strong>the</strong> <strong>Corps</strong> <strong>of</strong> <strong>Engineers</strong> Wetl<strong>and</strong> Delineation Manual:Hawai‘i <strong>and</strong> <strong>Pacific</strong> Isl<strong>and</strong>s Region5a. CONTRACT NUMBER5b. GRANT NUMBER5c. PROGRAM ELEMENT NUMBER6. AUTHOR(S)U.S. <strong>Army</strong> <strong>Corps</strong> <strong>of</strong> <strong>Engineers</strong>5d. PROJECT NUMBER5e. TASK NUMBER5f. WORK UNIT NUMBER7. PERFORMING ORGANIZATION NAME(S) AND ADDRESS(ES) 8. PERFORMING ORGANIZATION REPORTNUMBERU.S. <strong>Army</strong> Engineer Research <strong>and</strong> Development CenterEnvironmental Laboratory3909 Halls Ferry RoadVicksburg, MS 39180-6199ERDC/EL TR-12-59. SPONSORING / MONITORING AGENCY NAME(S) AND ADDRESS(ES) 10. SPONSOR/MONITOR’S ACRONYM(S)Headquarters, U.S. <strong>Army</strong> <strong>Corps</strong> <strong>of</strong> <strong>Engineers</strong>Washington, DC 20314-100011. SPONSOR/MONITOR’S REPORTNUMBER(S)12. DISTRIBUTION / AVAILABILITY STATEMENTApproved to public release; distribution is unlimited.13. SUPPLEMENTARY NOTES14. ABSTRACTThis document is one <strong>of</strong> a series <strong>of</strong> Regional Supplements to <strong>the</strong> <strong>Corps</strong> <strong>of</strong> <strong>Engineers</strong> Wetl<strong>and</strong> Delineation Manual, which providestechnical guidance <strong>and</strong> procedures for identifying <strong>and</strong> delineating wetl<strong>and</strong>s that may be subject to regulatory jurisdiction underSection 404 <strong>of</strong> <strong>the</strong> Clean Water Act or Section 10 <strong>of</strong> <strong>the</strong> Rivers <strong>and</strong> Harbors Act. The development <strong>of</strong> Regional Supplements is part <strong>of</strong> anationwide effort to address regional wetl<strong>and</strong> characteristics <strong>and</strong> improve <strong>the</strong> accuracy <strong>and</strong> efficiency <strong>of</strong> wetl<strong>and</strong>-delineation procedures.This supplement is applicable to <strong>the</strong> Hawai‘i <strong>and</strong> <strong>Pacific</strong> Isl<strong>and</strong>s Region, which consists <strong>of</strong> <strong>the</strong> State <strong>of</strong> Hawai‘i, Territory <strong>of</strong>Guam, Commonwealth <strong>of</strong> <strong>the</strong> Nor<strong>the</strong>rn Mariana Isl<strong>and</strong>s, <strong>and</strong> <strong>the</strong> Territory <strong>of</strong> American Samoa.15. SUBJECT TERMSDelineationHydrologyPlant communitiesSoil16. SECURITY CLASSIFICATION OF: 17. LIMITATIONOF ABSTRACTa. REPORTUNCLASSIFIEDb. ABSTRACTUNCLASSIFIEDc. THIS PAGEUNCLASSIFIED18. NUMBEROF PAGES141VegetationWetl<strong>and</strong>s19a. NAME OF RESPONSIBLEPERSON19b. TELEPHONE NUMBER (includearea code)St<strong>and</strong>ard Form 298 (Rev. 8-98)Prescribed by ANSI Std. 239.18