Guidelines for the Echocardiographic Assessment of the Right Heart ...
Guidelines for the Echocardiographic Assessment of the Right Heart ...
Guidelines for the Echocardiographic Assessment of the Right Heart ...

You also want an ePaper? Increase the reach of your titles
YUMPU automatically turns print PDFs into web optimized ePapers that Google loves.
print & web 4C=FPO<br />
698 Rudski et al Journal <strong>of</strong> <strong>the</strong> American Society <strong>of</strong> Echocardiography<br />
July 2010<br />
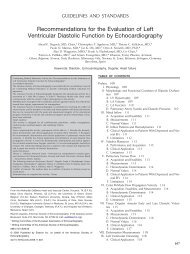
Figure 11 Doppler echocardiographic determination <strong>of</strong> systolic<br />
pulmonary artery pressure (SPAP). Spectral continuous-wave<br />
Doppler signal <strong>of</strong> tricuspid regurgitation corresponding to <strong>the</strong><br />
right ventricular (RV)–right atrial (RA) pressure gradient. SPAP<br />
was calculated as <strong>the</strong> sum <strong>of</strong> <strong>the</strong> estimated RA pressure (RAP)<br />
and <strong>the</strong> peak pressure gradient between <strong>the</strong> peak right ventricle<br />
and <strong>the</strong> right atrium, as estimated by application <strong>of</strong> <strong>the</strong> modified<br />
Bernoulli equation to peak velocity represented by <strong>the</strong> tricuspid<br />
regurgitation Doppler signal. In this example, SPAP is estimated<br />
at 31 + central venous pressure, or 34 mm Hg, if RAP is assumed<br />
to be 3 mm Hg. Adapted with permission from J Am Soc Echocardiogr.<br />
52<br />
flattening <strong>of</strong> <strong>the</strong> ventricular septum and a D-shaped short-axis LV cavity<br />
pr<strong>of</strong>ile predominantly during systole. This relationship between<br />
<strong>the</strong> left ventricle and right ventricle can be quantitated on <strong>the</strong> basis<br />
<strong>of</strong> <strong>the</strong> ratio between <strong>the</strong> LV anteroposterior dimension and <strong>the</strong> <strong>the</strong><br />
septolateral dimension. This ‘‘eccentricity index’’ is abnormal and suggests<br />
RV overload when this ratio is >1.0. 68 The configuration <strong>of</strong> <strong>the</strong><br />
interventricular septum is dependent on <strong>the</strong> relative pressure gradient<br />
between <strong>the</strong> right ventricle and left ventricle at each stage <strong>of</strong> <strong>the</strong> cardiac<br />
cycle. Because <strong>the</strong> majority <strong>of</strong> RV pressure overload conditions in<br />
adults arise secondary to <strong>the</strong> effects <strong>of</strong> elevation in LV filling pressure,<br />
<strong>the</strong> analysis <strong>of</strong> ventricular septal geometry and interaction is complicated<br />
by <strong>the</strong> superimposition <strong>of</strong> systolic RV pressure overload and<br />
diastolic LV pressure overload in <strong>the</strong>se patients. 69<br />
A. Differential Timing <strong>of</strong> Geometric Distortion in RV Pressure<br />
and Volume Overload States<br />
Differences in <strong>the</strong> timing <strong>of</strong> ventricular septal motion have been<br />
measured with Doppler tissue imaging and M-mode echocardiography<br />
(Figure 10). 70 Although patients with relatively isolated RV volume<br />
overload have <strong>the</strong> most marked shift <strong>of</strong> <strong>the</strong> ventricular septum<br />
away from <strong>the</strong> center <strong>of</strong> <strong>the</strong> right ventricle at end-diastole (with relatively<br />
more normal septal geometry at end-systole), patients with<br />
relatively isolated RV pressure overload have leftward septal shift<br />
away from <strong>the</strong> center <strong>of</strong> <strong>the</strong> right ventricle at both end-systole<br />
and end-diastole, with <strong>the</strong> most marked de<strong>for</strong>mation at endsystole.<br />
In selected patient populations such as PA hypertension,<br />
<strong>the</strong> ventricular septal eccentricity index and its timing can be<br />
quantitated to provide prognostic in<strong>for</strong>mation that tracks clinical<br />
responses to effective <strong>the</strong>rapies. 71,72 Analysis <strong>of</strong> septal motion is<br />
best per<strong>for</strong>med in <strong>the</strong> absence <strong>of</strong> significant conduction delays,<br />
particularly left bundle branch block.<br />
Recommendations: Visual assessment <strong>of</strong> ventricular septal<br />
curvature looking <strong>for</strong> a D-shaped pattern in systole and<br />
diastole should be used to help in <strong>the</strong> diagnosis <strong>of</strong> RV volume<br />
and/or pressure overload. Although a D-shaped septum<br />
is not diagnostic in RV overload, with its presence,<br />
additional emphasis should be placed on <strong>the</strong> confirmation,<br />
as well as determination, <strong>of</strong> <strong>the</strong> etiology and severity <strong>of</strong><br />
right-sided pressure and/or volume overload.<br />
HEMODYNAMIC ASSESSMENT OF THE RIGHT VENTRICLE<br />
AND PULMONARY CIRCULATION<br />
A. Systolic Pulmonary Artery Pressure<br />
SPAP can be estimated using TR velocity, and PADP can be estimated<br />
from <strong>the</strong> end-diastolic pulmonary regurgitation velocity. Mean PA<br />
pressure can be estimated by <strong>the</strong> PA acceleration time (AT) or derived<br />
from <strong>the</strong> systolic and diastolic pressures.<br />
RVSP can be reliably determined from peak TR jet velocity, using<br />
<strong>the</strong> simplified Bernoulli equation and combining this value with an estimate<br />
<strong>of</strong> <strong>the</strong> RA pressure: RVSP = 4(V) 2 + RA pressure, where V is<br />
<strong>the</strong> peak velocity (in meters per second) <strong>of</strong> <strong>the</strong> tricuspid valve regurgitant<br />
jet, and RA pressure is estimated from IVC diameter and respiratory<br />
changes as described above. In <strong>the</strong> absence <strong>of</strong> a gradient <strong>of</strong><br />
across <strong>the</strong> pulmonic valve or RVOT, SPAP is equal to RVSP. In cases<br />
in which RVSP is elevated, obstruction at <strong>the</strong> level <strong>of</strong> <strong>the</strong> RVOTor pulmonic<br />
valve should be excluded, especially in patients with congenital<br />
heart disease or post-pulmonic valve surgery. The simplified Bernoulli<br />
equation may occasionally underestimate <strong>the</strong> RV-RA gradient because<br />
<strong>of</strong> its neglect <strong>of</strong> <strong>the</strong> inertial component <strong>of</strong> <strong>the</strong> complete<br />
Bernoulli equation. Because velocity measurements are angle dependent,<br />
it is recommended to ga<strong>the</strong>r TR signals from several windows<br />
and to use <strong>the</strong> signal with <strong>the</strong> highest velocity.<br />
Technically adequate signals with well-defined borders can be obtained<br />
in <strong>the</strong> majority <strong>of</strong> patients. It is recommended that Doppler<br />
sweep speeds <strong>of</strong> 100 mm/s be used <strong>for</strong> all tracings. If <strong>the</strong> signal is<br />
weak, it may be enhanced with agitated saline or blood-saline contrast,<br />
but it is important to avoid overestimation <strong>of</strong> <strong>the</strong> spectral envelope<br />
by ensuring that only <strong>the</strong> well-defined, dense spectral pr<strong>of</strong>ile is<br />
measured. This is important both with and without contrast<br />
(Figure 12).<br />
The normal cut<strong>of</strong>f value <strong>for</strong> invasively measured mean PA pressure<br />
is 25 mmHg. In <strong>the</strong> echocardiography laboratory, SPAP is more commonly<br />
measured and reported. Normal resting values are usually defined<br />
as a peak TR gradient <strong>of</strong> #2.8 to 2.9 m/s or a peak systolic<br />
pressure <strong>of</strong> 35 or 36 mm Hg, assuming an RA pressure <strong>of</strong> 3 to 5<br />
mm Hg. 73 This value may increase with age and increasing body surface<br />
area and this should be considered when estimations are at <strong>the</strong><br />
upper limits <strong>of</strong> normal. 74,75 The most recent American College <strong>of</strong><br />
Cardiology Foundation and American <strong>Heart</strong> Association expert<br />
consensus document on PH recommends fur<strong>the</strong>r evaluation <strong>of</strong><br />
patients with dyspnea with estimated RVSP > 40 mm Hg. 76 Some<br />
cardiologists who care <strong>for</strong> patients with congenital heart disease will<br />
consider SPAP greater than two thirds <strong>of</strong> <strong>the</strong> systemic blood pressure<br />
as indicative <strong>of</strong> severe PH.<br />
Determination <strong>of</strong> SPAP by <strong>the</strong> sum <strong>of</strong> peak RV-RA gradient and<br />
RA pressure has been established as a reliable method since <strong>the</strong> publication<br />
by Yock and Popp 77 in 1984 and has been proven by o<strong>the</strong>r<br />
studies, 78 but additional studies have questioned <strong>the</strong> accuracy <strong>of</strong>