Guidelines for the Echocardiographic Assessment of the Right Heart ...
Guidelines for the Echocardiographic Assessment of the Right Heart ...
Guidelines for the Echocardiographic Assessment of the Right Heart ...

Create successful ePaper yourself
Turn your PDF publications into a flip-book with our unique Google optimized e-Paper software.
GUIDELINES AND STANDARDS<br />
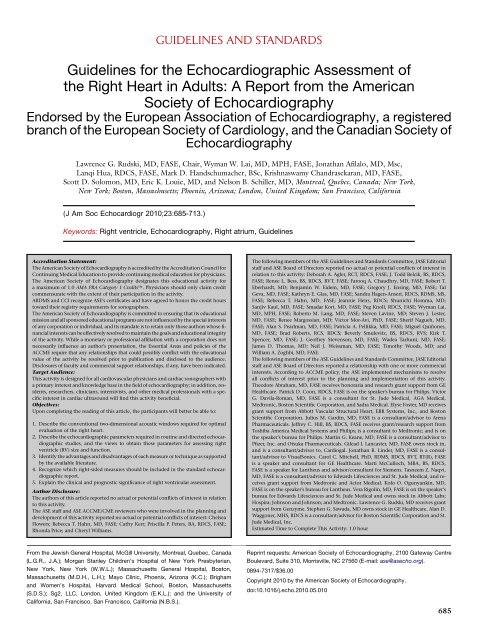
<strong>Guidelines</strong> <strong>for</strong> <strong>the</strong> <strong>Echocardiographic</strong> <strong>Assessment</strong> <strong>of</strong><br />
<strong>the</strong> <strong>Right</strong> <strong>Heart</strong> in Adults: A Report from <strong>the</strong> American<br />
Society <strong>of</strong> Echocardiography<br />
Endorsed by <strong>the</strong> European Association <strong>of</strong> Echocardiography, a registered<br />
branch <strong>of</strong> <strong>the</strong> European Society <strong>of</strong> Cardiology, and <strong>the</strong> Canadian Society <strong>of</strong><br />
Echocardiography<br />
Lawrence G. Rudski, MD, FASE, Chair, Wyman W. Lai, MD, MPH, FASE, Jonathan Afilalo, MD, Msc,<br />
Lanqi Hua, RDCS, FASE, Mark D. Handschumacher, BSc, Krishnaswamy Chandrasekaran, MD, FASE,<br />
Scott D. Solomon, MD, Eric K. Louie, MD, and Nelson B. Schiller, MD, Montreal, Quebec, Canada; New York,<br />
New York; Boston, Massachusetts; Phoenix, Arizona; London, United Kingdom; San Francisco, Cali<strong>for</strong>nia<br />
(J Am Soc Echocardiogr 2010;23:685-713.)<br />
Keywords: <strong>Right</strong> ventricle, Echocardiography, <strong>Right</strong> atrium, <strong>Guidelines</strong><br />
Accreditation Statement:<br />
The American Society <strong>of</strong> Echocardiography is accredited by <strong>the</strong> Accreditation Council <strong>for</strong><br />
Continuing Medical Education to provide continuing medical education <strong>for</strong> physicians.<br />
The American Society <strong>of</strong> Echocardiography designates this educational activity <strong>for</strong><br />
a maximum <strong>of</strong> 1.0 AMA PRA Category 1 CreditsÔ. Physicians should only claim credit<br />
commensurate with <strong>the</strong> extent <strong>of</strong> <strong>the</strong>ir participation in <strong>the</strong> activity.<br />
ARDMS and CCI recognize ASE’s certificates and have agreed to honor <strong>the</strong> credit hours<br />
toward <strong>the</strong>ir registry requirements <strong>for</strong> sonographers.<br />
The American Society <strong>of</strong> Echocardiography is committed to ensuring that its educational<br />
mission and all sponsored educational programs are not influenced by <strong>the</strong> special interests<br />
<strong>of</strong> any corporation or individual, and its mandate is to retain only those authors whose financial<br />
interests can be effectively resolved to maintain <strong>the</strong> goals and educational integrity<br />
<strong>of</strong> <strong>the</strong> activity. While a monetary or pr<strong>of</strong>essional affiliation with a corporation does not<br />
necessarily influence an author’s presentation, <strong>the</strong> Essential Areas and policies <strong>of</strong> <strong>the</strong><br />
ACCME require that any relationships that could possibly conflict with <strong>the</strong> educational<br />
value <strong>of</strong> <strong>the</strong> activity be resolved prior to publication and disclosed to <strong>the</strong> audience.<br />
Disclosures <strong>of</strong> faculty and commercial support relationships, if any, have been indicated.<br />
Target Audience:<br />
This activity is designed <strong>for</strong> all cardiovascular physicians and cardiac sonographers with<br />
a primary interest and knowledge base in <strong>the</strong> field <strong>of</strong> echocardiography; in addition, residents,<br />
researchers, clinicians, intensivists, and o<strong>the</strong>r medical pr<strong>of</strong>essionals with a specific<br />
interest in cardiac ultrasound will find this activity beneficial.<br />
Objectives:<br />
Upon completing <strong>the</strong> reading <strong>of</strong> this article, <strong>the</strong> participants will better be able to:<br />
1. Describe <strong>the</strong> conventional two-dimensional acoustic windows required <strong>for</strong> optimal<br />
evaluation <strong>of</strong> <strong>the</strong> right heart.<br />
2. Describe <strong>the</strong> echocardiographic parameters required in routine and directed echocardiographic<br />
studies, and <strong>the</strong> views to obtain <strong>the</strong>se parameters <strong>for</strong> assessing right<br />
ventricle (RV) size and function.<br />
3. Identify <strong>the</strong> advantages and disadvantages <strong>of</strong> each measure or technique as supported<br />
by <strong>the</strong> available literature.<br />
4. Recognize which right-sided measures should be included in <strong>the</strong> standard echocardiographic<br />
report.<br />
5. Explain <strong>the</strong> clinical and prognostic significance <strong>of</strong> right ventricular assessment.<br />
Author Disclosure:<br />
The authors <strong>of</strong> this article reported no actual or potential conflicts <strong>of</strong> interest in relation<br />
to this activity.<br />
The ASE staff and ASE ACCME/CME reviewers who were involved in <strong>the</strong> planning and<br />
development <strong>of</strong> this activity reported no actual or potential conflicts <strong>of</strong> interest: Chelsea<br />
Flowers; Rebecca T. Hahn, MD, FASE; Cathy Kerr; Priscilla P. Peters, BA, RDCS, FASE;<br />
Rhonda Price; and Cheryl Williams.<br />
From <strong>the</strong> Jewish General Hospital, McGill University, Montreal, Quebec, Canada<br />
(L.G.R., J.A.); Morgan Stanley Children’s Hospital <strong>of</strong> New York Presbyterian,<br />
New York, New York (W.W.L.); Massachusetts General Hospital, Boston,<br />
Massachusetts (M.D.H., L.H.); Mayo Clinic, Phoenix, Arizona (K.C.); Brigham<br />
and Women’s Hospital, Harvard Medical School, Boston, Massachusetts<br />
(S.D.S.); Sg2, LLC, London, United Kingdom (E.K.L.); and <strong>the</strong> University <strong>of</strong><br />
Cali<strong>for</strong>nia, San Francisco, San Francisco, Cali<strong>for</strong>nia (N.B.S.).<br />
The following members <strong>of</strong> <strong>the</strong> ASE <strong>Guidelines</strong> and Standards Committee, JASE Editorial<br />
staff and ASE Board <strong>of</strong> Directors reported no actual or potential conflicts <strong>of</strong> interest in<br />
relation to this activity: Deborah A. Agler, RCT, RDCS, FASE; J. Todd Belcik, BS, RDCS,<br />
FASE; Renee L. Bess, BS, RDCS, RVT, FASE; Farooq A. Chaudhry, MD, FASE; Robert T.<br />
Eberhardt, MD; Benjamin W. Eidem, MD, FASE; Gregory J. Ensing, MD, FASE; Tal<br />
Geva, MD, FASE; Kathryn E. Glas, MD, FASE; Sandra Hagen-Ansert, RDCS, RDMS, MS,<br />
FASE; Rebecca T. Hahn, MD, FASE; Jeannie Heirs, RDCS; Shunichi Homma, MD;<br />
Sanjiv Kaul, MD, FASE; Smadar Kort, MD, FASE; Peg Knoll, RDCS, FASE; Wyman Lai,<br />
MD, MPH, FASE; Roberto M. Lang, MD, FASE; Steven Lavine, MD; Steven J. Lester,<br />
MD, FASE; Renee Margossian, MD; Victor Mor-Avi, PhD, FASE; Sherif Nagueh, MD,<br />
FASE; Alan S. Pearlman, MD, FASE; Patricia A. Pellikka, MD, FASE; Miguel Quiñones,<br />
MD, FASE; Brad Roberts, RCS, RDCS; Beverly Smulevitz, BS, RDCS, RVS; Kirk T.<br />
Spencer, MD, FASE; J. Ge<strong>of</strong>frey Stevenson, MD, FASE; Wadea Tarhuni, MD, FASE;<br />
James D. Thomas, MD; Neil J. Weissman, MD, FASE; Timothy Woods, MD; and<br />
William A. Zoghbi, MD, FASE.<br />
The following members <strong>of</strong> <strong>the</strong> ASE <strong>Guidelines</strong> and Standards Committee, JASE Editorial<br />
staff and ASE Board <strong>of</strong> Directors reported a relationship with one or more commercial<br />
interests. According to ACCME policy, <strong>the</strong> ASE implemented mechanisms to resolve<br />
all conflicts <strong>of</strong> interest prior to <strong>the</strong> planning and implementation <strong>of</strong> this activity.<br />
Theodore Abraham, MD, FASE receives honoraria and research grant support from GE<br />
Healthcare. Patrick D. Coon, RDCS, FASE is on <strong>the</strong> speaker’s bureau <strong>for</strong> Philips. Victor<br />
G. Davila-Roman, MD, FASE is a consultant <strong>for</strong> St. Jude Medical, AGA Medical,<br />
Medtronic, Boston Scientific Corporation, and Sadra Medical. Elyse Foster, MD receives<br />
grant support from Abbott Vascular Structural <strong>Heart</strong>, EBR Systems, Inc., and Boston<br />
Scientific Corporation. Julius M. Gardin, MD, FASE is a consultant/advisor to Arena<br />
Pharmaceuticals. Jeffrey C. Hill, BS, RDCS, FASE receives grant/research support from<br />
Toshiba America Medical Systems and Philips; is a consultant to Medtronic; and is on<br />
<strong>the</strong> speaker’s bureau <strong>for</strong> Philips. Martin G. Keane, MD, FASE is a consultant/advisor to<br />
Pfizer, Inc. and Otsuka Pharmaceuticals. Gilead I. Lancaster, MD, FASE owns stock in,<br />
and is a consultant/advisor to, Cardiogal. Jonathan R. Linder, MD, FASE is a consultant/advisor<br />
to VisualSonics. Carol C. Mitchell, PhD, RDMS, RDCS, RVT, RT(R), FASE<br />
is a speaker and consultant <strong>for</strong> GE Healthcare. Marti McCulloch, MBA, BS, RDCS,<br />
FASE is a speaker <strong>for</strong> Lan<strong>the</strong>us and advisor/consultant <strong>for</strong> Siemens. Tasneem Z. Naqvi,<br />
MD, FASE is a consultant/advisor to Edwards Lifesciences and St. Jude Medical, and receives<br />
grant support from Medtronic and Actor Medical. K<strong>of</strong>o O. Ogunyankin, MD,<br />
FASE is on <strong>the</strong> speaker’s bureau <strong>for</strong> Lan<strong>the</strong>us. Vera Rigolin, MD, FASE is on <strong>the</strong> speaker’s<br />
bureau <strong>for</strong> Edwards Lifesciences and St. Jude Medical and owns stock in Abbott Labs;<br />
Hospira; Johnson and Johnson; and Medtronic. Lawrence G. Rudski, MD receives grant<br />
support from Genzyme. Stephen G. Sawada, MD owns stock in GE Healthcare. Alan D.<br />
Waggoner, MHS, RDCS is a consultant/advisor <strong>for</strong> Boston Scientific Corporation and St.<br />
Jude Medical, Inc.<br />
Estimated Time to Complete This Activity: 1.0 hour<br />
Reprint requests: American Society <strong>of</strong> Echocardiography, 2100 Gateway Centre<br />
Boulevard, Suite 310, Morrisville, NC 27560 (E-mail: ase@asecho.org).<br />
0894-7317/$36.00<br />
Copyright 2010 by <strong>the</strong> American Society <strong>of</strong> Echocardiography.<br />
doi:10.1016/j.echo.2010.05.010<br />
685
686 Rudski et al Journal <strong>of</strong> <strong>the</strong> American Society <strong>of</strong> Echocardiography<br />
July 2010<br />
TABLE OF CONTENTS<br />
Executive Summary 686<br />
Overview 688<br />
Methodology in <strong>the</strong> Establishment <strong>of</strong> Reference Value and<br />
Ranges 688<br />
Acoustic Windows and <strong>Echocardiographic</strong> Views <strong>of</strong> <strong>the</strong> <strong>Right</strong><br />
<strong>Heart</strong> 690<br />
Nomenclature <strong>of</strong> <strong>Right</strong> <strong>Heart</strong> Segments and Coronary Supply 690<br />
Conventional Two-Dimensional <strong>Assessment</strong> <strong>of</strong> <strong>the</strong> <strong>Right</strong><br />
<strong>Heart</strong> 690<br />
A. <strong>Right</strong> Atrium 690<br />
RA Pressure 691<br />
B. <strong>Right</strong> Ventricle 692<br />
RV Wall Thickness 692<br />
RV Linear Dimensions 693<br />
C. RVOT 694<br />
Fractional Area Change and Volumetric <strong>Assessment</strong> <strong>of</strong> <strong>the</strong> <strong>Right</strong><br />
Ventricle 696<br />
A. RVArea and FAC 696<br />
B. Two-Dimensional Volume and EF Estimation 696<br />
C. Three-Dimensional Volume Estimation 697<br />
The <strong>Right</strong> Ventricle and Interventricular Septal Morphology 697<br />
A. Differential Timing <strong>of</strong> Geometric Distortion in RV Pressure and<br />
Volume Overload States 698<br />
Hemodynamic <strong>Assessment</strong> <strong>of</strong> <strong>the</strong> <strong>Right</strong> Ventricle and Pulmonary<br />
Circulation 698<br />
A. Systolic Pulmonary Artery Pressure 698<br />
B. PA Diastolic Pressure 699<br />
C. Mean PA Pressure 699<br />
D. Pulmonary Vascular Resistance 699<br />
E. Measurement <strong>of</strong> PA Pressure During Exercise 699<br />
Nonvolumetric <strong>Assessment</strong> <strong>of</strong> <strong>Right</strong> Ventricular Function 700<br />
A. Global <strong>Assessment</strong> <strong>of</strong> RV Systolic Function 700<br />
RV dP/dt 700<br />
RIMP 700<br />
B. Regional <strong>Assessment</strong> <strong>of</strong> RV Systolic Function 701<br />
TAPSE or Tricuspid Annular Motion (TAM) 701<br />
Doppler Tissue Imaging 702<br />
Myocardial Acceleration During Isovolumic Contraction 703<br />
Regional RV Strain and Strain Rate 704<br />
Two-Dimensional Strain 705<br />
Summary <strong>of</strong> Recommendations <strong>for</strong> <strong>the</strong> <strong>Assessment</strong> <strong>of</strong> <strong>Right</strong><br />
Ventricular Systolic Function 705<br />
<strong>Right</strong> Ventricular Diastolic Function 705<br />
A. RV Diastolic Dysfunction 705<br />
B. Measurement <strong>of</strong> RV Diastolic Function 705<br />
C. Effects <strong>of</strong> Age, Respiration, <strong>Heart</strong> Rate, and Loading Conditions<br />
706<br />
D. Clinical Relevance 706<br />
Clinical and Prognostic Significance <strong>of</strong> <strong>Right</strong> Ventricular <strong>Assessment</strong><br />
706<br />
References 708<br />
EXECUTIVE SUMMARY<br />
The right ventricle plays an important role in <strong>the</strong> morbidity and mortality<br />
<strong>of</strong> patients presenting with signs and symptoms <strong>of</strong> cardiopulmonary<br />
disease. However, <strong>the</strong> systematic assessment <strong>of</strong> right heart<br />
function is not uni<strong>for</strong>mly carried out. This is due partly to <strong>the</strong> enormous<br />
attention given to <strong>the</strong> evaluation <strong>of</strong> <strong>the</strong> left heart, a lack <strong>of</strong> familiarity<br />
with ultrasound techniques that can be used in imaging <strong>the</strong> right<br />
heart, and a paucity <strong>of</strong> ultrasound studies providing normal reference<br />
values <strong>of</strong> right heart size and function.<br />
In all studies, <strong>the</strong> sonographer and physician should examine<br />
<strong>the</strong> right heart using multiple acoustic windows,<br />
and <strong>the</strong> report should represent an assessment based on<br />
qualitative and quantitative parameters. The parameters<br />
to be per<strong>for</strong>med and reported should include a measure<br />
<strong>of</strong> right ventricular (RV) size, right atrial (RA) size, RV systolic<br />
function (at least one <strong>of</strong> <strong>the</strong> following: fractional area<br />
change [FAC], S 0 , and tricuspid annular plane systolic excursion<br />
[TAPSE]; with or without RV index <strong>of</strong> myocardial<br />
per<strong>for</strong>mance [RIMP]), and systolic pulmonary artery (PA)<br />
pressure (SPAP) with estimate <strong>of</strong> RA pressure on <strong>the</strong> basis<br />
<strong>of</strong> inferior vena cava (IVC) size and collapse. In many conditions,<br />
additional measures such as PA diastolic pressure<br />
(PADP) and an assessment <strong>of</strong> RV diastolic function are indicated.<br />
The reference values <strong>for</strong> <strong>the</strong>se recommended measurements<br />
are displayed in Table 1. These reference values<br />
are based on values obtained from normal individuals<br />
without any histories <strong>of</strong> heart disease and exclude those<br />
with histories <strong>of</strong> congenital heart disease. Many <strong>of</strong> <strong>the</strong> recommended<br />
values differ from those published in <strong>the</strong> previous<br />
recommendations <strong>for</strong> chamber quantification <strong>of</strong> <strong>the</strong><br />
American Society <strong>of</strong> Echocardiography (ASE). The current<br />
values are based on larger populations or pooled values<br />
from several studies, while several previous normal values<br />
were based on a single study. It is important <strong>for</strong> <strong>the</strong> interpreting<br />
physician to recognize that <strong>the</strong> values proposed<br />
are not indexed to body surface area or height. As a result,<br />
it is possible that patients at ei<strong>the</strong>r extreme may be misclassified<br />
as having values outside <strong>the</strong> reference ranges. The<br />
available data are insufficient <strong>for</strong> <strong>the</strong> classification <strong>of</strong> <strong>the</strong><br />
abnormal categories into mild, moderate, and severe.<br />
Interpreters should <strong>the</strong>re<strong>for</strong>e use <strong>the</strong>ir judgment in determining<br />
<strong>the</strong> extent <strong>of</strong> abnormality observed <strong>for</strong> any given<br />
parameter. As in all studies, it is <strong>the</strong>re<strong>for</strong>e critical that all in<strong>for</strong>mation<br />
obtained from <strong>the</strong> echocardiographic examination<br />
be considered in <strong>the</strong> final interpretation.<br />
Essential Imaging Windows and Views<br />
Apical 4-chamber, modified apical 4-chamber, left parasternal longaxis<br />
(PLAX) and parasternal short-axis (PSAX), left parasternal RV<br />
inflow, and subcostal views provide images <strong>for</strong> <strong>the</strong> comprehensive assessment<br />
<strong>of</strong> RV systolic and diastolic function and RV systolic pressure<br />
(RVSP).<br />
<strong>Right</strong> <strong>Heart</strong> Dimensions. RV DIMENSION. RV dimension is best estimated<br />
at end-diastole from a right ventricle–focused apical 4-chamber<br />
view. Care should be taken to obtain <strong>the</strong> image demonstrating <strong>the</strong><br />
maximum diameter <strong>of</strong> <strong>the</strong> right ventricle without <strong>for</strong>eshortening<br />
(Figure 6). This can be accomplished by making sure that <strong>the</strong> crux<br />
and apex <strong>of</strong> <strong>the</strong> heart are in view (Figure 7). Diameter > 42 mm<br />
at <strong>the</strong> base and > 35 mm at <strong>the</strong> mid level indicates RV<br />
dilatation. Similarly, longitudinal dimension > 86 mm<br />
indicates RV enlargement.<br />
RA DIMENSION. The apical 4-chamber view allows estimation <strong>of</strong> <strong>the</strong><br />
RA dimensions (Figure 3). RA area > 18 cm 2 , RA length<br />
(referred to as <strong>the</strong> major dimension) > 53 mm, and RA diameter<br />
(o<strong>the</strong>rwise known as <strong>the</strong> minor dimension) > 44<br />
mm indicate at end-diastole RA enlargement.
Journal <strong>of</strong> <strong>the</strong> American Society <strong>of</strong> Echocardiography<br />
Volume 23 Number 7<br />
Abbreviations<br />
ASE = American Society <strong>of</strong> Echocardiography<br />
AT = Acceleration time<br />
EF = Ejection fraction<br />
ET = Ejection time<br />
FAC = Fractional area change<br />
IVA = Isovolumic acceleration<br />
IVC = Inferior vena cava<br />
IVCT = Isovolumic contraction time<br />
IVRT = Isovolumic relaxation time<br />
MPI = Myocardial per<strong>for</strong>mance index<br />
MRI = Magnetic resonance imaging<br />
LV = Left ventricle<br />
PA = Pulmonary artery<br />
PADP = Pulmonary artery diastolic pressure<br />
PH = Pulmonary hypertension<br />
PLAX = Parasternal long-axis<br />
PSAX = Parasternal short-axis<br />
PVR = Pulmonary vascular resistance<br />
RA = <strong>Right</strong> atrium<br />
RIMP = <strong>Right</strong> ventricular index <strong>of</strong> myocardial per<strong>for</strong>mance<br />
RV = <strong>Right</strong> ventricle<br />
RVH = <strong>Right</strong> ventricular hypertrophy<br />
RVOT = <strong>Right</strong> ventricular outflow tract<br />
RVSP = <strong>Right</strong> ventricular systolic pressure<br />
SD = Standard deviation<br />
SPAP = Systolic pulmonary artery pressure<br />
TAM = Tricuspid annular motion<br />
TAPSE = Tricuspid annular plane systolic excursion<br />
3D = Three-dimensional<br />
TR = Tricuspid regurgitation<br />
2D = Two-dimensional<br />
RV OUTFLOW TRACT (RVOT) DIMENSION. The left PSAX view demonstrating<br />
RVOT at <strong>the</strong> level <strong>of</strong> <strong>the</strong> pulmonic valve yields <strong>the</strong> ‘‘distal<br />
diameter’’ (Figure 8C), while <strong>the</strong> left PLAX view allows <strong>for</strong> <strong>the</strong> measurement<br />
<strong>of</strong> <strong>the</strong> proximal portion <strong>of</strong> <strong>the</strong> RVOT, also referred to as<br />
‘‘proximal diameter’’ (Figure 8A). Diameter > 27 mm at end-diastole<br />
at <strong>the</strong> level <strong>of</strong> pulmonary valve insertion (‘‘distal diameter’’)<br />
indicates RVOT dilatation.<br />
RV WALL THICKNESS. RV wall thickness is measured in diastole, preferably<br />
from <strong>the</strong> subcostal view, using ei<strong>the</strong>r M-mode or two-dimensional<br />
(2D) imaging (Figure 5). Alternatively, <strong>the</strong> left parasternal<br />
view is also used <strong>for</strong> measuring RV wall thickness. Thickness > 5<br />
mm indicates RV hypertrophy (RVH) and may suggest RV<br />
pressure overload in <strong>the</strong> absence <strong>of</strong> o<strong>the</strong>r pathologies.<br />
Rudski et al 687<br />
Table 1 Summary <strong>of</strong> reference limits <strong>for</strong> recommended<br />
measures <strong>of</strong> right heart structure and function<br />
Variable Unit Abnormal Illustration<br />
Chamber dimensions<br />
RV basal diameter cm >4.2 Figure 7<br />
RV subcostal<br />
wall thickness<br />
cm >0.5 Figure 5<br />
RVOT PSAX<br />
distal diameter<br />
cm >2.7 Figure 8<br />
RVOT PLAX proximal<br />
diameter<br />
cm >3.3 Figure 8<br />
RA major dimension cm >5.3 Figure 3<br />
RA minor dimension cm >4.4 Figure 3<br />
RA end-systolic area cm 2<br />
Systolic function<br />
>18 Figure 3<br />
TAPSE cm 0.55 Figures 16 and 18<br />
FAC (%)<br />
Diastolic function<br />
% 6<br />
Deceleration time (ms) ms 50% with a sniff suggests normal RA<br />
pressure <strong>of</strong> 3 mm Hg (range, 0-5 mm Hg), whereas IVC diameter<br />
> 2.1 cm that collapses < 50% with a sniff suggests<br />
high RA pressure <strong>of</strong> 15 mm Hg (range, 10-20 mm Hg). In<br />
scenarios in which IVC diameter and collapse do not fit<br />
this paradigm, an intermediate value <strong>of</strong> 8 mm Hg (range,<br />
5-10 mm Hg) may be used or, preferably, o<strong>the</strong>r indices <strong>of</strong><br />
RA pressure should be integrated to downgrade or upgrade<br />
to <strong>the</strong> normal or high values <strong>of</strong> RA pressure. It should be noted<br />
that in normal young athletes, <strong>the</strong> IVC may be dilated in <strong>the</strong> presence<br />
<strong>of</strong> normal pressure. In addition, <strong>the</strong> IVC is commonly dilated and may<br />
not collapse in patients on ventilators, so it should not be used in such<br />
cases to estimate RA pressure.<br />
RV Systolic Function. RV systolic function has been evaluated using<br />
several parameters, namely, RIMP, TAPSE, 2D RV FAC, 2D RV<br />
ejection fraction (EF), three-dimensional (3D) RV EF, tissue<br />
Doppler–derived tricuspid lateral annular systolic velocity (S 0 ), and<br />
longitudinal strain and strain rate. Among <strong>the</strong>m, more studies have<br />
demonstrated <strong>the</strong> clinical utility and value <strong>of</strong> RIMP, TAPSE, 2D<br />
FAC, and S 0 <strong>of</strong> <strong>the</strong> tricuspid annulus. Although 3D RV EF seems to<br />
be more reliable with fewer reproducibility errors, <strong>the</strong>re are insufficient<br />
data demonstrating its clinical value at present.
688 Rudski et al Journal <strong>of</strong> <strong>the</strong> American Society <strong>of</strong> Echocardiography<br />
July 2010<br />
RIMP provides an index <strong>of</strong> global RV function. RIMP > 0.40 by<br />
pulsed Doppler and > 0.55 by tissue Doppler indicates RV dysfunction.<br />
By measuring <strong>the</strong> isovolumic contraction time (IVCT), isovolumic<br />
relaxation time (IVRT), and ejection time (ET) indices from<br />
<strong>the</strong> pulsed tissue Doppler velocity <strong>of</strong> <strong>the</strong> lateral tricuspid annulus,<br />
one avoids errors related to variability in <strong>the</strong> heart rate. RIMP can<br />
be falsely low in conditions associated with elevated RA pressures,<br />
which will decrease <strong>the</strong> IVRT.<br />
TAPSE is easily obtainable and is a measure <strong>of</strong> RV longitudinal<br />
function. TAPSE < 16 mm indicates RV systolic dysfunction. It is<br />
measured from <strong>the</strong> tricuspid lateral annulus. Although it measures<br />
longitudinal function, it has shown good correlation with techniques<br />
estimating RV global systolic function, such as radionuclide-derived<br />
RV EF, 2D RV FAC, and 2D RV EF.<br />
Two-dimensional FAC (as a percentage) provides an estimate<br />
<strong>of</strong> RV systolic function. Two-dimensional FAC < 35% indicates<br />
RV systolic dysfunction. It is important to make sure that <strong>the</strong> entire<br />
right ventricle is in <strong>the</strong> view, including <strong>the</strong> apex and <strong>the</strong> lateral wall<br />
in both systole and diastole. Care must be taken to exclude trabeculations<br />
while tracing <strong>the</strong> RV area.<br />
S 0 is easy to measure, reliable and reproducible. S 0 velocity < 10<br />
cm/s indicates RV systolic dysfunction. S 0 velocity has been shown to<br />
correlate well with o<strong>the</strong>r measures <strong>of</strong> global RV systolic function. It is<br />
important to keep <strong>the</strong> basal segment and <strong>the</strong> annulus aligned with <strong>the</strong><br />
Doppler cursor to avoid errors.<br />
RV Diastolic Dysfunction. <strong>Assessment</strong> <strong>of</strong> RV diastolic function is<br />
carried out by pulsed Doppler <strong>of</strong> <strong>the</strong> tricuspid inflow, tissue Doppler<br />
<strong>of</strong> <strong>the</strong> lateral tricuspid annulus, pulsed Doppler <strong>of</strong> <strong>the</strong> hepatic vein,<br />
and measurements <strong>of</strong> IVC size and collapsibility. Various parameters<br />
with <strong>the</strong>ir upper and lower reference ranges are shown in Table 1.<br />
Among <strong>the</strong>m, <strong>the</strong> E/A ratio, deceleration time, <strong>the</strong> E/e 0 ratio, and<br />
RA size are recommended. Note that <strong>the</strong>se parameters should be obtained<br />
at end-expiration during quiet breathing or as an average <strong>of</strong> $5<br />
consecutive beats and that <strong>the</strong>y may not be valid in <strong>the</strong> presence <strong>of</strong><br />
significant tricuspid regurgitation (TR).<br />
GRADING OF RV DIASTOLIC DYSFUNCTION. A tricuspid E/A ratio < 0.8<br />
suggests impaired relaxation, a tricuspid E/A ratio <strong>of</strong> 0.8 to 2.1<br />
with an E/e 0 ratio > 6 or diastolic flow predominance in <strong>the</strong> hepatic<br />
veins suggests pseudonormal filling, and a tricuspid E/A ratio<br />
> 2.1 with deceleration time < 120 ms suggests restrictive filling.<br />
Pulmonary Systolic Pressure/RVSP. TR velocity reliably permits<br />
estimation <strong>of</strong> RVSP with <strong>the</strong> addition <strong>of</strong> RA pressure, assuming<br />
no significant RVOT obstruction. It is recommended to use <strong>the</strong> RA<br />
pressure estimated from IVC and its collapsibility, ra<strong>the</strong>r than arbitrarily<br />
assigning a fixed RA pressure. In general, TR velocity > 2.8<br />
to 2.9 m/s, corresponding to SPAP <strong>of</strong> approximately 36<br />
mm Hg, assuming an RA pressure <strong>of</strong> 3 to 5 mm Hg, indicates<br />
elevated RV systolic and PA pressure. SPAP may increase, however,<br />
with age and in obesity. In addition, SPAP is also related to stroke volume<br />
and systemic blood pressure. Elevated SPAP may not always indicate<br />
increased pulmonary vascular resistance (PVR). In general,<br />
those who have elevated SPAP should be carefully evaluated. It is important<br />
to take into consideration that <strong>the</strong> RV diastolic function parameters<br />
and SPAP are influenced by <strong>the</strong> systolic and diastolic<br />
function <strong>of</strong> <strong>the</strong> left heart. PA pressure should be reported along<br />
with systemic blood pressure or mean arterial pressure.<br />
Because echocardiography is <strong>the</strong> first test used in <strong>the</strong> evaluation <strong>of</strong><br />
patients presenting with cardiovascular symptoms, it is important to<br />
provide basic assessment <strong>of</strong> right heart structure and function, in ad-<br />
dition to left heart parameters. In those with established right heart<br />
failure or pulmonary hypertension (PH), fur<strong>the</strong>r detailed assessment<br />
using o<strong>the</strong>r parameters such as PVR, can be carried out.<br />
OVERVIEW<br />
The right ventricle has long been neglected, yet it is RV function that is<br />
strongly associated with clinical outcomes in many conditions.<br />
Although <strong>the</strong> left ventricle has been studied extensively, with established<br />
normal values <strong>for</strong> dimensions, volumes, mass, and function,<br />
measures <strong>of</strong> RV size and function are lacking. The relatively predictable<br />
left ventricular (LV) shape and standardized imaging planes<br />
have helped establish norms in LV assessment. There are, however,<br />
limited data regarding <strong>the</strong> normal dimensions <strong>of</strong> <strong>the</strong> right ventricle,<br />
in part because <strong>of</strong> its complex shape. The right ventricle is composed<br />
<strong>of</strong> 3 distinct portions: <strong>the</strong> smooth muscular inflow (body), <strong>the</strong> outflow<br />
region, and <strong>the</strong> trabecular apical region. Volumetric quantification <strong>of</strong><br />
RV function is challenging because <strong>of</strong> <strong>the</strong> many assumptions required.<br />
As a result, many physicians rely on visual estimation to assess<br />
RV size and function.<br />
The basics <strong>of</strong> RV dimensions and function were included as part <strong>of</strong><br />
<strong>the</strong> ASE and European Association <strong>of</strong> Echocardiography recommendations<br />
<strong>for</strong> chamber quantification published in 2005. 1 This document,<br />
however, focused on <strong>the</strong> left heart, with only a small section<br />
covering <strong>the</strong> right-sided chambers. Since this publication, <strong>the</strong>re have<br />
been significant advances in <strong>the</strong> echocardiographic assessment <strong>of</strong><br />
<strong>the</strong> right heart. In addition, <strong>the</strong>re is a need <strong>for</strong> greater dissemination<br />
<strong>of</strong> details regarding <strong>the</strong> standardization <strong>of</strong> <strong>the</strong> RV echocardiographic<br />
examination.<br />
These guidelines are to be viewed as a starting point to establish<br />
a standard uni<strong>for</strong>m method <strong>for</strong> obtaining right heart images <strong>for</strong> assessing<br />
RV size and function and as an impetus <strong>for</strong> <strong>the</strong> development <strong>of</strong><br />
databases to refine <strong>the</strong> normal values. This guidelines document is<br />
not intended to serve as a detailed description <strong>of</strong> pathology affecting<br />
<strong>the</strong> right heart, although <strong>the</strong> document contains many references that<br />
describe RV pathologic conditions and how <strong>the</strong>y affect <strong>the</strong> measurements<br />
described.<br />
The purposes <strong>of</strong> this guidelines document are as follows:<br />
1. Describe <strong>the</strong> acoustic windows and echocardiographic views required <strong>for</strong><br />
optimal evaluation <strong>of</strong> <strong>the</strong> right heart.<br />
2. Describe <strong>the</strong> echocardiographic parameters required in routine and directed<br />
echocardiographic studies and <strong>the</strong> views to obtain <strong>the</strong>se parameters<br />
<strong>for</strong> assessing RV size and function.<br />
3. Critically assess <strong>the</strong> available data from <strong>the</strong> literature and present <strong>the</strong> advantages<br />
and disadvantages <strong>of</strong> each measure or technique.<br />
4. Recommend which right-sided measures should be included in <strong>the</strong> standard<br />
echocardiographic report.<br />
5. Provide revised reference values <strong>for</strong> right-sided measures with cut<strong>of</strong>f limits<br />
representing 95% confidence intervals based on <strong>the</strong> current available literature.<br />
METHODOLOGY IN THE ESTABLISHMENT OF REFERENCE<br />
VALUE AND RANGES<br />
An extensive systematic literature search was per<strong>for</strong>med to identify all<br />
studies reporting echocardiographic right heart measurements in normal<br />
subjects. These encompassed studies reporting normal reference<br />
values and, more commonly, studies reporting right heart size and
Journal <strong>of</strong> <strong>the</strong> American Society <strong>of</strong> Echocardiography<br />
Volume 23 Number 7<br />
Rudski et al 689<br />
Figure 1 Views used to per<strong>for</strong>m comprehensive evaluation <strong>of</strong> <strong>the</strong> right heart. Each view is accompanied by uses, advantages, and<br />
limitations <strong>of</strong> that particular view. Ao, aorta; ASD, atrial septal defect; CS, coronary sinus; EF, ejection fraction; EV, Eustachian valve;<br />
LA, left atrium; LV, left ventricle; MV, mitral valve; PA, pulmonary artery; PFO, patent <strong>for</strong>amen ovale; PM, papillary muscle; RA, right<br />
atrium; RV, right ventricle; RVOT, right ventricular outflow tract; U/S, ultrasound.
690 Rudski et al Journal <strong>of</strong> <strong>the</strong> American Society <strong>of</strong> Echocardiography<br />
July 2010<br />
Figure 1 continued<br />
function in patients with specific disease states (eg, chronic obstructive<br />
pulmonary disease) versus normal healthy controls. In <strong>the</strong> latter, only<br />
<strong>the</strong> control group was used in <strong>the</strong> determination <strong>of</strong> normal values. It is<br />
important to note that <strong>the</strong>se reference values are based on values obtained<br />
from normal individuals without any history <strong>of</strong> heart disease and<br />
exclude those with history <strong>of</strong> congenital heart disease. For each<br />
measurement, <strong>the</strong> mean value and standard deviation (SD) were extracted,<br />
ensuring that <strong>the</strong> technique used to obtain <strong>the</strong> measurement<br />
was comparable between studies. Individual patient data were not<br />
available and <strong>the</strong>re<strong>for</strong>e not extracted. The mean values and SDs<br />
were pooled and weighted to take into account study size and interstudy<br />
variability, as is typical <strong>for</strong> random-effects meta-analyses. The<br />
meta-analysis yielded a pooled estimate <strong>for</strong> <strong>the</strong> mean value, a pooled<br />
estimate <strong>for</strong> <strong>the</strong> lower reference value (ie, mean value 2 SDs), and<br />
a pooled estimate <strong>for</strong> <strong>the</strong> upper reference value (ie, mean value + 2<br />
SDs). In addition, 95% confidence intervals surrounding <strong>the</strong> mean<br />
and upper and lower reference values were calculated to add fur<strong>the</strong>r<br />
insight into <strong>the</strong> robustness <strong>of</strong> <strong>the</strong> reference values. Reference values<br />
were reviewed by <strong>the</strong> writing group members to ensure that <strong>the</strong>y<br />
were in accordance with clinical experience, and select measures<br />
were fur<strong>the</strong>r discussed with outside experts. Our document <strong>the</strong>re<strong>for</strong>e<br />
reports <strong>the</strong> mean values along with <strong>the</strong> upper and lower reference<br />
values in a normal population, each with 95% confidence intervals.<br />
Because patient-level data were not available, it is not possible to define<br />
cut<strong>of</strong>fs <strong>for</strong> body surface area, gender, or ethnicity. As a result,<br />
a value may fall within <strong>the</strong> 95% confidence interval <strong>for</strong> a given patient,<br />
but this value may still be abnormal <strong>for</strong> that patient, or vice versa.<br />
Similarly, patient-level data were not available to divide <strong>the</strong> abnormal<br />
categories into mild, moderate, and severe degrees <strong>of</strong> abnormality.<br />
Interpreters should <strong>the</strong>re<strong>for</strong>e use <strong>the</strong>ir judgment in determining <strong>the</strong><br />
extent <strong>of</strong> abnormality observed <strong>for</strong> any given parameter. In <strong>the</strong> rare<br />
situation in which insufficient data were available to per<strong>for</strong>m <strong>the</strong> analysis<br />
described above, but <strong>the</strong> committee believed that guidelines were<br />
required (eg, estimation <strong>of</strong> RA pressure), current data were reviewed<br />
and a consensus put <strong>for</strong>th on <strong>the</strong> basis <strong>of</strong> <strong>the</strong> best available data. Many<br />
<strong>of</strong> <strong>the</strong> values provided in this document are significantly different<br />
from those provided in <strong>the</strong> ASE’s guidelines on chamber quantification<br />
published in 2005. 1 The prior document’s normal values were<br />
<strong>of</strong>ten based on limited data, at times from a single small study.<br />
Readers are <strong>the</strong>re<strong>for</strong>e encouraged to use <strong>the</strong> normal values provided<br />
in <strong>the</strong> current document in <strong>the</strong> assessment and reporting on right<br />
heart size and function.<br />
ACOUSTIC WINDOWS AND ECHOCARDIOGRAPHIC VIEWS<br />
OF THE RIGHT HEART<br />
To differentiate normal RV structure and function from abnormal and<br />
to assess RV size, volume, and contractility, a complete set <strong>of</strong> standardized<br />
views must be obtained (Figure 1). These include PLAX, parasternal<br />
RV inflow, PSAX, apical 4-chamber, right ventricle–focused<br />
apical 4-chamber (Figure 6), and subcostal views. It is important<br />
to use all available views, because each view adds complementary<br />
in<strong>for</strong>mation, permitting a more complete assessment <strong>of</strong> <strong>the</strong> different<br />
segments <strong>of</strong> <strong>the</strong> right heart chambers. This pertains to <strong>the</strong> evaluation<br />
<strong>of</strong> both structure and function. For <strong>the</strong> estimation <strong>of</strong> RVSP, it is particularly<br />
important to interrogate TR by continuous-wave Doppler<br />
from all views, because <strong>the</strong> maximal velocity depends on optimal<br />
alignment with <strong>the</strong> jet. When <strong>the</strong>re are discrepancies in structure<br />
and function between different views, <strong>the</strong> interpreting physician<br />
must integrate all in<strong>for</strong>mation contained within <strong>the</strong> echocardiographic<br />
study to syn<strong>the</strong>size a global assessment <strong>of</strong> <strong>the</strong> right heart.<br />
Figure 1 details <strong>the</strong> standardized right heart views, along with <strong>the</strong><br />
structures identified in each view.<br />
NOMENCLATURE OF RIGHT HEART SEGMENTS AND<br />
CORONARY SUPPLY<br />
The right coronary artery is <strong>the</strong> primary coronary supply to <strong>the</strong> right<br />
ventricle via acute marginal branches. In <strong>the</strong> setting <strong>of</strong> acute myocardial<br />
infarction, in general, <strong>the</strong> more proximal <strong>the</strong> occlusion, <strong>the</strong><br />
more RV myocardium will be affected. In cases <strong>of</strong> <strong>the</strong> posterior descending<br />
artery occlusion, if <strong>the</strong>re is RV involvement, it may be limited<br />
to a portion <strong>of</strong> <strong>the</strong> RV inferior wall only, best seen in <strong>the</strong> RV<br />
inflow view. The posterior descending artery gives <strong>of</strong>f perpendicular<br />
branches. These posterior septal per<strong>for</strong>ators typically supply <strong>the</strong> posterior<br />
one third <strong>of</strong> <strong>the</strong> ventricular septal wall. 2 The blood supply to<br />
<strong>the</strong> moderator band arises from <strong>the</strong> first septal per<strong>for</strong>ating branch <strong>of</strong><br />
<strong>the</strong> left anterior descending coronary artery. This distribution <strong>of</strong><br />
blood supply may become relevant in cases <strong>of</strong> alcohol septal<br />
ablation. In 30% <strong>of</strong> hearts, <strong>the</strong> conus artery arises from a separate<br />
coronary ostium and supplies <strong>the</strong> infundibulum. It may serve as<br />
a collateral to <strong>the</strong> anterior descending artery. 3 In
print & web 4C=FPO<br />
Journal <strong>of</strong> <strong>the</strong> American Society <strong>of</strong> Echocardiography<br />
Volume 23 Number 7<br />
(2) acting as a passive conduit in early diastole when <strong>the</strong> tricuspid<br />
valve is open, and (3) acting as an active conduit in late diastole during<br />
atrial contraction. 6 To date, only a few studies have focused on <strong>the</strong><br />
role <strong>of</strong> <strong>the</strong> right atrium in disease states.<br />
RA area was a predictor <strong>of</strong> mortality or transplantation in a study <strong>of</strong><br />
25 patients with primary PH. RA dilatation was documented in patients<br />
with atrial arrhythmias by both 2D and 3D echocardiography, 7<br />
and reverse remodeling occurred following radi<strong>of</strong>requency ablation<br />
treatment <strong>of</strong> atrial fibrillation. 8<br />
The primary transthoracic window <strong>for</strong> imaging <strong>the</strong> right atrium is<br />
<strong>the</strong> apical 4-chamber view. From this window, RA area is estimated<br />
by planimetry. 5 The maximal long-axis distance <strong>of</strong> <strong>the</strong> right atrium<br />
is from <strong>the</strong> center <strong>of</strong> <strong>the</strong> tricuspid annulus to <strong>the</strong> center <strong>of</strong> <strong>the</strong> superior<br />
RA wall, parallel to <strong>the</strong> interatrial septum. A mid-RA minor distance is<br />
defined from <strong>the</strong> mid level <strong>of</strong> <strong>the</strong> RA free wall to <strong>the</strong> interatrial septum,<br />
perpendicular to <strong>the</strong> long axis. RA area is traced at <strong>the</strong> end <strong>of</strong><br />
ventricular systole (largest volume) from <strong>the</strong> lateral aspect <strong>of</strong> <strong>the</strong> tricuspid<br />
annulus to <strong>the</strong> septal aspect, excluding <strong>the</strong> area between <strong>the</strong><br />
leaflets and annulus, following <strong>the</strong> RA endocardium, excluding <strong>the</strong><br />
IVC and superior vena cava and RA appendage (Figure 3). 5 Note<br />
that RA dimensions can be distorted and falsely enlarged in patients<br />
with chest and thoracic spine de<strong>for</strong>mities.<br />
Normal values <strong>for</strong> major and minor dimensions and end-systolic<br />
area on transthoracic echocardiography are shown in Table 2.<br />
Advantages: RA dimensions and area are easily obtained on an<br />
apical 4-chamber view and are markers <strong>of</strong> RA dilatation.<br />
Disadvantages: RA area is a more time-consuming measurement<br />
than linear dimensions alone but is a better indicator <strong>for</strong> RV<br />
diastolic dysfunction.<br />
Recommendations: Images adequate <strong>for</strong> RA area estimation<br />
should be obtained in patients undergoing evaluation<br />
<strong>for</strong> RV or LV dysfunction, using an upper reference limit<br />
<strong>of</strong> 18 cm 2 . RA dimensions should be considered in all patients<br />
with significant RV dysfunction in whom image qual-<br />
Rudski et al 691<br />
Figure 2 Segmental nomenclature <strong>of</strong> <strong>the</strong> right ventricular walls, along with <strong>the</strong>ir coronary supply. Ao, Aorta; CS, coronary sinus; LA,<br />
left atrium; LAD, left anterior descending artery; LV, left ventricle; PA, pulmonary artery; RA, right atrium; RCA, right coronary artery;<br />
RV, right ventricle; RVOT, right ventricular outflow tract.<br />
ity does not permit <strong>for</strong> <strong>the</strong> measurement <strong>of</strong> RA area. Upper<br />
reference limits are 4.4 and 5.3 cm <strong>for</strong> minor-axis and<br />
major-axis dimensions, respectively (Table 2). Because <strong>of</strong><br />
<strong>the</strong> paucity <strong>of</strong> standardized RA volume data by 2D echocardiography,<br />
routine RA volume measurements are not<br />
currently recommended.<br />
RA Pressure. RA pressure is most commonly estimated by IVC diameter<br />
and <strong>the</strong> presence <strong>of</strong> inspiratory collapse. 9 As RA pressure increases,<br />
this is transmitted to <strong>the</strong> IVC, resulting in reduced collapse<br />
with inspiration and IVC dilatation. Combining <strong>the</strong>se two parameters<br />
results in a good estimation <strong>of</strong> RA pressure within a limited number <strong>of</strong><br />
ranges in a majority <strong>of</strong> patients. Traditional cut<strong>of</strong>f values <strong>for</strong> IVC diameter<br />
and collapse have recently been revisited, acknowledging that<br />
<strong>the</strong>se parameters per<strong>for</strong>m well when estimating low or high RA pressures<br />
and less well in intermediate values. 10 Secondary indices <strong>of</strong> RA<br />
pressure may be useful in such scenarios to fur<strong>the</strong>r refine estimates. In<br />
patients being ventilated using positive pressure, <strong>the</strong> degree <strong>of</strong> IVC<br />
collapse cannot be used to reliably estimate RA pressure, and RA<br />
pressure measured by transduction <strong>of</strong> a central line should be used<br />
if available. An IVC diameter # 12 mm in <strong>the</strong>se patients, however,<br />
appears accurate in identifying patients with RA pressures < 10 mm<br />
Hg. 11 In this same patient group, if <strong>the</strong> IVC is small and collapsed,<br />
this suggests hypovolemia.<br />
The subcostal view is most useful <strong>for</strong> imaging <strong>the</strong> IVC, with <strong>the</strong> IVC<br />
viewed in its long axis. 12 The measurement <strong>of</strong> <strong>the</strong> IVC diameter<br />
should be made at end-expiration and just proximal to <strong>the</strong> junction<br />
<strong>of</strong> <strong>the</strong> hepatic veins that lie approximately 0.5 to 3.0 cm proximal<br />
to <strong>the</strong> ostium <strong>of</strong> <strong>the</strong> right atrium (Figure 4). 13,14 To accurately assess<br />
IVC collapse, <strong>the</strong> change in diameter <strong>of</strong> <strong>the</strong> IVC with a sniff and<br />
also with quiet respiration should be measured, ensuring that <strong>the</strong><br />
change in diameter does not reflect a translation <strong>of</strong> <strong>the</strong> IVC into<br />
ano<strong>the</strong>r plane. 4,5,12 It may be better to view <strong>the</strong> IVC in <strong>the</strong> crosssectional<br />
view to make sure that <strong>the</strong> long-axis view is perpendicular
print & web 4C=FPO<br />
692 Rudski et al Journal <strong>of</strong> <strong>the</strong> American Society <strong>of</strong> Echocardiography<br />
July 2010<br />
Figure 3 Tracing <strong>of</strong> <strong>the</strong> right atrium (RA) is per<strong>for</strong>med from <strong>the</strong><br />
plane <strong>of</strong> <strong>the</strong> tricuspid annulus (TA), along <strong>the</strong> interatrial septum<br />
(IAS), superior and anterolateral walls <strong>of</strong> <strong>the</strong> RA. The right atrial<br />
major dimension is represented by <strong>the</strong> green line from <strong>the</strong> TA<br />
center to <strong>the</strong> superior right atrial wall, and <strong>the</strong> right atrial minor<br />
dimension is represented by <strong>the</strong> blue line from <strong>the</strong> anterolateral<br />
wall to <strong>the</strong> IAS.<br />
to it. Although a distended IVC usually denotes elevated RA pressures,<br />
in patients with o<strong>the</strong>rwise normal exam results, reassessing<br />
<strong>the</strong> IVC size and collapsibility in <strong>the</strong> left lateral position may be useful<br />
to avoid <strong>the</strong> potentially erroneous inference <strong>of</strong> increased RA filling<br />
pressure. The IVC may also be dilated in normal young athletes,<br />
and in this population, it may not reflect elevated RA pressure.<br />
Hepatic vein flow patterns provide complementary insights into<br />
RA pressure. At low or normal RA pressures, <strong>the</strong>re is systolic predominance<br />
in hepatic vein flow, such that <strong>the</strong> velocity <strong>of</strong> <strong>the</strong> systolic<br />
wave (Vs) is greater than <strong>the</strong> velocity <strong>of</strong> <strong>the</strong> diastolic wave (Vd). At<br />
elevated RA pressures, this systolic predominance is lost, such that<br />
Vs is substantially decreased and Vs/Vd is 50% with a sniff suggests a normal<br />
RA pressure <strong>of</strong> 3 mm Hg (range, 0-5 mm Hg), whereas an<br />
IVC diameter > 2.1 cm that collapses 6, and diastolic flow<br />
predominance in <strong>the</strong> hepatic veins (which can be quantified<br />
as a systolic filling fraction < 55%). In indeterminate<br />
cases, if none <strong>of</strong> <strong>the</strong>se secondary indices <strong>of</strong> elevated RA<br />
pressure are present, RA pressure may be downgraded to<br />
3 mm Hg. If <strong>the</strong>re is minimal IVC collapse with a sniff<br />
(
print & web 4C=FPO<br />
Journal <strong>of</strong> <strong>the</strong> American Society <strong>of</strong> Echocardiography<br />
Volume 23 Number 7<br />
Figure 5 Measurement <strong>of</strong> end-diastolic right ventricular wall thickness. (A) Subcostal 2-dimensional image <strong>of</strong> right ventricular wall.<br />
(B) Zoom <strong>of</strong> region outlined in (A) with right ventricular wall thickness indicated by arrows. (C) M-mode image corresponding to arrows<br />
in (B). (D) Zoom <strong>of</strong> region outlined in (C) with arrows indicating wall thickness at end-diastole.<br />
Figure 6 Diagram showing <strong>the</strong> recommended apical 4-chamber<br />
(A4C) view with focus on <strong>the</strong> right ventricle (RV) (1*) and <strong>the</strong> sensitivity<br />
<strong>of</strong> right ventricular size with angular change (2,3) despite similar<br />
size and appearance <strong>of</strong> <strong>the</strong> left ventricle (LV). The lines <strong>of</strong><br />
intersection <strong>of</strong> <strong>the</strong> A4C planes (1*,2,3) with a mid left ventricular<br />
short-axis are shown above and corresponding A4C views below.<br />
as in patients with significant LV hypertrophy, even in <strong>the</strong> absence <strong>of</strong><br />
PH. 19 RV free wall thickness can be measured at end-diastole by<br />
M-mode or 2D echocardiography from <strong>the</strong> subcostal window, preferably<br />
at <strong>the</strong> level <strong>of</strong> <strong>the</strong> tip <strong>of</strong> <strong>the</strong> anterior tricuspid leaflet or left parasternal<br />
windows. 4,16 From <strong>the</strong> subcostal view, one can align <strong>the</strong><br />
ultrasound beam perpendicular to <strong>the</strong> RV free wall. Excluding RV<br />
trabeculations and papillary muscle from RV endocardial border is<br />
critical <strong>for</strong> accurately measuring <strong>the</strong> RV wall thickness. Moving <strong>the</strong><br />
focus to <strong>the</strong> RV wall region and decreasing <strong>the</strong> depth will improve<br />
<strong>the</strong> endocardial border definition. Every ef<strong>for</strong>t must be made to<br />
exclude epicardial fat to avoid erroneously increased measurements.<br />
When image quality permits, fundamental imaging should be used<br />
to avoid <strong>the</strong> increased structure thickness seen with harmonic<br />
imaging. When <strong>the</strong>re is significant thickening <strong>of</strong> <strong>the</strong> visceral<br />
pericardium, <strong>the</strong> measurement <strong>of</strong> <strong>the</strong> RV wall may be challenging.<br />
Certain conditions are associated with RV wall thinning, such as Uhl<br />
anomaly or arrhythmogenic RV cardiomyopathy. There are no accepted<br />
echocardiographic criteria to define an abnormally thin RV wall.<br />
Advantages: RV wall thickness can be measured by M-mode or<br />
2D echocardiography from ei<strong>the</strong>r <strong>the</strong> subcostal or left parasternal<br />
window.<br />
Rudski et al 693<br />
Disadvantages: There is a lack <strong>of</strong> established prognostic in<strong>for</strong>mation.<br />
Recommendations: Abnormal RV wall thickness<br />
should be reported, if present, in patients suspected <strong>of</strong><br />
having RV and/or LV dysfunction, using <strong>the</strong> normal cut<strong>of</strong>f<br />
<strong>of</strong> 0.5 cm from ei<strong>the</strong>r PLAX or subcostal windows<br />
(Table 2).<br />
RV Linear Dimensions. The right ventricle dilates in response to<br />
chronic volume and/or pressure overload 20 and with RV failure. 21<br />
Indexed RV end-diastolic diameter has been identified as a predictor<br />
<strong>of</strong> survival in patients with chronic pulmonary disease, 22 and <strong>the</strong> RV/<br />
LVend-diastolic diameter ratio was shown to be a predictor <strong>of</strong> adverse<br />
clinical events and/or hospital survival in patients with acute pulmonary<br />
embolism. 23,24 Correlation <strong>of</strong> RV linear dimensions with RV<br />
end-diastolic volumes appears to worsen with increased preload 25<br />
or afterload. 26<br />
Using 2D echocardiography, RV size can be measured from<br />
a 4-chamber view obtained from <strong>the</strong> apical window at end-diastole.<br />
Although quantitative validation is lacking, qualitatively, <strong>the</strong> right ventricle<br />
should appear smaller than <strong>the</strong> left ventricle and usually no<br />
more than two thirds <strong>the</strong> size <strong>of</strong> <strong>the</strong> left ventricle in <strong>the</strong> standard apical<br />
4-chamber view. If <strong>the</strong> right ventricle is larger than <strong>the</strong> left ventricle in<br />
this view, it is likely significantly enlarged. This may be applied to certain<br />
conditions such as severe RV pressure or volume overload, in<br />
which <strong>the</strong> right ventricle may measure within <strong>the</strong> normal reference<br />
limits but appears larger than <strong>the</strong> small, underfilled left ventricle. In<br />
<strong>the</strong> standard transthoracic apical 4-chamber window, <strong>the</strong> left ventricle<br />
is considered <strong>the</strong> ‘‘apex-<strong>for</strong>ming’’ ventricle. As <strong>the</strong> right ventricle enlarges,<br />
it may displace <strong>the</strong> left ventricle and occupy <strong>the</strong> apex. This usually<br />
signifies that <strong>the</strong> right ventricle is at least moderately dilated,<br />
though this finding has not been validated quantitatively.<br />
One major limitation <strong>of</strong> RV imaging by transthoracic echocardiography<br />
is <strong>the</strong> result <strong>of</strong> a lack <strong>of</strong> fixed reference points to ensure optimization<br />
<strong>of</strong> <strong>the</strong> right ventricle. As a result, <strong>the</strong> imager can image <strong>the</strong> RV<br />
through various cut planes, resulting in a normal, medium, or smaller<br />
dimension (Figure 6). As a result, it is critical to attempt to adjust <strong>the</strong><br />
apical 4-chamber to acquire <strong>the</strong> ‘‘right ventricle–focused view,’’<br />
as detailed below. To optimize imaging <strong>of</strong> <strong>the</strong> RV lateral wall, <strong>the</strong><br />
4-chamber image may require adjustment from its usual attention<br />
on <strong>the</strong> left ventricle to a focus on <strong>the</strong> right ventricle. To avoid underestimating<br />
<strong>the</strong> minor distance, <strong>the</strong> transducer is rotated until <strong>the</strong> maximal<br />
plane is obtained. To avoid overestimation, <strong>the</strong> transducer must<br />
be properly positioned over <strong>the</strong> cardiac apex with <strong>the</strong> plane through
print & web 4C=FPO<br />
print & web 4C=FPO<br />
694 Rudski et al Journal <strong>of</strong> <strong>the</strong> American Society <strong>of</strong> Echocardiography<br />
July 2010<br />
Figure 7 Diagram (left) and corresponding echocardiographic apical 4-chamber image (right) showing <strong>the</strong> right ventricular (RV) basal<br />
(RVD1) and mid cavity (RVD2) RV minor dimensions and <strong>the</strong> RV longitudinal dimension (RVD3). The transducer is adjusted to focus on<br />
<strong>the</strong> RV chamber, with <strong>the</strong> goal <strong>of</strong> maximizing RV chamber size. The RV free wall is better seen in this view, also facilitating measurements<br />
<strong>for</strong> fractional area change. Reproduced from J Am Soc Echocardiogr. 1<br />
Figure 8 Measurement <strong>of</strong> right ventricular outflow tract (RVOT) dimensions at <strong>the</strong> proximal or subvalvular level (RVOT-Prox) and at<br />
<strong>the</strong> distal or pulmonic valve (RVOT-Distal) in <strong>the</strong> (A) parasternal long-axis RVOT anterior portion view, (B) basal parasternal short-axis<br />
view, and (C) parasternal short-axis <strong>of</strong> pulmonary bifurcation view. PA, Pulmonary artery dimension between valve and <strong>the</strong> bifurcation<br />
point.<br />
<strong>the</strong> left ventricle in <strong>the</strong> center <strong>of</strong> <strong>the</strong> cavity. One must ensure that <strong>the</strong><br />
RV is not <strong>for</strong>eshortened and that <strong>the</strong> LVoutflow tract is not opened up<br />
(avoid <strong>the</strong> apical 5-chamber view).<br />
The basal and mid cavity RV diameters, as well as <strong>the</strong> RV longitudinal<br />
dimension, may be obtained (Figure 7). 1 The basal diameter is<br />
generally defined as <strong>the</strong> maximal short-axis dimension in <strong>the</strong> basal<br />
one third <strong>of</strong> <strong>the</strong> right ventricle seen on <strong>the</strong> 4-chamber view. 1,25,27<br />
In <strong>the</strong> normal right ventricle, <strong>the</strong> maximal short-axis dimension is usually<br />
located in <strong>the</strong> basal one third <strong>of</strong> <strong>the</strong> ventricular cavity. 4,25 The mid<br />
cavity diameter is measured in <strong>the</strong> middle third <strong>of</strong> <strong>the</strong> right ventricle at<br />
<strong>the</strong> level <strong>of</strong> <strong>the</strong> LV papillary muscles. The longitudinal dimension is<br />
drawn from <strong>the</strong> plane <strong>of</strong> <strong>the</strong> tricuspid annulus to <strong>the</strong> RV apex.<br />
Note that RV dimensions can be distorted and falsely enlarged in<br />
patients with chest and thoracic spine de<strong>for</strong>mities.<br />
Advantages: RV linear dimensions are easily obtained on an<br />
apical 4-chamber view and are markers <strong>of</strong> RV dilatation.<br />
Disadvantages: RV dimensions are highly dependent on probe<br />
rotation by <strong>the</strong> user, which can result in an underestimation <strong>of</strong> RV<br />
width.<br />
Recommendations: Patients with echocardiographic evidence<br />
<strong>of</strong> right-sided heart disease or PH should ideally have<br />
measurements <strong>of</strong> RV basal, mid cavity, and longitudinal dimensions<br />
on a 4-chamber view. In all complete echocardiographic<br />
studies, <strong>the</strong> RV basal measurement should be<br />
reported, and <strong>the</strong> report should state <strong>the</strong> window from<br />
which <strong>the</strong> measurement was per<strong>for</strong>med (ideally <strong>the</strong> right<br />
ventricle–focused view), to permit interstudy comparisons.<br />
The relative size <strong>of</strong> <strong>the</strong> right ventricle should be compared<br />
with that <strong>of</strong> <strong>the</strong> LV to help <strong>the</strong> study interpreter determine<br />
if <strong>the</strong>re is RV dilatation, and <strong>the</strong> interpreter may report <strong>the</strong><br />
right ventricle as dilated despite measuring within <strong>the</strong> normal<br />
range, on <strong>the</strong> basis <strong>of</strong> a right ventricle appearing significantly<br />
larger than <strong>the</strong> left ventricle. The upper reference<br />
limit <strong>for</strong> <strong>the</strong> RV basal dimension is 4.2 cm(Table 2).<br />
C. RVOT<br />
The RVOT is generally considered to include <strong>the</strong> subpulmonary infundibulum,<br />
or conus, and <strong>the</strong> pulmonary valve. The subpulmonary
Journal <strong>of</strong> <strong>the</strong> American Society <strong>of</strong> Echocardiography<br />
Volume 23 Number 7<br />
Table 2 Chamber dimensions<br />
Dimension Studies n LRV (95% CI) Mean (95% CI) URV (95% CI)<br />
RV mid cavity diameter (mm) (Figure 7, RVD2) 12 400 20 (15-25) 28 (23-33) 35 (30-41)<br />
RV basal diameter (mm) (Figure 7, RVD1) 10 376 24 (21-27) 33 (31-35) 42 (39-45)<br />
RV longitudinal diameter (mm) (Figure 7, RVD3) 12 359 56 (50-61) 71 (67-75) 86 (80-91)<br />
RV end-diastolic area (cm 2 )(Figure 9) 20 623 10 (8-12) 18 (16-19) 25 (24-27)<br />
RV end-systolic area (cm 2 )(Figure 9) 16 508 4 (2-5) 9 (8-10) 14 (13-15)<br />
RV end-diastolic volume indexed (mL/m 2 ) 3 152 44 (32-55) 62 (50-73) 80 (68-91)<br />
RV end-systolic volume indexed (mL/m 2 ) 1 91 19 (17-21) 33 (31-34) 46 (44-49)<br />
3D RV end-diastolic volume indexed (mL/m 2 ) 5 426 40 (28-52) 65 (54-76) 89 (77-101)<br />
3D RV end-systolic volume indexed (mL/m 2 ) 4 394 12 (1-23) 28 (18-38) 45 (34-56)<br />
RV subcostal wall thickness (mm) (Figure 5) 4 180 4 (3-4) 5 (4-5) 5 (5-6)<br />
RVOT PLAX wall thickness (mm) (not shown) 9 302 2 (1-2) 3 (3-4) 5 (4-6)<br />
RVOT PLAX diameter (mm) (Figure 8) 12 405 18 (15-20) 25 (23-27) 33 (30-35)<br />
RVOT proximal diameter (mm) (Figure 8, RVOT-Prox) 5 193 21 (18-25) 28 (27-30) 35 (31-39)<br />
RVOT distal diameter (mm) (Figure 8, RVOT-Distal) 4 159 17 (12-22) 22 (17-26) 27 (22-32)<br />
RA major dimension (mm) (Figure 3) 8 267 34 (32-36) 44 (43-45) 53 (51-55)<br />
RA minor dimension (mm) (Figure 3) 16 715 26 (24-29) 35 (33-37) 44 (41-46)<br />
RA end-systolic area (cm 2 )(Figure 3) 8 293 10 (8-12) 14 (14-15) 18 (17-20)<br />
CI, Confidence interval; LRV, lower reference value; PLAX, parasternal long-axis; RA, right atrial; RV, right ventricular; RVD, right ventricular diameter;<br />
RVOT, right ventricular outflow tract; 3D, three-dimensional; URV, upper reference value.<br />
Table 3 Estimation <strong>of</strong> RA pressure on <strong>the</strong> basis <strong>of</strong> IVC diameter and collapse<br />
Variable Normal (0-5 [3] mm Hg) Intermediate (5-10 [8] mm Hg) High (15 mm Hg)<br />
IVC diameter #2.1 cm #2.1 cm >2.1 cm >2.1 cm<br />
Collapse with sniff >50% 50% 6<br />
Diastolic flow predominance in hepatic<br />
veins (systolic filling fraction < 55%)<br />
Ranges are provided <strong>for</strong> low and intermediate categories, but <strong>for</strong> simplicity, midrange values <strong>of</strong> 3 mm Hg <strong>for</strong> normal and 8 mm Hg <strong>for</strong> intermediate<br />
are suggested. Intermediate (8 mm Hg) RA pressures may be downgraded to normal (3 mm Hg) if no secondary indices <strong>of</strong> elevated RA pressure are<br />
present, upgraded to high if minimal collapse with sniff (
print & web 4C=FPO<br />
696 Rudski et al Journal <strong>of</strong> <strong>the</strong> American Society <strong>of</strong> Echocardiography<br />
July 2010<br />
Figure 9 Examples <strong>of</strong> right ventricular fractional area change (FAC). Percentage FAC = 100 end-diastolic area (AreaED) endsystolic<br />
area (Area ES)/end-diastolic area. The endocardial border is traced in apical 4-chamber (A4C) views from <strong>the</strong> tricuspid annulus<br />
along <strong>the</strong> free wall to <strong>the</strong> apex, <strong>the</strong>n back to <strong>the</strong> annulus, along <strong>the</strong> interventricular septum at end-diastole (ED) and end-systole<br />
(ES). Trabeculation, tricuspid leaflets, and chords are included in <strong>the</strong> chamber. (Left) Normal subject, FAC 60%. (Middle) Moderately<br />
dilated right ventricle (RV), FAC 40%, and a markedly dilated left ventricle (LV). (<strong>Right</strong>) Dilated RV, FAC 20%, and <strong>the</strong> LV is <strong>for</strong>eshortened<br />
as a result <strong>of</strong> optimizing <strong>the</strong> view <strong>for</strong> <strong>the</strong> right ventricular chamber.<br />
Table 4 Systolic function<br />
Variable Studies n LRV (95% CI) Mean (95% CI) URV (95% CI)<br />
TAPSE (mm) (Figure 17) 46 2320 16 (15-18) 23 (22-24) 30 (29-31)<br />
Pulsed Doppler velocity at <strong>the</strong> annulus (cm/s) 43 2139 10 (9-11) 15 (14-15) 19 (18-20)<br />
Color Doppler velocities at <strong>the</strong> annulus (cm/s) 5 281 6 (5-7) 10 (9-10) 14 (12-15)<br />
Pulsed Doppler MPI (Figures 16 and 18) 17 686 0.15 (0.10-0.20) 0.28 (0.24-0.32) 0.40 (0.35-0.45)<br />
Tissue Doppler MPI (Figure 18) 8 590 0.24 (0.16-0.32) 0.39 (0.34-0.45) 0.55 (0.47-0.63)<br />
FAC (%) (Figure 8) 36 1276 35 (32-38) 49 (47-51) 63 (60-65)<br />
RV EF (%) (Figure 8) 12 596 44 (38-50) 58 (53-63) 71 (66-77)<br />
3D RV EF (%) 9 524 44 (39-49) 57 (53-61) 69 (65-74)<br />
IVA (m/s 2 ) 12 389 2.2 (1.4-3.0) 3.7 (3.0-4.4) 5.2 (4.4-5.9)<br />
CI, Confidence interval; EF, ejection fraction; FAC, fractional area change; IVA, isovolumic acceleration; LRV, lower reference value; MPI, myocardial<br />
per<strong>for</strong>mance index; RV,rightventricular;TAPSE, tricuspid annular plane systolic excursion; 3D, three-dimensional; URV, upper reference value.<br />
pulmonary annulus, is <strong>the</strong> most reproducible and should<br />
be generally used. For select cases such as suspected arrhythmogenic<br />
RV cardiomyopathy, <strong>the</strong> PLAX measure<br />
may be added. The upper reference limit <strong>for</strong> <strong>the</strong> PSAX<br />
distal RVOT diameter is 27 mm and <strong>for</strong> PLAX is 33<br />
mm (Table 2).<br />
FRACTIONAL AREA CHANGE AND VOLUMETRIC<br />
ASSESSMENT OF THE RIGHT VENTRICLE<br />
A. RV Area and FAC<br />
The percentage RV FAC, defined as (end-diastolic area end-systolic<br />
area)/end-diastolic area 100, is a measure <strong>of</strong> RV systolic function<br />
that has been shown to correlate with RV EF by magnetic resonance<br />
imaging (MRI). 25,35 RV FAC was found to be an independent<br />
predictor <strong>of</strong> heart failure, sudden death, stroke, and/or mortality in<br />
studies <strong>of</strong> patients after pulmonary embolism 36 and myocardial infarction.<br />
37,38 FAC is obtained by tracing <strong>the</strong> RV endocardium both<br />
in systole and diastole from <strong>the</strong> annulus, along <strong>the</strong> free wall to <strong>the</strong><br />
apex, and <strong>the</strong>n back to <strong>the</strong> annulus, along <strong>the</strong> interventricular<br />
septum. Care must be taken to trace <strong>the</strong> free wall beneath <strong>the</strong><br />
trabeculations (Figure 9).<br />
Recommendations: Two-dimensional Fractional Area<br />
Change is one <strong>of</strong> <strong>the</strong> recommended methods <strong>of</strong> quantitatively<br />
estimating RV function, with a lower reference value<br />
<strong>for</strong> normal RV systolic function <strong>of</strong> 35%.<br />
B. Two-Dimensional Volume and EF Estimation<br />
The complexity <strong>of</strong> estimating RV volume and function with 2D echocardiography<br />
has been well documented, and interested readers are<br />
referred to reviews <strong>for</strong> a more complete discussion. 29,39,40 In brief,<br />
<strong>the</strong> 2D echocardiographic methods <strong>of</strong> calculating RV volume can<br />
be divided into area-length methods, disk summation methods, and<br />
o<strong>the</strong>r methods.<br />
The area-length methods, initially adopted <strong>for</strong> biplane angiography,<br />
require an approximation <strong>of</strong> RV geometry, most commonly<br />
based on modified pyramidal or ellipsoidal models. 39,41,42 It<br />
underestimates MRI-derived RV volume and is inferior in comparison<br />
with 3D echocardiographic methods <strong>of</strong> RV volume estimation. 43<br />
The disk summation method has also been applied to determine<br />
a RV ‘‘body’’ volume, using predominantly <strong>the</strong> apical 4-chamber<br />
view. 44 RV volumes are <strong>the</strong>re<strong>for</strong>e underestimated because <strong>of</strong> <strong>the</strong> exclusion<br />
<strong>of</strong> <strong>the</strong> RVOT and technical limitations <strong>of</strong> <strong>the</strong> echocardiographic<br />
images.<br />
RV EF from 2D methods is calculated as (end-diastolic volume<br />
end-systolic volume)/end-diastolic volume. The lower reference limit
Journal <strong>of</strong> <strong>the</strong> American Society <strong>of</strong> Echocardiography<br />
Volume 23 Number 7<br />
<strong>of</strong> pooled studies using <strong>the</strong>se methods <strong>for</strong> <strong>the</strong> measurement <strong>of</strong> RV EF<br />
is 44%, with a 95% confidence interval <strong>of</strong> 38% to 50% (Table 4).<br />
Recommendations: Two dimensionally derived estimation<br />
<strong>of</strong> RV EF is not recommended, because <strong>of</strong> <strong>the</strong> heterogeneity<br />
<strong>of</strong> methods and <strong>the</strong> numerous geometric<br />
assumptions.<br />
C. Three-Dimensional Volume Estimation<br />
The accuracy <strong>of</strong> RV volumes on 3D echocardiography has been<br />
validated against animal specimens, 45,46 animal cast models <strong>of</strong><br />
<strong>the</strong> right ventricle, 46-48 and human intraoperative RV volume<br />
measurements. 49 At present, <strong>the</strong> disk summation and apical<br />
rotational methods <strong>for</strong> RV volume and EF calculation are most commonly<br />
used in 3D echocardiography. Images may be acquired by<br />
transesophageal echocardiography 49-51 as well as transthoracic<br />
echocardiography. The methodology is complex and beyond <strong>the</strong><br />
scope <strong>of</strong> this document, and interested readers are referred to<br />
a recent report by Horton et al 52 <strong>for</strong> a discussion <strong>of</strong> methodology.<br />
Compared in vitro, <strong>the</strong> 3D apical rotational method was most accurate<br />
when $8 equiangular planes were analyzed. 46 Threedimensional<br />
apical rotation using 8 imaging planes provided similar<br />
results to <strong>the</strong> 3D disk summation method in a mixed adult patient<br />
group. 53 In a variety <strong>of</strong> clinical settings, both methods have shown<br />
to correlate well with MRI-derived RV volumes in children 54-56 and<br />
adults. 51,57-63<br />
With 3D echocardiography, <strong>the</strong>re is less underestimation <strong>of</strong> RV<br />
end-diastolic and end-systolic volumes and improved test-retest variability<br />
compared with 2D echocardiography. 43,60 Pooled data from<br />
several small studies and one larger study 64 indicate that <strong>the</strong> upper<br />
reference limit <strong>for</strong> indexed RV end-diastolic volume is 89 mL/m 2<br />
and <strong>for</strong> end-systolic volume is 45 mL/m 2 , with indexed volumes being<br />
10% to 15% lower in women than in men (Table 2). The lower<br />
reference limit <strong>for</strong> RV EF is 44% (Table 4).<br />
Rudski et al 697<br />
Figure 10 Serial stop-frame short-axis two-dimensional echocardiographic images <strong>of</strong> <strong>the</strong> left ventricle at <strong>the</strong> mitral chordal level with<br />
diagrams from a patient with isolated right ventricular (RV) pressure overload due to primary pulmonary hypertension (left) and from<br />
a patient with isolated RV volume overload due to tricuspid valve resection (right). Whereas <strong>the</strong> left ventricular (LV) cavity maintains<br />
a circular pr<strong>of</strong>ile throughout <strong>the</strong> cardiac cycle in normal subjects, in RV pressure overload <strong>the</strong>re is leftward ventricular septal (VS) shift<br />
and reversal <strong>of</strong> septal curvature present throughout <strong>the</strong> cardiac cycle with most marked distortion <strong>of</strong> <strong>the</strong> left ventricle at end-systole.<br />
In <strong>the</strong> patient with RV volume overload, <strong>the</strong> septal shift and flattening <strong>of</strong> VS curvature occurs predominantly in mid to late diastole with<br />
relative sparing <strong>of</strong> LV de<strong>for</strong>mation at end-systole. Reproduced with permission from J Am Coll Cardiol. 69<br />
Advantages: RV volumes and EF may be accurately measured by<br />
3D echocardiography using validated real-time 3D algorithms.<br />
Disadvantages: Limited normative data are available, with studies<br />
using different methods and small numbers <strong>of</strong> subjects. RV volumes<br />
by both 2D and 3D echocardiography tend to underestimate<br />
MRI-derived RV volumes, although 3D methods are more accurate.<br />
Moreover, <strong>the</strong> 3D disk summation method is a relatively timeconsuming<br />
measurement to make. Finally, fewer data are available<br />
in significantly dilated or dysfunctional ventricles, making <strong>the</strong> accuracy<br />
<strong>of</strong> 3D volumes and EFs less certain.<br />
Recommendations: In studies in selected patients with<br />
RV dilatation or dysfunction, 3D echocardiography using<br />
<strong>the</strong> disk summation method may be used to report RV<br />
EFs. A lower reference limit <strong>of</strong> 44% has been obtained<br />
from pooled data. Until more studies are published, it<br />
may be reasonable to reserve 3D methods <strong>for</strong> serial volume<br />
and EF determinations.<br />
THE RIGHT VENTRICLE AND INTERVENTRICULAR SEPTAL<br />
MORPHOLOGY<br />
Chronic dilatation <strong>of</strong> <strong>the</strong> right ventricle such as may occur with isolated<br />
RV volume overload (eg, TR) results in progressive leng<strong>the</strong>ning<br />
<strong>of</strong> <strong>the</strong> base to apex as well as <strong>the</strong> free wall to septum dimensions <strong>of</strong><br />
<strong>the</strong> right ventricle, with <strong>the</strong> RV apex progressively replacing <strong>the</strong> left<br />
ventricle as <strong>the</strong> true apex <strong>of</strong> <strong>the</strong> heart. In <strong>the</strong> PSAX, <strong>the</strong> left ventricle<br />
assumes a progressively more D-shaped cavity as <strong>the</strong> ventricular septum<br />
flattens and progressively loses its convexity with respect to <strong>the</strong><br />
center <strong>of</strong> <strong>the</strong> RV cavity during diastole. 65-67 RV pressure overload<br />
also distorts <strong>the</strong> normal circular short-axis geometry <strong>of</strong> <strong>the</strong> left ventricle<br />
by shifting <strong>the</strong> septum leftward away from <strong>the</strong> center <strong>of</strong> <strong>the</strong> right<br />
ventricle and toward <strong>the</strong> center <strong>of</strong> <strong>the</strong> left ventricle, resulting in
print & web 4C=FPO<br />
698 Rudski et al Journal <strong>of</strong> <strong>the</strong> American Society <strong>of</strong> Echocardiography<br />
July 2010<br />
Figure 11 Doppler echocardiographic determination <strong>of</strong> systolic<br />
pulmonary artery pressure (SPAP). Spectral continuous-wave<br />
Doppler signal <strong>of</strong> tricuspid regurgitation corresponding to <strong>the</strong><br />
right ventricular (RV)–right atrial (RA) pressure gradient. SPAP<br />
was calculated as <strong>the</strong> sum <strong>of</strong> <strong>the</strong> estimated RA pressure (RAP)<br />
and <strong>the</strong> peak pressure gradient between <strong>the</strong> peak right ventricle<br />
and <strong>the</strong> right atrium, as estimated by application <strong>of</strong> <strong>the</strong> modified<br />
Bernoulli equation to peak velocity represented by <strong>the</strong> tricuspid<br />
regurgitation Doppler signal. In this example, SPAP is estimated<br />
at 31 + central venous pressure, or 34 mm Hg, if RAP is assumed<br />
to be 3 mm Hg. Adapted with permission from J Am Soc Echocardiogr.<br />
52<br />
flattening <strong>of</strong> <strong>the</strong> ventricular septum and a D-shaped short-axis LV cavity<br />
pr<strong>of</strong>ile predominantly during systole. This relationship between<br />
<strong>the</strong> left ventricle and right ventricle can be quantitated on <strong>the</strong> basis<br />
<strong>of</strong> <strong>the</strong> ratio between <strong>the</strong> LV anteroposterior dimension and <strong>the</strong> <strong>the</strong><br />
septolateral dimension. This ‘‘eccentricity index’’ is abnormal and suggests<br />
RV overload when this ratio is >1.0. 68 The configuration <strong>of</strong> <strong>the</strong><br />
interventricular septum is dependent on <strong>the</strong> relative pressure gradient<br />
between <strong>the</strong> right ventricle and left ventricle at each stage <strong>of</strong> <strong>the</strong> cardiac<br />
cycle. Because <strong>the</strong> majority <strong>of</strong> RV pressure overload conditions in<br />
adults arise secondary to <strong>the</strong> effects <strong>of</strong> elevation in LV filling pressure,<br />
<strong>the</strong> analysis <strong>of</strong> ventricular septal geometry and interaction is complicated<br />
by <strong>the</strong> superimposition <strong>of</strong> systolic RV pressure overload and<br />
diastolic LV pressure overload in <strong>the</strong>se patients. 69<br />
A. Differential Timing <strong>of</strong> Geometric Distortion in RV Pressure<br />
and Volume Overload States<br />
Differences in <strong>the</strong> timing <strong>of</strong> ventricular septal motion have been<br />
measured with Doppler tissue imaging and M-mode echocardiography<br />
(Figure 10). 70 Although patients with relatively isolated RV volume<br />
overload have <strong>the</strong> most marked shift <strong>of</strong> <strong>the</strong> ventricular septum<br />
away from <strong>the</strong> center <strong>of</strong> <strong>the</strong> right ventricle at end-diastole (with relatively<br />
more normal septal geometry at end-systole), patients with<br />
relatively isolated RV pressure overload have leftward septal shift<br />
away from <strong>the</strong> center <strong>of</strong> <strong>the</strong> right ventricle at both end-systole<br />
and end-diastole, with <strong>the</strong> most marked de<strong>for</strong>mation at endsystole.<br />
In selected patient populations such as PA hypertension,<br />
<strong>the</strong> ventricular septal eccentricity index and its timing can be<br />
quantitated to provide prognostic in<strong>for</strong>mation that tracks clinical<br />
responses to effective <strong>the</strong>rapies. 71,72 Analysis <strong>of</strong> septal motion is<br />
best per<strong>for</strong>med in <strong>the</strong> absence <strong>of</strong> significant conduction delays,<br />
particularly left bundle branch block.<br />
Recommendations: Visual assessment <strong>of</strong> ventricular septal<br />
curvature looking <strong>for</strong> a D-shaped pattern in systole and<br />
diastole should be used to help in <strong>the</strong> diagnosis <strong>of</strong> RV volume<br />
and/or pressure overload. Although a D-shaped septum<br />
is not diagnostic in RV overload, with its presence,<br />
additional emphasis should be placed on <strong>the</strong> confirmation,<br />
as well as determination, <strong>of</strong> <strong>the</strong> etiology and severity <strong>of</strong><br />
right-sided pressure and/or volume overload.<br />
HEMODYNAMIC ASSESSMENT OF THE RIGHT VENTRICLE<br />
AND PULMONARY CIRCULATION<br />
A. Systolic Pulmonary Artery Pressure<br />
SPAP can be estimated using TR velocity, and PADP can be estimated<br />
from <strong>the</strong> end-diastolic pulmonary regurgitation velocity. Mean PA<br />
pressure can be estimated by <strong>the</strong> PA acceleration time (AT) or derived<br />
from <strong>the</strong> systolic and diastolic pressures.<br />
RVSP can be reliably determined from peak TR jet velocity, using<br />
<strong>the</strong> simplified Bernoulli equation and combining this value with an estimate<br />
<strong>of</strong> <strong>the</strong> RA pressure: RVSP = 4(V) 2 + RA pressure, where V is<br />
<strong>the</strong> peak velocity (in meters per second) <strong>of</strong> <strong>the</strong> tricuspid valve regurgitant<br />
jet, and RA pressure is estimated from IVC diameter and respiratory<br />
changes as described above. In <strong>the</strong> absence <strong>of</strong> a gradient <strong>of</strong><br />
across <strong>the</strong> pulmonic valve or RVOT, SPAP is equal to RVSP. In cases<br />
in which RVSP is elevated, obstruction at <strong>the</strong> level <strong>of</strong> <strong>the</strong> RVOTor pulmonic<br />
valve should be excluded, especially in patients with congenital<br />
heart disease or post-pulmonic valve surgery. The simplified Bernoulli<br />
equation may occasionally underestimate <strong>the</strong> RV-RA gradient because<br />
<strong>of</strong> its neglect <strong>of</strong> <strong>the</strong> inertial component <strong>of</strong> <strong>the</strong> complete<br />
Bernoulli equation. Because velocity measurements are angle dependent,<br />
it is recommended to ga<strong>the</strong>r TR signals from several windows<br />
and to use <strong>the</strong> signal with <strong>the</strong> highest velocity.<br />
Technically adequate signals with well-defined borders can be obtained<br />
in <strong>the</strong> majority <strong>of</strong> patients. It is recommended that Doppler<br />
sweep speeds <strong>of</strong> 100 mm/s be used <strong>for</strong> all tracings. If <strong>the</strong> signal is<br />
weak, it may be enhanced with agitated saline or blood-saline contrast,<br />
but it is important to avoid overestimation <strong>of</strong> <strong>the</strong> spectral envelope<br />
by ensuring that only <strong>the</strong> well-defined, dense spectral pr<strong>of</strong>ile is<br />
measured. This is important both with and without contrast<br />
(Figure 12).<br />
The normal cut<strong>of</strong>f value <strong>for</strong> invasively measured mean PA pressure<br />
is 25 mmHg. In <strong>the</strong> echocardiography laboratory, SPAP is more commonly<br />
measured and reported. Normal resting values are usually defined<br />
as a peak TR gradient <strong>of</strong> #2.8 to 2.9 m/s or a peak systolic<br />
pressure <strong>of</strong> 35 or 36 mm Hg, assuming an RA pressure <strong>of</strong> 3 to 5<br />
mm Hg. 73 This value may increase with age and increasing body surface<br />
area and this should be considered when estimations are at <strong>the</strong><br />
upper limits <strong>of</strong> normal. 74,75 The most recent American College <strong>of</strong><br />
Cardiology Foundation and American <strong>Heart</strong> Association expert<br />
consensus document on PH recommends fur<strong>the</strong>r evaluation <strong>of</strong><br />
patients with dyspnea with estimated RVSP > 40 mm Hg. 76 Some<br />
cardiologists who care <strong>for</strong> patients with congenital heart disease will<br />
consider SPAP greater than two thirds <strong>of</strong> <strong>the</strong> systemic blood pressure<br />
as indicative <strong>of</strong> severe PH.<br />
Determination <strong>of</strong> SPAP by <strong>the</strong> sum <strong>of</strong> peak RV-RA gradient and<br />
RA pressure has been established as a reliable method since <strong>the</strong> publication<br />
by Yock and Popp 77 in 1984 and has been proven by o<strong>the</strong>r<br />
studies, 78 but additional studies have questioned <strong>the</strong> accuracy <strong>of</strong>
print & web 4C=FPO<br />
Journal <strong>of</strong> <strong>the</strong> American Society <strong>of</strong> Echocardiography<br />
Volume 23 Number 7<br />
this relationship, particularly at higher PA pressures. 79,80 In patients<br />
with very severe TR, <strong>the</strong> Doppler envelope may be cut <strong>of</strong>f because<br />
<strong>of</strong> an early equalization <strong>of</strong> RV and RA pressures, and <strong>the</strong> simplified<br />
Bernoulli equation may underestimate <strong>the</strong> RV-RA gradient.<br />
B. PA Diastolic Pressure<br />
PADP can be estimated from <strong>the</strong> velocity <strong>of</strong> <strong>the</strong> end-diastolic pulmonary<br />
regurgitant jet using <strong>the</strong> modified Bernoulli equation: [PADP = 4<br />
(end-diastolic pulmonary regurgitant velocity) 2 + RA pressure].<br />
C. Mean PA Pressure<br />
Once systolic and diastolic pressures are known, mean pressure may<br />
be estimated by <strong>the</strong> standard <strong>for</strong>mula mean PA pressure = 1/3(SPAP)<br />
+ 2/3(PADP). Mean PA pressure may also be estimated by using pulmonary<br />
AT measured by pulsed Doppler <strong>of</strong> <strong>the</strong> pulmonary artery in<br />
systole, whereby mean PA pressure = 79 (0.45 AT). 81 The<br />
same group also found that in patients with ATs < 120 ms, <strong>the</strong> <strong>for</strong>mula<br />
<strong>for</strong> mean PA pressure is 90 (0.62 AT) per<strong>for</strong>med better. 82<br />
Generally, <strong>the</strong> shorter <strong>the</strong> AT (measured from <strong>the</strong> onset <strong>of</strong> <strong>the</strong> Q<br />
wave on electrocardiography to <strong>the</strong> onset <strong>of</strong> peak pulmonary flow velocity),<br />
<strong>the</strong> higher <strong>the</strong> PVR and hence <strong>the</strong> PA pressure, provided <strong>the</strong><br />
heart rate is in <strong>the</strong> normal range <strong>of</strong> 60 to 35 to 40 mm Hg,<br />
stronger scrutiny may be warranted to determine if PH is<br />
present, factoring in o<strong>the</strong>r clinical in<strong>for</strong>mation.<br />
D. Pulmonary Vascular Resistance<br />
An elevation in SPAP does not always imply an increased PVR, as can<br />
be seen from <strong>the</strong> relationship whereby Dpressure = flow resistance.<br />
PVR distinguishes elevated pulmonary pressure due to high flow from<br />
that due to pulmonary vascular disease. PVR plays an important role<br />
in patients with heart failure with regard to transplantation eligibility.<br />
PVR can be estimated using a simple ratio <strong>of</strong> peak TR velocity (in meters<br />
per second) to <strong>the</strong> RVOT velocity-time integral (in centimeters).<br />
87-89 This relationship is not reliable in patients with very high<br />
PVR, with measured PVR > 8 Wood units, as determined by<br />
invasive hemodynamic measurement. 90 One <strong>of</strong> <strong>the</strong> methods to<br />
determine PVR is illustrated in Figure 14.<br />
A normal invasively measured PVR is 3 Wood units (240 dynes $ cm/s 2 ).<br />
Recommendation: The estimation <strong>of</strong> PVR is not adequately<br />
established to be recommended <strong>for</strong> routine use<br />
but may be considered in subjects in whom pulmonary systolic<br />
pressure may be exaggerated by high stroke volume or<br />
misleadingly low (despite increased PVR) by reduced<br />
stroke volume. The noninvasive estimation <strong>of</strong> PVR should<br />
not be used as a substitute <strong>for</strong> <strong>the</strong> invasive evaluation <strong>of</strong><br />
PVR when this value is important to guide <strong>the</strong>rapy.<br />
E. Measurement <strong>of</strong> PA Pressure During Exercise<br />
In normal subjects, exercise increases <strong>the</strong> stroke volume while <strong>the</strong><br />
PVR decreases. Normal values are defined by SPAP < 43 mm Hg during<br />
exercise. 91 In well-trained athletes or those aged >55 years, SPAP<br />
as high as 55 to 60 mm Hg at peak exercise is encountered. 92 A pulmonary<br />
hypertensive response during exercise can be clinically important<br />
in several conditions, including valvular heart disease, heart<br />
failure, 93 and PH. 94,95 From <strong>the</strong> pathophysiologic viewpoint, on <strong>the</strong>
print & web 4C=FPO<br />
700 Rudski et al Journal <strong>of</strong> <strong>the</strong> American Society <strong>of</strong> Echocardiography<br />
July 2010<br />
Figure 13 Doppler echocardiographic determination <strong>of</strong> pulmonary<br />
artery (PA) diastolic pressure (PADP) and mean PA<br />
pressure by continuous-wave Doppler signal <strong>of</strong> pulmonic<br />
regurgitation. Point 1 denotes <strong>the</strong> maximal PI velocity at <strong>the</strong> beginning<br />
<strong>of</strong> diastole. Mean PA pressure correlates with 4 (early<br />
PI velocity) 2 + estimated RAP, in this example 37 mm Hg + RAP.<br />
Point 2 marks <strong>the</strong> PI velocity at end-diastole. PADP is correlated<br />
with 4 (end PI velocity) 2 + estimated RAP. In this example,<br />
PADP is 21 mm Hg + RAP.<br />
basis <strong>of</strong> <strong>the</strong> fundamental equation <strong>of</strong> flow (F = DP/R), <strong>the</strong> abnormal<br />
exercise-induced increase in pressure can be ascribed to supranormal<br />
cardiac output (eg, in athletes) or to a normal increase in flow but<br />
a rise in resistance due to limited capability <strong>of</strong> <strong>the</strong> pulmonary vascular<br />
bed (eg, in chronic obstructive pulmonary disease or congenital heart<br />
disease). In this setting, <strong>the</strong> ratio <strong>of</strong> Dpressure (estimated by TR velocity)<br />
to flow (estimated by <strong>the</strong> RVOT time-velocity integral) may be<br />
helpful to distinguish whe<strong>the</strong>r <strong>the</strong> increased pressure is related to<br />
an increase in flow or in resistance. 96<br />
Recommendation: In patients with dyspnea <strong>of</strong> unknown<br />
etiology, with normal resting echocardiographic results<br />
and no evidence <strong>of</strong> coronary artery disease, it is reasonable<br />
to per<strong>for</strong>m stress echocardiography to assess stress-induced<br />
PH. This technique should be considered as well in subjects<br />
with conditions associated with PA hypertension. Supine<br />
bicycle exercise is <strong>the</strong> preferred method <strong>for</strong> SPAP measurement.<br />
An upper limit <strong>of</strong> 43 mm Hg should be used in patients<br />
at nonextreme workloads. In subjects with valvular<br />
heart disease, <strong>the</strong> American College <strong>of</strong> Cardiology and<br />
American <strong>Heart</strong> Association cut<strong>of</strong>fs should be used to<br />
help guide management.<br />
NONVOLUMETRIC ASSESSMENT OF RIGHT VENTRICULAR<br />
FUNCTION<br />
Determination <strong>of</strong> RV systolic function is similar to that <strong>of</strong> <strong>the</strong> left ventricle,<br />
albeit more challenging. The right ventricle has superficial circumferential<br />
muscle fibers responsible <strong>for</strong> its inward bellows<br />
movement, as well as inner longitudinal fibers that result in <strong>the</strong><br />
base-to-apex contraction. 20 Compared with <strong>the</strong> left ventricle, <strong>the</strong><br />
base-to-apex shortening assumes a greater role in RV emptying.<br />
Global assessment <strong>of</strong> RV function includes <strong>the</strong> myocardial per<strong>for</strong>mance<br />
index (MPI), RV dP/dt, RV EF, and FAC (see above). Regional<br />
approaches include tissue Doppler–derived and 2D strain, Dopplerderived<br />
systolic velocities <strong>of</strong> <strong>the</strong> annulus (S 0 ), and TAPSE. Each<br />
method is affected by <strong>the</strong> same limitations from <strong>the</strong> corresponding<br />
left-sided techniques. The RV EF may not represent RV contractility<br />
in <strong>the</strong> setting <strong>of</strong> significant TR, just as <strong>the</strong> LV EF is limited by mitral regurgitation.<br />
For S 0 and TAPSE, <strong>the</strong> regional velocities or displacement<br />
<strong>of</strong> <strong>the</strong> myocardium in a single segment may not truly represent <strong>the</strong><br />
function <strong>of</strong> <strong>the</strong> entire right ventricle. Regional strain measurements<br />
are plagued by <strong>the</strong> same issues, as well as that <strong>of</strong> poor reproducibility.<br />
There is a lack <strong>of</strong> outcomes data relating to quantification <strong>of</strong> RV systolic<br />
function. None<strong>the</strong>less, each <strong>of</strong> <strong>the</strong> methods is described below,<br />
reference values are displayed, and recommendations <strong>for</strong> measurements<br />
are proposed.<br />
A. Global <strong>Assessment</strong> <strong>of</strong> RV Systolic Function<br />
RV dP/dt. The rate <strong>of</strong> pressure rise in <strong>the</strong> ventricles (dP/dt) is an<br />
invasive measurement developed and validated as an index <strong>of</strong><br />
ventricular contractility or systolic function. It was initially described<br />
by Gleason and Braunwald 97 in 1962 in both <strong>the</strong> left<br />
and right ventricles.<br />
Although less studied and more sparsely used than <strong>for</strong> <strong>the</strong> left ventricle,<br />
RV dP/dt can also be accurately estimated from <strong>the</strong> ascending<br />
limb <strong>of</strong> <strong>the</strong> TR continuous-wave Doppler signal. 98,99 RV dP/dt is<br />
commonly calculated by measuring <strong>the</strong> time required <strong>for</strong> <strong>the</strong> TR jet<br />
to increase in velocity from 1 to 2 m/s. Using <strong>the</strong> simplified<br />
Bernoulli equation, this represents a 12 mm Hg increase in<br />
pressure. The dP/dt is <strong>the</strong>re<strong>for</strong>e calculated as 12 mm Hg divided by<br />
this time (in seconds), yielding a value in millimeters <strong>of</strong> mercury per<br />
second. Although <strong>the</strong> time from 1 to 2 m/s is most commonly<br />
used, <strong>the</strong> best correlation between echocardiographic and invasive<br />
measures was found by using <strong>the</strong> time <strong>for</strong> <strong>the</strong> TR velocity to<br />
increase from 0.5 to 2 m/s. 99 In this case, <strong>the</strong> numerator <strong>for</strong> <strong>the</strong> calculation<br />
is 15 mm Hg, representing <strong>the</strong> pressure difference as calculated<br />
from <strong>the</strong> simplified Bernoulli equation between 2 and 0.5 m/s.<br />
Advantages: This is a simple technique with a sound physiologic<br />
basis.<br />
Disadvantages: There are limited data in both normal subjects<br />
and pathologic conditions. RV dp/dt is load dependent. RVdp/dt<br />
will be less accurate in severe TR because <strong>of</strong> neglect <strong>of</strong> <strong>the</strong> inertial<br />
component <strong>of</strong> <strong>the</strong> Bernoulli equation and <strong>the</strong> rise in RA pressure.<br />
Recommendations: Because <strong>of</strong> <strong>the</strong> lack <strong>of</strong> data in normal<br />
subjects, RV dP/dt cannot be recommended <strong>for</strong> routine<br />
uses. It can be considered in subjects with suspected RV<br />
dysfunction. RV dP/dt < approximately 400 mm Hg/s is<br />
likely abnormal.<br />
RIMP. The MPI, also known as <strong>the</strong> RIMP or Tei index, is a global estimate<br />
<strong>of</strong> both systolic and diastolic function <strong>of</strong> <strong>the</strong> right ventricle. It is<br />
based on <strong>the</strong> relationship between ejection and nonejection work <strong>of</strong>
print & web 4C=FPO<br />
Journal <strong>of</strong> <strong>the</strong> American Society <strong>of</strong> Echocardiography<br />
Volume 23 Number 7<br />
Figure 14 The two elements needed to calculate <strong>the</strong> noninvasive index <strong>of</strong> pulmonary vascular resistance (PVR) are found in this example.<br />
The ratio <strong>of</strong> peak tricuspid regurgitant velocity (TRV) (2.78 m/s) to <strong>the</strong> time-velocity integral (TVI) (11 cm) in <strong>the</strong> right ventricular<br />
outflow tract (RVOT) is abnormal at 0.25 (normal, #0.15). The estimated PVR is 2.68 using <strong>the</strong> <strong>for</strong>mula (TRVmax/RVOT TVI) 10 +<br />
0.16. 84 Adapted with permission from J Am Soc Echocardiogr. 52<br />
<strong>the</strong> heart. The MPI is defined as <strong>the</strong> ratio <strong>of</strong> isovolumic time divided<br />
by ET, or [(IVRT + IVCT)/ET] (Figure 16).<br />
The measure remains accurate within a broad range <strong>of</strong> heart<br />
rates, 100 though <strong>the</strong> components should be measured with a constant<br />
R-R interval to minimize error. Although <strong>the</strong> MPI was initially thought<br />
to be relatively independent <strong>of</strong> preload, this has been questioned in<br />
more recent studies. In addition, <strong>the</strong> MPI has been demonstrated to<br />
be unreliable when RA pressure is elevated (eg, RV infarction), as<br />
<strong>the</strong>re is a more rapid equilibration <strong>of</strong> pressures between <strong>the</strong> RV and<br />
RA, shortening <strong>the</strong> IVRT and resulting in an inappropriately small<br />
MPI. 101<br />
The right-sided MPI can be obtained by two methods: <strong>the</strong> pulsed<br />
Doppler method and <strong>the</strong> tissue Doppler method. In <strong>the</strong> pulsed<br />
Doppler method, <strong>the</strong> ET is measured with pulsed Doppler <strong>of</strong> RVoutflow<br />
(time from <strong>the</strong> onset to <strong>the</strong> cessation <strong>of</strong> flow), and <strong>the</strong> tricuspid<br />
(valve) closure-opening time is measured with ei<strong>the</strong>r pulsed Doppler<br />
<strong>of</strong> <strong>the</strong> tricuspid inflow (time from <strong>the</strong> end <strong>of</strong> <strong>the</strong> transtricuspid A wave<br />
to <strong>the</strong> beginning <strong>of</strong> <strong>the</strong> transtricuspid E wave) or continuous Doppler<br />
<strong>of</strong> <strong>the</strong> TR jet (time from <strong>the</strong> onset to <strong>the</strong> cessation <strong>of</strong> <strong>the</strong> jet). These<br />
measurements are taken from different images, and one must <strong>the</strong>re<strong>for</strong>e<br />
attempt to use beats with similar R-R intervals to obtain a more<br />
accurate RIMP value. In <strong>the</strong> tissue Doppler method, all time intervals<br />
are measured from a single beat by pulsing <strong>the</strong> tricuspid annulus<br />
(shown below). As was demonstrated <strong>for</strong> <strong>the</strong> LV MPI, 102,103 it is<br />
important to note that <strong>the</strong> correlation between both methods is<br />
modest and that normal values differ on <strong>the</strong> basis <strong>of</strong> <strong>the</strong> method<br />
chosen.<br />
The MPI has prognostic value in patients with PH at a single point<br />
in time, 100 and changes in MPI correlate with change in clinical status<br />
in this patient group. 104 It has also been studied in RV infarction, hypertrophic<br />
cardiomyopathy, and congenital heart disease, among<br />
o<strong>the</strong>rs. 105-110 The MPI has been measured in healthy individuals<br />
and in normal control subjects in 23 studies with >1000 subjects.<br />
The upper reference limit is 0.40 by pulsed Doppler and 0.55 by<br />
tissue Doppler (Table 4).<br />
Advantages: This approach is feasible in a large majority <strong>of</strong> subjects<br />
both with and without TR, <strong>the</strong> MPI is reproducible, and it avoids<br />
<strong>the</strong> geometric assumptions and limitations <strong>of</strong> complex RV geometry.<br />
The pulsed tissue Doppler method allows <strong>for</strong> measurement <strong>of</strong> MPI as<br />
well as S 0 ,E 0 , and A 0 , all from a single image.<br />
Disadvantages: The MPI is unreliable when RV ET and TR time<br />
are measured with differing R-R intervals, as in atrial fibrillation.<br />
Moreover, it is load dependent and unreliable when RA pressure is<br />
elevated.<br />
Recommendations: The MPI may be used <strong>for</strong> initial and<br />
serial measurements as an estimate <strong>of</strong> RV function in complement<br />
with o<strong>the</strong>r quantitative and nonquantitative measures.<br />
The upper reference limit <strong>for</strong> <strong>the</strong> right-sided MPI is<br />
0.40 using <strong>the</strong> pulsed Doppler method and 0.55 using <strong>the</strong><br />
pulsed tissue Doppler method. It should not be used as<br />
<strong>the</strong> sole quantitative method <strong>for</strong> evaluation <strong>of</strong> RV function<br />
and should not be used with irregular heart rates.<br />
B. Regional <strong>Assessment</strong> <strong>of</strong> RV Systolic Function<br />
Rudski et al 701<br />
TAPSE or Tricuspid Annular Motion (TAM). The systolic movement<br />
<strong>of</strong> <strong>the</strong> base <strong>of</strong> <strong>the</strong> RV free wall provides one <strong>of</strong> <strong>the</strong> most visibly<br />
obvious movements on normal echocardiography. TAPSE or TAM is<br />
a method to measure <strong>the</strong> distance <strong>of</strong> systolic excursion <strong>of</strong> <strong>the</strong> RV annular<br />
segment along its longitudinal plane, from a standard apical<br />
4-chamber window. TAPSE or TAM represents longitudinal function<br />
<strong>of</strong> <strong>the</strong> right ventricle in <strong>the</strong> same way as mitral annular plane systolic<br />
excursion by Doppler tissue imaging does with <strong>the</strong> left ventricle. It is<br />
inferred that <strong>the</strong> greater <strong>the</strong> descent <strong>of</strong> <strong>the</strong> base in systole, <strong>the</strong> better<br />
<strong>the</strong> RV systolic function. As with o<strong>the</strong>r regional methods, it assumes<br />
that <strong>the</strong> displacement <strong>of</strong> <strong>the</strong> basal and adjacent segments in <strong>the</strong> apical<br />
4-chamber view is representative <strong>of</strong> <strong>the</strong> function <strong>of</strong> <strong>the</strong> entire right<br />
ventricle, an assumption that is not valid in many disease states or<br />
when <strong>the</strong>re are regional RV wall motion abnormalities. TAPSE is usually<br />
acquired by placing an M-mode cursor through <strong>the</strong> tricuspid annulus<br />
and measuring <strong>the</strong> amount <strong>of</strong> longitudinal motion <strong>of</strong> <strong>the</strong><br />
annulus at peak systole (Figure 17).<br />
In <strong>the</strong> initial validation study by Kaul et al, 111 TAPSE correlated<br />
strongly with radionuclide angiography, with low interobserver variability.<br />
It has also been validated against biplane Simpson RV EF and<br />
RV fractional area shortening. 112,113 In a study <strong>of</strong> 750 patients with<br />
a variety <strong>of</strong> cardiac conditions, compared with 150 age-matched normal<br />
controls, a TAPSE cut<strong>of</strong>f value < 17 mm yielded high specificity,<br />
though low sensitivity to distinguish abnormal from normal<br />
subjects. 114 In total, <strong>the</strong>re have been >40 studies with >2000 normal<br />
subjects evaluating <strong>the</strong> utility <strong>of</strong> TAPSE or TAM (Table 4).<br />
Advantages: TAPSE is simple, less dependent on optimal image<br />
quality, and reproducible, and it does not require sophisticated equipment<br />
or prolonged image analysis.
print & web 4C=FPO<br />
702 Rudski et al Journal <strong>of</strong> <strong>the</strong> American Society <strong>of</strong> Echocardiography<br />
July 2010<br />
Figure 15 Point 1 represents <strong>the</strong> point at which <strong>the</strong> tricuspid regurgitation<br />
(TR) signal meets <strong>the</strong> 1 m/s velocity scale marker,<br />
while point 2 represents <strong>the</strong> point at which <strong>the</strong> TR signal meets<br />
<strong>the</strong> 2 m/s velocity scale marker. Point 3 represents <strong>the</strong> time required<br />
<strong>for</strong> <strong>the</strong> TR jet to increase from 1 to 2 m/s. In this example,<br />
this time is 30 ms, or 0.03 seconds. The dP/dt is <strong>the</strong>re<strong>for</strong>e 12 mm<br />
Hg/0.03 seconds, or 400 mm Hg/s.<br />
Disadvantages: TAPSE assumes that <strong>the</strong> displacement <strong>of</strong> a single<br />
segment represents <strong>the</strong> function <strong>of</strong> a complex 3D structure.<br />
Fur<strong>the</strong>rmore, it is angle dependent, and <strong>the</strong>re are no large-scale validation<br />
studies. Finally, TAPSE may be load dependent.<br />
Recommendations: TAPSE should be used routinely as<br />
a simple method <strong>of</strong> estimating RV function, with a lower<br />
reference value <strong>for</strong> impaired RV systolic function <strong>of</strong><br />
16 mm.<br />
Doppler Tissue Imaging. Among <strong>the</strong> most reliably and reproducibly<br />
imaged regions <strong>of</strong> <strong>the</strong> right ventricle are <strong>the</strong> tricuspid annulus and<br />
<strong>the</strong> basal free wall segment. These regions can be assessed by pulsed<br />
tissue Doppler and color-coded tissue Doppler to measure <strong>the</strong> longitudinal<br />
velocity <strong>of</strong> excursion. This velocity has been termed <strong>the</strong> RV S 0<br />
or systolic excursion velocity. To per<strong>for</strong>m this measure, an apical<br />
4-chamber window is used with a tissue Doppler mode region <strong>of</strong> interest<br />
highlighting <strong>the</strong> RV free wall. The pulsed Doppler sample volume<br />
is placed in ei<strong>the</strong>r <strong>the</strong> tricuspid annulus or <strong>the</strong> middle <strong>of</strong> <strong>the</strong> basal<br />
segment <strong>of</strong> <strong>the</strong> RV free wall (Figure 18). Because this technique uses<br />
Doppler, care must be taken to ensure optimal image orientation to<br />
avoid <strong>the</strong> underestimation <strong>of</strong> velocities. Alternatively, color-coded tissue<br />
Doppler is acquired at high frame rates and analyzed <strong>of</strong>fline, by<br />
placing a region <strong>of</strong> interest in <strong>the</strong> segment to be interrogated.<br />
Plat<strong>for</strong>m-specific s<strong>of</strong>tware <strong>the</strong>n generates velocity pr<strong>of</strong>iles over <strong>the</strong><br />
cardiac cycle. The velocity S 0 is read as <strong>the</strong> highest systolic velocity,<br />
without overgaining <strong>the</strong> Doppler envelope. <strong>Assessment</strong> <strong>of</strong> <strong>the</strong> mid<br />
and apical ventricular free wall velocities is discouraged in <strong>the</strong> routine<br />
echocardiographic studies, because <strong>the</strong>re is a lower rate <strong>of</strong> obtaining<br />
adequate signals 115 and greater variability. Because <strong>the</strong> interventricular<br />
septum does not exclusively reflect RV function, it should not be<br />
used alone to assess <strong>the</strong> right ventricle.<br />
A number <strong>of</strong> validation studies have been per<strong>for</strong>med comparing<br />
pulsed tissue Doppler velocities <strong>of</strong> <strong>the</strong> tricuspid annulus with radionuclide<br />
angiography, showing good correlations and good discriminative<br />
ability between normal and abnormal RV EFs.<br />
S 0 has one <strong>of</strong> <strong>the</strong> few population-based validation studies <strong>for</strong> <strong>the</strong><br />
right ventricle. The Umea˚ General Population <strong>Heart</strong> Study in<br />
Sweden assessed RV regional function in 235 healthy individuals<br />
aged 20 to 90 years. 115 Mean values in normal populations are approximately<br />
15 cm/s at <strong>the</strong> annulus and basal segment <strong>of</strong> <strong>the</strong> RV<br />
free wall, with lower velocities at <strong>the</strong> mid and apical segments.<br />
When 43 studies were pooled with >2000 normal controls, a lower<br />
reference limit <strong>of</strong> normal controls was 10 cm/s.<br />
Figure 16 Calculation <strong>of</strong> right ventricular myocardial per<strong>for</strong>mance<br />
index (MPI) by pulsed Doppler (A) and pulsed tissue<br />
Doppler (B). The tricuspid (valve) closure opening time (TCO) encompasses<br />
isovolumic contraction time, ejection time (ET), and<br />
isovolumic relaxation time. In <strong>the</strong> pulsed Doppler method, TCO<br />
can also be measured by <strong>the</strong> duration <strong>of</strong> <strong>the</strong> tricuspid regurgitation<br />
continuous-wave Doppler signal. MPI = (TCO ET)/ET.<br />
Note that S 0 ,E 0 , and A 0 are also measured from <strong>the</strong> same pulsed<br />
Doppler tissue image.<br />
Color-coded tissue Doppler yields lower velocities, because <strong>the</strong><br />
encoded data represent mean velocities. Color-coded tissue<br />
Doppler studies have been per<strong>for</strong>med in healthy volunteers and<br />
normal controls. Mean annular velocities average 8.5 to 10 cm/s,<br />
while basal RV free wall velocities are slightly higher at 9.3 to<br />
11 cm/s. Two studies have demonstrated slightly lower velocities<br />
in older groups <strong>of</strong> subjects. 116,117 Mid and distal segments were<br />
less reliably acquired, with greater variability. The reference limit<br />
pooled from <strong>the</strong> available studies is 6 cm/s but with slightly<br />
broader 95% confidence intervals around this reference limit<br />
(Table 4).<br />
Advantages: A simple, reproducible technique with good discriminatory<br />
ability to detect normal versus abnormal RV function,<br />
pulsed Doppler is available on all modern ultrasound equipment<br />
and does not require additional s<strong>of</strong>tware. In addition, color-coded<br />
Doppler-derived S 0 may be obtained and analyzed <strong>of</strong>fline on certain<br />
plat<strong>for</strong>ms.<br />
Disadvantages: This technique is less reproducible <strong>for</strong> nonbasal<br />
segments and is angle dependent, and <strong>the</strong>re are limited normative<br />
data in all ranges and in both sexes. Moreover, it assumes that <strong>the</strong><br />
function <strong>of</strong> a single segment represents <strong>the</strong> function <strong>of</strong> <strong>the</strong> entire right<br />
ventricle, which is not likely in conditions that include regionality,<br />
such as RV infarction or pulmonary embolism.<br />
Recommendations: Interrogation <strong>of</strong> S 0 by pulsed tissue<br />
Doppler is a simple and reproducible measure to assess<br />
basal RV free wall function and should be used in <strong>the</strong> assessment<br />
<strong>of</strong> RV function. S 0 < 10 cm/s should raise <strong>the</strong> suspicion<br />
<strong>for</strong> abnormal RV function, particularly in a younger adult<br />
print & web 4C=FPO
print & web 4C=FPO<br />
print & web 4C=FPO<br />
Journal <strong>of</strong> <strong>the</strong> American Society <strong>of</strong> Echocardiography<br />
Volume 23 Number 7<br />
Figure 17 Measurement <strong>of</strong> tricuspid annular plane systolic excursion (TAPSE).<br />
Figure 18 Tissue Doppler <strong>of</strong> <strong>the</strong> tricuspid annulus in a patient with normal right ventricular systolic function: (left) pulsed and (right)<br />
color-coded <strong>of</strong>fline analysis.<br />
patient. There are insufficient data in <strong>the</strong> elderly. Offline<br />
analysis by color-coded tissue Doppler currently remains<br />
a research tool, with less data and wider confidence intervals<br />
<strong>for</strong> normal values.<br />
Myocardial Acceleration During Isovolumic Contraction.<br />
Myocardial acceleration during isovolumic contraction is defined as<br />
<strong>the</strong> peak isovolumic myocardial velocity divided by time to peak velocity<br />
and is typically measured <strong>for</strong> <strong>the</strong> right ventricle by Doppler tissue<br />
imaging at <strong>the</strong> lateral tricuspid annulus (Figure 19). For <strong>the</strong> calculation<br />
<strong>of</strong> IVA, <strong>the</strong> onset <strong>of</strong> myocardial acceleration is at <strong>the</strong> zero crossing point<br />
<strong>of</strong> myocardial velocity during isovolumic contraction. Isovolumic acceleration<br />
(IVA) appears to be less load dependent than ejection period<br />
indices under a variety <strong>of</strong> physiologic conditions. 118-121<br />
In a series <strong>of</strong> cardiac patients under anes<strong>the</strong>sia, RV IVA appeared to<br />
be <strong>the</strong> most consistent tissue Doppler variable <strong>for</strong> <strong>the</strong> evaluation <strong>of</strong><br />
RV function measured by ei<strong>the</strong>r transthoracic echocardiography (lat-<br />
Rudski et al 703<br />
eral wall) or transesophageal echocardiography (inferior wall). 122 RV<br />
IVA has been demonstrated to correlate with <strong>the</strong> severity <strong>of</strong> illness in<br />
conditions affecting right heart function, including obstructive sleep<br />
apnea, 123 mitral stenosis, 124,125 repaired tetralogy <strong>of</strong> Fallot with<br />
pulmonary regurgitation, 126 and transposition <strong>of</strong> <strong>the</strong> great arteries<br />
following an atrial switch procedure. 127<br />
Normal RV IVA values have been obtained from studies that have<br />
included a control group <strong>of</strong> normal adults and/or children. It appears<br />
to be age dependent, with <strong>the</strong> highest values found between <strong>the</strong> ages<br />
<strong>of</strong> 10 and 20 years. 128 As with all tissue Doppler indices, <strong>the</strong> acquisition<br />
technique is important to document. Pulsed-wave tissue Doppler<br />
values are up to 20% higher than color-coded tissue Doppler<br />
values. 116 In addition, IVA has been shown to vary with heart<br />
rate, 121 and indexing to heart rate may be appropriate in some clinical<br />
situations. The lower reference limit by pulsed-wave Doppler tissue<br />
imaging, pooled from 10 studies, is 2.2 m/s 2 , with a broad 95%<br />
confidence interval <strong>of</strong> 1.4 to 3.0 (Table 4).
print & web 4C=FPO<br />
704 Rudski et al Journal <strong>of</strong> <strong>the</strong> American Society <strong>of</strong> Echocardiography<br />
July 2010<br />
Figure 19 Doppler tissue velocities and time intervals obtained at lateral tricuspid valve annulus. Aa, Peak velocity during atrial contraction;<br />
AT, acceleration time; Ea, peak velocity during early diastole; ET, ejection time; IVA, myocardial acceleration during isovolumic<br />
contraction; IVV, peak myocardial velocity during isovolumic contraction; Sa, peak velocity during ejection period <strong>of</strong> systole.<br />
Reproduced with permission from J Am Soc Echocardiogr. 182<br />
Advantages: RV IVA is a relatively load independent measurement<br />
<strong>of</strong> global RV systolic function that has been shown to correlate<br />
with severity <strong>of</strong> illness in conditions affecting right heart function.<br />
Disadvantages: There are limited normative data available, and<br />
RV IVA is an angle-dependent Doppler measurement that appears to<br />
vary with age and heart rate.<br />
Recommendations: In studies in patients with conditions<br />
affected by RV function, RV IVA may be used, and when<br />
used, it should be measured at <strong>the</strong> lateral tricuspid annulus.<br />
RV IVA is not recommended as a screening parameter<br />
<strong>for</strong> RV systolic function in <strong>the</strong> general echocardiography<br />
laboratory population. Because <strong>of</strong> <strong>the</strong> broad confidence interval<br />
around its lower reference limit, no reference value<br />
can be recommended.<br />
Regional RV Strain and Strain Rate. Strain is defined as percentage<br />
change in myocardial de<strong>for</strong>mation, while its derivative, strain rate,<br />
represents <strong>the</strong> rate <strong>of</strong> de<strong>for</strong>mation <strong>of</strong> myocardium over time. Strain<br />
rate has been closely correlated with myocardial contractility in<br />
in vitro and in vivo experimental settings. 129<br />
One-dimensional strain is acquired using Doppler tissue imaging<br />
and is consequentially angle dependent. It is most reproducible in<br />
<strong>the</strong> apical 4-chamber view, interrogating <strong>the</strong> basal, mid, and, to a lesser<br />
degree, apical segments <strong>of</strong> <strong>the</strong> RV free wall. As a result, one is limited<br />
to mostly longitudinal strain. A number <strong>of</strong> algorithms have been adapted<br />
to try to deal with issues in signal to noise ratio, and varying groups<br />
studying strain and strain rate in myocardial per<strong>for</strong>mance have used<br />
different protocols. As a result, values obtained may not be <strong>the</strong><br />
same across ultrasound plat<strong>for</strong>ms, fur<strong>the</strong>r increasing difficulties in reproducibility.<br />
To calculate strain, high frame rates are required, ideally $150<br />
frames/s. As such, a narrow imaging sector focusing on <strong>the</strong> RV<br />
free wall is desired. Care should be taken to align <strong>the</strong> segment in<br />
<strong>the</strong> center <strong>of</strong> <strong>the</strong> sector to avoid errors due to <strong>the</strong> angle dependence<br />
<strong>of</strong> Doppler. A maximum tolerance <strong>of</strong> 10 to 15 <strong>of</strong>f <strong>the</strong> axis <strong>of</strong> contraction<br />
is recommended. 130 Imaging is in color-coded tissue<br />
Doppler mode, and $3 beats are acquired with suspended respiration.<br />
Values <strong>for</strong> strain and SR are <strong>the</strong>n derived <strong>of</strong>fline on <strong>the</strong> system<br />
or workstation using equipment-specific algorithms by placing<br />
sample volume(s) or regions <strong>of</strong> interest <strong>of</strong> varying sizes in <strong>the</strong> mid<br />
portion <strong>of</strong> <strong>the</strong> segment(s).<br />
Strain and strain rate values have been studied in a number <strong>of</strong> conditions<br />
affecting <strong>the</strong> right heart, including arrhythmogenic RV dysplasia,<br />
131 pulmonary embolism, 132 PH, 133 systemic right ventricle, 134<br />
and amyloidosis. 135-137 There is a lack <strong>of</strong> normative data <strong>for</strong> strain<br />
and strain rate measures <strong>of</strong> <strong>the</strong> right ventricle, and most values in<br />
normal subjects represent small groups <strong>of</strong> patients representing<br />
control arms in pathologic studies. Values <strong>for</strong> basal, mid, and apical<br />
free wall segments <strong>of</strong> <strong>the</strong> right ventricle are displayed in Table 5.<br />
Pooled data yield results with very large SDs around <strong>the</strong> mean values.<br />
As such, lower reference values based on 95% confidence intervals<br />
are not clinically useful.<br />
Advantages: Regional RV strain represents a potential means to<br />
assess myocardial contractility that is less load dependent, and may be<br />
applicable across a wide range <strong>of</strong> pathologies.<br />
Disadvantages: There is a lack <strong>of</strong> normative data. In addition,<br />
this measure is angle dependent and has a poor signal-to-noise ratio.<br />
Finally, this is a complex measure with a high degree <strong>of</strong> variability that<br />
requires additional s<strong>of</strong>tware and <strong>of</strong>fline analysis.<br />
Recommendations: The significant disadvantages listed<br />
above limit <strong>the</strong> clinical use <strong>of</strong> regional RV strain.<br />
Reference limits cannot be recommended, because <strong>of</strong> very<br />
wide confidence intervals both around <strong>the</strong> mean values<br />
and around <strong>the</strong> reference limits. Strain and strain rate
Journal <strong>of</strong> <strong>the</strong> American Society <strong>of</strong> Echocardiography<br />
Volume 23 Number 7<br />
Table 5 Longitudinal strain and strain rate<br />
Variable Studies n LRV (95% CI) Mean (95% CI) URV (95% CI)<br />
2D peak strain rate at <strong>the</strong> base (s 1 ) 1 61 0.70 (0.50-0.90) 1.62 (1.50-1.74) 2.54 (2.34-2.74)<br />
2D peak strain rate at <strong>the</strong> mid cavity (s 1 ) 2 80 0.85 (0.66-1.04) 1.54 (1.46-1.62) 2.23 (2.04-2.42)<br />
2D peak strain rate at <strong>the</strong> apex (s 1 ) 2 80 0.86 (0.46-1.25) 1.62 (1.46-1.79) 2.39 (1.99-2.78)<br />
2D peak strain at <strong>the</strong> base (%) 5 183 18 (14-22) 28 (25-32) 39 (35-43)<br />
2D peak strain at <strong>the</strong> mid cavity (%) 4 125 20 (15-24) 29 (25-33) 38 (34-43)<br />
2D peak strain at <strong>the</strong> apex (%) 4 145 19 (15-22) 29 (26-32) 39 (36-43)<br />
Doppler peak strain rate at <strong>the</strong> base (s 1 ) 7 261 1.00 (0.63-1.38) 1.83 (1.50-2.15) 2.66 (2.28-3.03)<br />
Doppler peak strain rate at <strong>the</strong> mid cavity (s 1 ) 5 187 0.98 (0.68-1.28) 1.88 (1.73-2.03) 2.79 (2.49-3.09)<br />
Doppler peak strain rate at <strong>the</strong> apex (s 1 ) 5 204 1.14 (0.60-1.69) 2.04 (1.57-2.51) 2.93 (2.39-3.48)<br />
Doppler peak strain at <strong>the</strong> apex (%) 7 290 17 (12-21) 30 (27-34) 44 (39-48)<br />
Doppler peak strain at <strong>the</strong> base (%) 11 385 13 (9-17) 29 (27-31) 45 (41-49)<br />
Doppler peak strain at <strong>the</strong> mid cavity (%) 7 269 13 (9-18) 31 (29-32) 48 (44-52)<br />
CI, Confidence interval; LRV, lower reference value; 2D, two-dimensional; URV, upper reference value.<br />
remain research tools in experienced labs until <strong>the</strong>ir limitations<br />
can be overcome.<br />
Two-Dimensional Strain. Strain measurement has been possible<br />
using 2D images, resulting in <strong>the</strong> estimation <strong>of</strong> 2D strain. This new<br />
measure <strong>of</strong> regional and global contractility uses frame-by-frame<br />
tracking <strong>of</strong> unique speckles in <strong>the</strong> myocardium with an algorithm<br />
that allows tracking <strong>the</strong> speckle location on sequential images using<br />
correlation criteria and sum <strong>of</strong> absolute differences. In one ultrasound<br />
plat<strong>for</strong>m, this process is per<strong>for</strong>med using velocity vector<br />
tracking. In addition to generating strain curves in individual segments,<br />
algorithms exist to average strain over <strong>the</strong> entire chamber.<br />
A significant advantage <strong>of</strong> 2D tracking methods is that <strong>the</strong>y are<br />
not angle dependent within <strong>the</strong> acquired imaging plane, but proper<br />
alignment <strong>of</strong> image planes is still important. Two-dimensional strain<br />
has been applied and validated in <strong>the</strong> LV and has recently been<br />
studied to assess RV function in systemic right ventricle and in patients<br />
with PH. 134<br />
Advantages: This technique is relatively angle independent and<br />
possesses an improved signal-to-noise ratio. It can also provide regional<br />
function estimates, as well as a more ‘‘global’’ function.<br />
Disadvantages: There is a lack <strong>of</strong> normative data regarding this<br />
technique, which also requires additional validation. Requiring additional<br />
s<strong>of</strong>tware, it is dependent on adequate image quality. The<br />
‘‘global’’ nature is derived only from a single view, making it not a truly<br />
global assessment <strong>of</strong> RV function. Finally, different algorithms in different<br />
plat<strong>for</strong>ms may result in different normal ranges.<br />
Recommendations: Because <strong>of</strong> <strong>the</strong> lack <strong>of</strong> reproducibility<br />
and <strong>the</strong> paucity <strong>of</strong> data, this technique is not recommended<br />
<strong>for</strong> routine clinical use. No reference limits can be recommended,<br />
because <strong>of</strong> <strong>the</strong> large degree <strong>of</strong> variability.<br />
SUMMARY OF RECOMMENDATIONS FOR THE<br />
ASSESSMENT OF RIGHT VENTRICULAR SYSTOLIC<br />
FUNCTION<br />
Visual assessment <strong>of</strong> RV systolic function gives <strong>the</strong> reader an initial<br />
qualitative evaluation <strong>of</strong> RV systolic function but remains insufficient<br />
in this era <strong>of</strong> standardization. There are several simple and reproducible<br />
methods <strong>of</strong> assessing RV systolic function that should be incorporated<br />
into <strong>the</strong> routine echocardiographic assessment. These are FAC,<br />
TAPSE, pulsed tissue Doppler S 0 , and MPI. Combining more than one<br />
measure <strong>of</strong> RV function, such as S 0 and MPI, may more reliably distinguish<br />
normal from abnormal function. 113 It is strongly recommended<br />
that at least one <strong>of</strong> <strong>the</strong> above quantitative measures be incorporated<br />
into <strong>the</strong> routine echocardiographic examination and report, and this is<br />
particularly important when RV dysfunction is suspected and or when<br />
<strong>the</strong> clinical indication <strong>for</strong> <strong>the</strong> study relates to a condition that may affect<br />
<strong>the</strong> right ventricle. More sophisticated techniques such as IVA,<br />
strain, and strain rate are not currently recommended as routine<br />
and are best reserved <strong>for</strong> specific clinical and research applications<br />
in experienced laboratories.<br />
RIGHT VENTRICULAR DIASTOLIC FUNCTION<br />
Rudski et al 705<br />
A. RV Diastolic Dysfunction<br />
The right ventricle is more than a passive chamber. Acute injury to <strong>the</strong><br />
right ventricle, most notably in <strong>the</strong> context <strong>of</strong> RV myocardial infarction,<br />
results in marked diastolic dysfunction with elevated filling pressures<br />
and clinically apparent jugular venous distension. 138-140<br />
Pathophysiology <strong>of</strong> RV diastolic dysfunction is much more complex<br />
than simply measuring <strong>the</strong> thickness <strong>of</strong> <strong>the</strong> myocardium. 141-145 A<br />
growing number <strong>of</strong> acute and chronic conditions have been<br />
associated with RV diastolic dysfunction, including both pressure<br />
and volume overload pathologies, primary lung disease, ischemic<br />
heart disease, congenital heart disease, cardiomyopathies, LV<br />
dysfunction (via ventricular interdependence), systemic diseases,<br />
and <strong>the</strong> physiologic aging process (Table 7).<br />
B. Measurement <strong>of</strong> RV Diastolic Function<br />
From <strong>the</strong> apical 4-chamber view, <strong>the</strong> Doppler beam should be aligned<br />
parallel to <strong>the</strong> RV inflow. Proper alignment may be facilitated by displacing<br />
<strong>the</strong> transducer medially toward <strong>the</strong> lower parasternal region.<br />
The sample volume should be placed at <strong>the</strong> tips <strong>of</strong> <strong>the</strong> tricuspid leaflets.<br />
141 With this technique, measurement <strong>of</strong> transtricuspid flow velocities<br />
can be achieved in most patients, with low interobserver and<br />
intraobserver variability. 146 Care must be taken to measure at held<br />
end-expiration and/or take <strong>the</strong> average <strong>of</strong> $5 consecutive beats. 147<br />
The presence <strong>of</strong> moderate to severe TR or atrial fibrillation could confound<br />
diastolic parameters, and most studies excluded such patients.
706 Rudski et al Journal <strong>of</strong> <strong>the</strong> American Society <strong>of</strong> Echocardiography<br />
July 2010<br />
Table 6 Diastolic function<br />
Variable Studies n LRV (95% CI) Mean (95% CI) URV (95% CI)<br />
E (cm/s) 55 2866 35 (33-37) 54 (52-56) 73 (71-75)<br />
A (cm/s) 55 3096 21 (19-24) 40 (38-41) 58 (55-60)<br />
E/A ratio* 56 2994 0.8 (0.7-0.9) 1.4 (1.4-1.5) 2.1 (2.0-2.2)<br />
Deceleration time (ms) 25 1284 120 (105-134) 174 (163-186) 229 (214-243)<br />
IVRT (ms) 23 1241 23 (16-30) 48 (43-53) 73 (66-80)<br />
E 0 (cm/s) 40 1688 8 (7-9) 14 (13-14) 20 (19-21)<br />
A 0 (cm/s) 37 1575 7 (6-8) 13 (12-14) 20 (19-21)<br />
E 0 /A 0 ratio 29 1053 0.5 (0.4-0.6) 1.2 (1.1-1.3) 1.9 (1.7-2.0)<br />
E/E 0 ratio 3 359 2 (1-2) 4 (4-4) 6 (5-7)<br />
CI, Confidence interval; IVRT, Isovolumic relaxation time; LRV, lower reference value; URV, upper reference value.<br />
*Age-dependent: average E/A ratio = 1.6 in <strong>the</strong> third decade <strong>of</strong> life, decreasing by 0.1 <strong>for</strong> every subsequent decade.<br />
Estimation <strong>of</strong> RA pressure by measurement <strong>of</strong> IVC diameter and collapse<br />
with inspiration as described above should be factored into <strong>the</strong><br />
determination <strong>of</strong> RV diastolic function. The parameters used to assess<br />
RV diastolic function are essentially <strong>the</strong> same as those used to assess<br />
<strong>the</strong> left side. Those that have been most validated are Doppler velocities<br />
<strong>of</strong> <strong>the</strong> transtricuspid flow (E, A, and E/A), tissue Doppler velocities<br />
<strong>of</strong> <strong>the</strong> tricuspid annulus (E 0 ,A 0 ,E 0 /A 0 ), deceleration time, and<br />
IVRT (Table 6). The tricuspid E/E 0 ratio, RA area or volume, and diastolic<br />
strain rate appear promising and have attracted interest in recent<br />
studies. In addition, <strong>the</strong> presence <strong>of</strong> late diastolic antegrade flow in <strong>the</strong><br />
pulmonary artery (measured by pulsed Doppler with <strong>the</strong> sample volume<br />
positioned midway between <strong>the</strong> pulmonary valve leaflets and<br />
<strong>the</strong> pulmonary artery bifurcation) is a sign <strong>of</strong> restrictive diastolic filling.<br />
148 This sign, mainly described after tetralogy <strong>of</strong> Fallot repair, occurs<br />
when <strong>the</strong> elevated RV end-diastolic pressure causes premature<br />
opening <strong>of</strong> <strong>the</strong> pulmonary valve and transmission <strong>of</strong> <strong>the</strong> RA contraction<br />
A wave in <strong>the</strong> pulmonary artery.<br />
C. Effects <strong>of</strong> Age, Respiration, <strong>Heart</strong> Rate, and Loading<br />
Conditions<br />
Most studies have shown that <strong>the</strong>re is a modest correlation (r z 0.30)<br />
between <strong>the</strong> E/A ratio and increasing age. The E/A ratio decreases by<br />
approximately 0.1 per decade. 117,141,149,150 Inspiration causes an<br />
increase in E and <strong>the</strong>re<strong>for</strong>e an increase in <strong>the</strong> E/A ratio.<br />
Tachycardia causes an increase in E but a relatively greater increase<br />
in A and <strong>the</strong>re<strong>for</strong>e a decrease in <strong>the</strong> E/A ratio. 141,150,151 When<br />
comparing Doppler parameters between patients or in <strong>the</strong> same<br />
patient, one must consider <strong>the</strong> effect <strong>of</strong> <strong>the</strong>se hemodynamic<br />
variables on <strong>the</strong> observed parameters. Because <strong>of</strong> its thin wall, <strong>the</strong><br />
right ventricle is very sensitive to afterload (wall stress), especially in<br />
<strong>the</strong> presence <strong>of</strong> RV myocardial disease such as ischemia or<br />
infarction. 144,152,153 It is also sensitive to changes in preload,<br />
whereby a reduction in preload causes a decrease in E but<br />
a relatively smaller decrease in A and <strong>the</strong>re<strong>for</strong>e a decrease in E/<br />
A. 154-156 Tissue Doppler is less load dependent, because<br />
a reduction in preload causes an equal decrease in E 0 and A 0 and<br />
<strong>the</strong>re<strong>for</strong>e an unchanged E 0 /A 0 ratio. Importantly, tissue Doppler<br />
should be used to differentiate normal from pseudonormal filling<br />
patterns with elevated filling pressures as are hepatic vein flow<br />
patterns and vena cava size and collapse. 15 Last, <strong>the</strong> physiologic response<br />
to exercise is to increase both early rapid filling and atrial contribution.<br />
In ischemic patients, <strong>the</strong> pathophysiologic response is<br />
a failure <strong>of</strong> <strong>the</strong> early rapid filling to increase and a heightened dependency<br />
on atrial contribution and consequent elevated RA pressure. 157<br />
D. Clinical Relevance<br />
A small number <strong>of</strong> studies have evaluated <strong>the</strong> clinical impact <strong>of</strong> RV<br />
diastolic dysfunction. The tricuspid E/E0 ratio and RA volume have<br />
been shown to correlate well with hemodynamic parameters. An<br />
E/E0 ratio $ 4 had high sensitivity and specificity <strong>for</strong> predicting RA<br />
pressure $ 10 mm Hg in non–cardiac surgery intensive care unit patients,<br />
158 while an E/E0 ratio > 8 had good sensitivity and specificity<br />
<strong>for</strong> predicting RA pressure $ 10 mm Hg in cardiac transplantation<br />
patients. 159 In patients with chronic heart failure and PH, <strong>the</strong> presence<br />
<strong>of</strong> RV diastolic dysfunction was associated with worse functional class<br />
and was an independent predictor <strong>of</strong> mortality. 100,160 Diastolic filling<br />
patterns reflect response to <strong>the</strong>rapy, improving with successful<br />
treatment <strong>of</strong> a variety <strong>of</strong> cardiac conditions. 161-164 Finally, RV<br />
diastolic dysfunction may be clinically useful because it serves as an<br />
early and more easily quantifiable marker <strong>of</strong> subclinical RV<br />
dysfunction. Multiple studies have shown that RV diastolic<br />
dysfunction is usually present be<strong>for</strong>e apparent systolic dysfunction<br />
and be<strong>for</strong>e RV dilatation or RVH.<br />
Recommendations: Measurement <strong>of</strong> RV diastolic function<br />
should be considered in patients with suspected RV<br />
impairment as a marker <strong>of</strong> early or subtle RV dysfunction,<br />
or in patients with known RV impairment as<br />
a marker <strong>of</strong> poor prognosis. Transtricuspid E/A ratio, E/<br />
E0 ratio, and RA size have been most validated and are<br />
<strong>the</strong> preferred measures(Table 6). Grading <strong>of</strong> RV diastolic<br />
dysfunction should be done as follows: tricuspid E/A ratio<br />
< 0.8 suggests impaired relaxation, a tricuspid E/A ratio<br />
<strong>of</strong> 0.8 to 2.1 with an E/E0 ratio > 6 or diastolic flow<br />
predominance in <strong>the</strong> hepatic veins suggests pseudonormal<br />
filling, and a tricuspid E/A ratio > 2.1 with a deceleration<br />
time < 120 ms suggests restrictive filling (as does<br />
late diastolic antegrade flow in <strong>the</strong> pulmonary artery).<br />
Fur<strong>the</strong>r studies are warranted to validate <strong>the</strong> sensitivity<br />
and specificity and <strong>the</strong> prognostic implications <strong>of</strong> this<br />
classification.<br />
CLINICAL AND PROGNOSTIC SIGNIFICANCE OF RIGHT<br />
VENTRICULAR ASSESSMENT<br />
Quantitative assessment <strong>of</strong> RV size and function has proven to be <strong>of</strong><br />
important clinical value in a number <strong>of</strong> cardiac and pulmonary diseases.<br />
Numerous publications have demonstrated <strong>the</strong> prognostic significance<br />
<strong>of</strong> RV function.
Journal <strong>of</strong> <strong>the</strong> American Society <strong>of</strong> Echocardiography<br />
Volume 23 Number 7<br />
Table 7 Conditions associated with right ventricular diastolic<br />
dysfunction<br />
Condition<br />
Pulmonary embolism<br />
Pulmonary arterial hypertension<br />
Smoking<br />
Chronic obstructive pulmonary disease<br />
Cystic fibrosis<br />
Acute hypoxia<br />
Myocardial infarction or ischemia due to (proximal) right<br />
coronary artery lesion<br />
Repaired tetralogy <strong>of</strong> Fallot<br />
Repaired transposition <strong>of</strong> <strong>the</strong> great arteries<br />
Chronic heart failure<br />
Cardiac transplantation<br />
Arrhythmogenic right ventricular cardiomyopathy<br />
Hypertrophic cardiomyopathy<br />
Chagas disease<br />
Essential hypertension<br />
Aortic stenosis<br />
Aortic regurgitation<br />
Mitral regurgitation<br />
Myocardial infarction due to left anterior descending<br />
coronary artery lesion<br />
Diabetes mellitus<br />
Hypothyroidism<br />
Amyloidosis<br />
Rheumatoid arthritis<br />
Systemic sclerosis<br />
Antiphospholipid antibody syndrome<br />
Bechet’s vasculitis<br />
b-thalassemia<br />
Renal transplantation<br />
Hepatopulmonary syndrome<br />
Normal neonates<br />
Aging<br />
The normal right ventricle is accustomed to low pulmonary resistance<br />
and because <strong>of</strong> its thin walls is relatively compliant. Hence, conditions<br />
that acutely increase PVR, such as pulmonary embolism, result<br />
in increases in RV size prior to <strong>the</strong> augmentation <strong>of</strong> pulmonary pressures,<br />
which ultimately may result as <strong>the</strong> ventricle hypertrophies. 165<br />
Dilatation <strong>of</strong> <strong>the</strong> right ventricle thus is <strong>the</strong> first marker <strong>of</strong> increases<br />
in PVR. As <strong>the</strong> right ventricle hypertrophies to overcome <strong>the</strong> elevated<br />
PVR, RV size, indicated by diameter or volumes, can decrease, and<br />
<strong>the</strong> RV free wall thickness increases with ultimate increase in RVSP.<br />
In patients with acute pulmonary embolism, initial increases in RV<br />
volume and diameters are <strong>of</strong>ten accompanied by a specific pattern<br />
<strong>of</strong> abnormal regional wall motion in which <strong>the</strong> mid RV free wall becomes<br />
dyskinetic with relative sparing <strong>of</strong> <strong>the</strong> base and apex. 166 These<br />
findings have important prognostic implications in patients with pulmonary<br />
embolism 167 and are entirely reversible with improvement<br />
in pulmonary hemodynamics. 36 In patients with longstanding pulmonary<br />
vascular disease or o<strong>the</strong>r <strong>for</strong>ms <strong>of</strong> secondary PH (including from<br />
chronic obstructive pulmonary disease, emphysema, or o<strong>the</strong>r <strong>for</strong>ms<br />
<strong>of</strong> pulmonary parenchymal disease), <strong>the</strong> right ventricle tends to hypertrophy<br />
and normalize volumes at first, followed by eventual and<br />
progressive dilatation. 168<br />
RV size and function can also be adversely affected by diseases intrinsic<br />
to <strong>the</strong> left ventricle. Patients with LV dysfunction secondary to<br />
myocardial infarction or heart failure are at increased risk <strong>for</strong> both RV<br />
dilatation and dysfunction. 169-172 Indeed, RV dysfunction is one <strong>of</strong><br />
<strong>the</strong> most powerful independent predictors <strong>of</strong> outcome following<br />
myocardial infarction, even in <strong>the</strong> absence <strong>of</strong> overt RV<br />
infarction. 37,38 Similar findings have been shown in patients with<br />
chronic heart failure and in stable survivors a year after<br />
infarction. 173 Data from <strong>the</strong> Evaluation Study <strong>of</strong> Congestive <strong>Heart</strong><br />
Failure and Pulmonary Artery Ca<strong>the</strong>terization Effectiveness<br />
(ESCAPE) suggest that elevation in pulmonary pressures directly<br />
may contribute to alterations in RV size and function in patients<br />
with heart failure. 174 Moreover, sleep apnea in patients with heart failure<br />
may also contribute substantially to alterations in RV function and<br />
size. 175 These data suggest that clinical assessment <strong>of</strong> <strong>the</strong> right ventricle<br />
can add incrementally to <strong>the</strong> standard echocardiographic assessment<br />
in patients with left-sided heart disease.<br />
RV size and function can also be affected by diseases affecting <strong>the</strong><br />
tricuspid valve resulting in substantial TR. These include carcinoid disease,<br />
176,177 in which <strong>the</strong> tricuspid leaflets can retract and become<br />
functionally incompetent; rheumatic tricuspid disease 178 ; myxomatous<br />
degeneration <strong>of</strong> <strong>the</strong> tricuspid valve; or any o<strong>the</strong>r situation in<br />
which <strong>the</strong> tricuspid valve becomes incompetent. The volume overload<br />
that ensues with TR leads to dilatation <strong>of</strong> <strong>the</strong> right ventricle,<br />
which can itself result in fur<strong>the</strong>r TR.<br />
The most common congenital abnormality that affects <strong>the</strong> right<br />
ventricle in adult cardiology is atrial septal defect. The increased<br />
flow resulting from <strong>the</strong> shunt can lead to elevation in pulmonary<br />
pressures and RV dilatation. The population <strong>of</strong> patients with postoperative<br />
tetralogy <strong>of</strong> Fallot with severe pulmonary regurgitation presenting<br />
with severe RV dilatation and diminished function is<br />
increasing. O<strong>the</strong>r congenital abnormalities, such as Ebstein anomaly,<br />
and more complex congenital disorders can affect <strong>the</strong> right ventricle.<br />
Situations in which RV morphology appears to be particularly<br />
unusual should raise <strong>the</strong> suspicion <strong>of</strong> more complex congenital<br />
heart disease.<br />
CONCLUSION<br />
Rudski et al 707<br />
<strong>Echocardiographic</strong> assessment <strong>of</strong> <strong>the</strong> right ventricle has been largely<br />
qualitative, primarily because <strong>of</strong> <strong>the</strong> difficulty with assessing RV volumes<br />
because <strong>of</strong> its unusual shape. 179,180 Hence, <strong>the</strong>re are minimal<br />
quantitative data overall on RV size and function in normal controls<br />
and in disease states. A gradual shift to more quantitative<br />
approaches <strong>for</strong> <strong>the</strong> assessment <strong>of</strong> RV size and function will help<br />
standardize assessment <strong>of</strong> <strong>the</strong> right ventricle across laboratories and<br />
allow clinicians to better incorporate assessment <strong>of</strong> <strong>the</strong> right heart<br />
into an echocardiographic evaluation. Improvements in 3D imaging<br />
will result in increased use and have <strong>the</strong> potential to help in <strong>the</strong><br />
clinical assessment <strong>of</strong> RV size and function. 181<br />
This guidelines document provides clinicians basic views to assess<br />
<strong>the</strong> right ventricle and right atrium, <strong>the</strong> various parameters to assess<br />
RV systolic and diastolic function, and <strong>the</strong> normal reference values<br />
from pooled data. This will enable echocardiographers to distinguish<br />
an abnormal right ventricle from a normal one. It is hoped that this<br />
document will lead to fur<strong>the</strong>r work in establishing normal ranges in<br />
larger populations and that <strong>the</strong> application <strong>of</strong> <strong>the</strong> values included<br />
will enhance <strong>the</strong> value <strong>of</strong> echocardiography in recognizing RV<br />
dysfunction in clinical practice, in improving disease detection and<br />
in patient follow-up.
708 Rudski et al Journal <strong>of</strong> <strong>the</strong> American Society <strong>of</strong> Echocardiography<br />
July 2010<br />
ACKNOWLEDGMENTS<br />
The members <strong>of</strong> <strong>the</strong> writing group gratefully acknowledge <strong>the</strong> assistance<br />
<strong>of</strong> <strong>the</strong> members <strong>of</strong> <strong>the</strong> <strong>Guidelines</strong> and Standards Committee<br />
<strong>of</strong> <strong>the</strong> ASE <strong>for</strong> <strong>the</strong>ir careful review <strong>of</strong> <strong>the</strong> manuscript. We also thank<br />
Dr Russell Steele, PhD, <strong>for</strong> his assistance with statistical design and<br />
Renee Atallah, MSc, <strong>for</strong> her assistance in manuscript preparation.<br />
NOTICE AND DISCLAIMER<br />
This report is made available by ASE as a courtesy reference source<br />
<strong>for</strong> its members. This report contains recommendations only and<br />
should not be used as <strong>the</strong> sole basis to make medical practice decisions<br />
or <strong>for</strong> disciplinary action against any employee. The statements<br />
and recommendations contained in this report are primarily based on<br />
<strong>the</strong> opinions <strong>of</strong> experts, ra<strong>the</strong>r than on scientifically verified data. The<br />
ASE makes no express or implied warranties regarding <strong>the</strong> completeness<br />
or accuracy <strong>of</strong> <strong>the</strong> in<strong>for</strong>mation in this report, including <strong>the</strong> warranty<br />
<strong>of</strong> merchantability or fitness <strong>for</strong> a particular purpose. In no event<br />
shall ASE be liable to you, your patients, or any o<strong>the</strong>r third parties <strong>for</strong><br />
any decision made or action taken by you or such o<strong>the</strong>r parties in<br />
reliance on this in<strong>for</strong>mation. Nor does your use <strong>of</strong> this in<strong>for</strong>mation<br />
constitute <strong>the</strong> <strong>of</strong>fering <strong>of</strong> medical advice by <strong>the</strong> ASE or create any<br />
physician-patient relationship between <strong>the</strong> ASE and your patients<br />
or anyone else.<br />
REFERENCES<br />
1. Lang RM, Bierig M, Devereux RB, Flachskampf FA, Foster E, Pellikka PA,<br />
et al. Recommendations <strong>for</strong> chamber quantification: a report from <strong>the</strong><br />
American Society <strong>of</strong> Echocardiography’s <strong>Guidelines</strong> and Standards<br />
Committee and <strong>the</strong> Chamber Quantification Writing Group, developed<br />
in conjunction with <strong>the</strong> European Association <strong>of</strong> Echocardiography,<br />
a branch <strong>of</strong> <strong>the</strong> European Society <strong>of</strong> Cardiology. J Am Soc Echocardiogr<br />
2005;18:1440-63.<br />
2. Forman MB, Goodin J, Phelan B, Kopelman H, Virmani R. Electrocardiographic<br />
changes associated with isolated right ventricular infarction.<br />
J Am Coll Cardiol 1984;4:640-3.<br />
3. Kugel MA. Anatomical studies on <strong>the</strong> coronary arteries and <strong>the</strong>ir<br />
branches 1 arteria anastomotica auricularis magna. Am <strong>Heart</strong> J 1927;<br />
3:260.<br />
4. Weyman A. Practices and principles <strong>of</strong> echocardiography. 2nd ed. Philadelphia:<br />
Lippincott, Williams and Wilkins; 1994.<br />
5. Otto C. The practice <strong>of</strong> clinical echocardiography. 3rd ed. Philadelphia:<br />
Saunders Elsevier; 2007.<br />
6. Gaynor SL, Maniar HS, Prasad SM, Steendijk P, Moon MR. Reservoir<br />
and conduit function <strong>of</strong> right atrium: impact on right ventricular filling<br />
and cardiac output. Am J Physiol <strong>Heart</strong> Circ Physiol 2005;288:<br />
H2140-5.<br />
7. Muller H, Burri H, Lerch R. Evaluation <strong>of</strong> right atrial size in patients with<br />
atrial arrhythmias: comparison <strong>of</strong> 2D versus real time 3D echocardiography.<br />
Echocardiography 2008;25:617-23.<br />
8. Muller H, Noble S, Keller PF, Sigaud P, Gentil P, Lerch R, et al. Biatrial<br />
anatomical reverse remodelling after radi<strong>of</strong>requency ca<strong>the</strong>ter ablation<br />
<strong>for</strong> atrial fibrillation: evidence from real-time three-dimensional echocardiography.<br />
Europace 2008;10:1073-8.<br />
9. Moreno FL, Hagan AD, Holmen JR, Pryor TA, Strickland RD,<br />
Castle CH. Evaluation <strong>of</strong> size and dynamics <strong>of</strong> <strong>the</strong> inferior vena cava<br />
as an index <strong>of</strong> right-sided cardiac function. Am J Cardiol 1984;53:<br />
579-85.<br />
10. Brennan JM, Blair JE, Goonewardena S, Ronan A, Shah D, Vasaiwala S,<br />
et al. Reappraisal <strong>of</strong> <strong>the</strong> use <strong>of</strong> inferior vena cava <strong>for</strong> estimating right atrial<br />
pressure. J Am Soc Echocardiogr 2007;20:857-61.<br />
11. Jue J, Chung W, Schiller NB. Does inferior vena cava size predict right<br />
atrial pressures in patients receiving mechanical ventilation? J Am Soc<br />
Echocardiogr 1992;5:613-9.<br />
12. Feigenbaum H, Armstrong WF, Ryan T. Feigenbaum’s echocardiography.<br />
6th ed. Philadelphia: Lippincott Williams & Wilkins; 2005.<br />
13. Weyman A. Cross-sectional echocardiography. Philadelphia: Lea & Febiger;<br />
1981.<br />
14. Ommen SR, Nishimura RA, Hurrell DG, Klarich KW. <strong>Assessment</strong> <strong>of</strong> right<br />
atrial pressure with 2-dimensional and Doppler echocardiography: a simultaneous<br />
ca<strong>the</strong>terization and echocardiographic study. Mayo Clin<br />
Proc 2000;75:24-9.<br />
15. Nagueh SF, Kopelen HA, Zoghbi WA. Relation <strong>of</strong> mean right atrial pressure<br />
to echocardiographic and Doppler parameters <strong>of</strong> right atrial and<br />
right ventricular function. Circulation 1996;93:1160-9.<br />
16. Matsukubo H, Matsuura T, Endo N, Asayama J, Watanabe T. <strong>Echocardiographic</strong><br />
measurement <strong>of</strong> right ventricular wall thickness. A new application<br />
<strong>of</strong> subxiphoid echocardiography. Circulation 1977;56:278-84.<br />
17. Tsuda T, Sawayama T, Kawai N, Katoh T, Nezuo S, Kikawa K. <strong>Echocardiographic</strong><br />
measurement <strong>of</strong> right ventricular wall thickness in adults by<br />
anterior approach. Br <strong>Heart</strong> J 1980;44:55-61.<br />
18. Prakash R, Matsukubo H. Usefulness <strong>of</strong> echocardiographic right ventricular<br />
measurements in estimating right ventricular hypertrophy and right<br />
ventricular systolic pressure. Am J Cardiol 1983;51:1036-40.<br />
19. Gottdiener JS, Gay JA, Maron BJ, Fletcher RD. Increased right ventricular<br />
wall thickness in left ventricular pressure overload: echocardiographic determination<br />
<strong>of</strong> hypertrophic response <strong>of</strong> <strong>the</strong> ‘‘nonstressed’’ ventricle. J Am<br />
Coll Cardiol 1985;6:550-5.<br />
20. Haddad F, Hunt SA, Rosenthal DN, Murphy DJ. <strong>Right</strong> ventricular function<br />
in cardiovascular disease, part I: anatomy, physiology, aging, and<br />
functional assessment <strong>of</strong> <strong>the</strong> right ventricle. Circulation 2008;117:<br />
1436-48.<br />
21. Haddad F, Doyle R, Murphy DJ, Hunt SA. <strong>Right</strong> ventricular function in<br />
cardiovascular disease, part II: pathophysiology, clinical importance,<br />
and management <strong>of</strong> right ventricular failure. Circulation 2008;117:<br />
1717-31.<br />
22. Burgess MI, Mogulkoc N, Bright-Thomas RJ, Bishop P, Egan JJ, Ray SG.<br />
Comparison <strong>of</strong> echocardiographic markers <strong>of</strong> right ventricular function<br />
in determining prognosis in chronic pulmonary disease. J Am Soc Echocardiogr<br />
2002;15:633-9.<br />
23. Quiroz R, Kucher N, Schoepf UJ, Kipfmueller F, Solomon SD, Costello P,<br />
et al. <strong>Right</strong> ventricular enlargement on chest computed tomography:<br />
prognostic role in acute pulmonary embolism. Circulation 2004;109:<br />
2401-4.<br />
24. Fremont B, Pacouret G, Jacobi D, Puglisi R, Charbonnier B, de Labriolle A.<br />
Prognostic value <strong>of</strong> echocardiographic right/left ventricular end-diastolic<br />
diameter ratio in patients with acute pulmonary embolism: results from<br />
a monocenter registry <strong>of</strong> 1,416 patients. Chest 2008;133:358-62.<br />
25. Lai WW, Gauvreau K, Rivera ES, Saleeb S, Powell AJ, Geva T. Accuracy<br />
<strong>of</strong> guideline recommendations <strong>for</strong> two-dimensional quantification <strong>of</strong> <strong>the</strong><br />
right ventricle by echocardiography. Int J Cardiovasc Imaging 2008;24:<br />
691-8.<br />
26. Karunanithi MK, Feneley MP. Limitations <strong>of</strong> unidimensional indexes <strong>of</strong><br />
right ventricular contractile function in conscious dogs. J Thorac Cardiovasc<br />
Surg 2000;120:302-12.<br />
27. Foale RA, Nihoyannopoulos P, Ribeiro P, McKenna WJ, Oakley CM,<br />
Krikler DM, et al. <strong>Right</strong> ventricular abnormalities in ventricular tachycardia<br />
<strong>of</strong> right ventricular origin: relation to electrophysiological abnormalities.<br />
Br <strong>Heart</strong> J 1986;56:45-54.<br />
28. Sugishita Y, Watanabe M, Fisher SA. The development <strong>of</strong> <strong>the</strong> embryonic<br />
outflow tract provides novel insights into cardiac differentiation and remodeling.<br />
Trends Cardiovasc Med 2004;14:235-41.<br />
29. Dell’Italia LJ. The right ventricle: anatomy, physiology, and clinical importance.<br />
Curr Probl Cardiol 1991;16:653-720.<br />
30. Geva T, Powell AJ, Craw<strong>for</strong>d EC, Chung T, Colan SD. Evaluation <strong>of</strong> regional<br />
differences in right ventricular systolic function by acoustic quantification<br />
echocardiography and cine magnetic resonance imaging.<br />
Circulation 1998;98:339-45.
Journal <strong>of</strong> <strong>the</strong> American Society <strong>of</strong> Echocardiography<br />
Volume 23 Number 7<br />
31. Bashore TM. Adult congenital heart disease: right ventricular outflow<br />
tract lesions. Circulation 2007;115:1933-47.<br />
32. Arya A, Piorkowski C, Sommer P, Gerds-Li JH, Kottkamp H,<br />
Hindricks G. Idiopathic outflow tract tachycardias: current perspectives.<br />
Herz 2007;32:218-25.<br />
33. Yoerger DM, Marcus F, Sherrill D, Calkins H, Towbin JA, Zareba W, et al.<br />
<strong>Echocardiographic</strong> findings in patients meeting task <strong>for</strong>ce criteria <strong>for</strong> arrhythmogenic<br />
right ventricular dysplasia: new insights from <strong>the</strong> multidisciplinary<br />
study <strong>of</strong> right ventricular dysplasia. J Am Coll Cardiol 2005;45:<br />
860-5.<br />
34. Anwar AM, Soliman O, van den Bosch AE, McGhie JS, Geleijnse ML, ten<br />
Cate FJ, et al. <strong>Assessment</strong> <strong>of</strong> pulmonary valve and right ventricular outflow<br />
tract with real-time three-dimensional echocardiography. Int J Cardiovasc<br />
Imaging 2007;23:167-75.<br />
35. Anavekar NS, Gerson D, Skali H, Kwong RY, Yucel EK, Solomon SD.<br />
Two-dimensional assessment <strong>of</strong> right ventricular function: an<br />
echocardiographic-MRI correlative study. Echocardiography 2007;24:<br />
452-6.<br />
36. Nass N, McConnell MV, Goldhaber SZ, Chyu S, Solomon SD. Recovery<br />
<strong>of</strong> regional right ventricular function after thrombolysis <strong>for</strong> pulmonary<br />
embolism. Am J Cardiol 1999;83:804-6.<br />
37. Zorn<strong>of</strong>f LA, Skali H, Pfeffer MA, St John SM, Rouleau JL, Lamas GA, et al.<br />
<strong>Right</strong> ventricular dysfunction and risk <strong>of</strong> heart failure and mortality after<br />
myocardial infarction. J Am Coll Cardiol 2002;39:1450-5.<br />
38. Anavekar NS, Skali H, Bourgoun M, Ghali JK, Kober L, Maggioni AP,<br />
et al. Usefulness <strong>of</strong> right ventricular fractional area change to predict<br />
death, heart failure, and stroke following myocardial infarction (from<br />
<strong>the</strong> VALIANT ECHO study). Am J Cardiol 2008;101:607-12.<br />
39. Jiang L, Levine RA, Weyman AE. <strong>Echocardiographic</strong> assessment <strong>of</strong> right<br />
ventricular volume and function. Echocardiography 1997;14:189-206.<br />
40. Helbing WA, Bosch HG, Maliepaard C, Rebergen SA, van der Geest RJ,<br />
Hansen B, et al. Comparison <strong>of</strong> echocardiographic methods with magnetic<br />
resonance imaging <strong>for</strong> assessment <strong>of</strong> right ventricular function in<br />
children. Am J Cardiol 1995;76:589-94.<br />
41. Starling MR, Craw<strong>for</strong>d MH, Sorensen SG, O’Rourke RA. A new twodimensional<br />
echocardiographic technique <strong>for</strong> evaluating right ventricular<br />
size and per<strong>for</strong>mance in patients with obstructive lung disease. Circulation<br />
1982;66:612-20.<br />
42. Silverman NH, Hudson S. Evaluation <strong>of</strong> right ventricular volume and<br />
ejection fraction in children by two-dimensional echocardiography. Pediatr<br />
Cardiol 1983;4:197-203.<br />
43. Gopal AS, Chukwu EO, Iwuchukwu CJ, Katz AS, Toole RS, Schapiro W,<br />
et al. Normal values <strong>of</strong> right ventricular size and function by real-time 3dimensional<br />
echocardiography: comparison with cardiac magnetic resonance<br />
imaging. J Am Soc Echocardiogr 2007;20:445-55.<br />
44. Watanabe T, Katsume H, Matsukubo H, Furukawa K, Ijichi H. Estimation<br />
<strong>of</strong> right ventricular volume with two dimensional echocardiography. Am<br />
J Cardiol 1982;49:1946-53.<br />
45. Linker DT, Moritz WE, Pearlman AS. A new three-dimensional echocardiographic<br />
method <strong>of</strong> right ventricular volume measurement: in vitro validation.<br />
J Am Coll Cardiol 1986;8:101-6.<br />
46. Fei HW, Wang XF, Xie MX, Zhuang L, Chen LX, Yang Y, et al. Validation<br />
<strong>of</strong> real-time three-dimensional echocardiography <strong>for</strong> quantifying left and<br />
right ventricular volumes: an experimental study. Chin Med J (Engl)<br />
2004;117:695-9.<br />
47. Schindera ST, Mehwald PS, Sahn DJ, Kececioglu D. Accuracy <strong>of</strong> real-time<br />
three-dimensional echocardiography <strong>for</strong> quantifying right ventricular<br />
volume: static and pulsatile flow studies in an anatomic in vitro model.<br />
J Ultrasound Med 2002;21:1069-75.<br />
48. Hoch M, Vasilyev NV, Soriano B, Gauvreau K, Marx GR. Variables influencing<br />
<strong>the</strong> accuracy <strong>of</strong> right ventricular volume assessment by real-time<br />
3-dimensional echocardiography: an in vitro validation study. J Am Soc<br />
Echocardiogr 2007;20:456-61.<br />
49. Grison A, Maschietto N, Reffo E, Stellin G, Padalino M, Vida V, et al.<br />
Three-dimensional echocardiographic evaluation <strong>of</strong> right ventricular volume<br />
and function in pediatric patients: validation <strong>of</strong> <strong>the</strong> technique. J Am<br />
Soc Echocardiogr 2007;20:921-9.<br />
Rudski et al 709<br />
50. Heusch A, Lawrenz W, Olivier M, Schmidt KG. Transesophageal 3-dimensional<br />
versus cross-sectional echocardiographic assessment <strong>of</strong> <strong>the</strong><br />
volume <strong>of</strong> <strong>the</strong> right ventricle in children with atrial septal defects. Cardiol<br />
Young 2006;16:135-40.<br />
51. Nesser HJ, Tkalec W, Patel AR, Masani ND, Niel J, Markt B, et al. Quantitation<br />
<strong>of</strong> right ventricular volumes and ejection fraction by threedimensional<br />
echocardiography in patients: comparison with magnetic<br />
resonance imaging and radionuclide ventriculography. Echocardiography<br />
2006;23:666-80.<br />
52. Horton KD, Meece RW, Hill JC. <strong>Assessment</strong> <strong>of</strong> <strong>the</strong> right ventricle by<br />
echocardiography: a primer <strong>for</strong> cardiac sonographers. J Am Soc Echocardiogr<br />
2009;22:776-92.<br />
53. Endo Y, Maddukuri PV, Vieira ML, Pandian NG, Patel AR. Quantification<br />
<strong>of</strong> right ventricular volumes and function by real time three-dimensional<br />
echocardiographic longitudinal axial plane method: validation in <strong>the</strong> clinical<br />
setting. Echocardiography 2006;23:853-9.<br />
54. Lu X, Nadvoretskiy V, Bu L, Stolpen A, Ayres N, Pignatelli RH, et al. Accuracy<br />
and reproducibility <strong>of</strong> real-time three-dimensional echocardiography<br />
<strong>for</strong> assessment <strong>of</strong> right ventricular volumes and ejection fraction in<br />
children. J Am Soc Echocardiogr 2008;21:84-9.<br />
55. Niemann PS, Pinho L, Balbach T, Galuschky C, Blankenhagen M,<br />
Silberbach M, et al. Anatomically oriented right ventricular volume measurements<br />
with dynamic three-dimensional echocardiography validated<br />
by 3-Tesla magnetic resonance imaging. J Am Coll Cardiol 2007;50:<br />
1668-76.<br />
56. Papavassiliou DP, Parks WJ, Hopkins KL, Fyfe DA. Three-dimensional<br />
echocardiographic measurement <strong>of</strong> right ventricular volume in children<br />
with congenital heart disease validated by magnetic resonance imaging.<br />
J Am Soc Echocardiogr 1998;11:770-7.<br />
57. Vogel M, Gutberlet M, Dittrich S, Hosten N, Lange PE. Comparison <strong>of</strong><br />
transthoracic three dimensional echocardiography with magnetic resonance<br />
imaging in <strong>the</strong> assessment <strong>of</strong> right ventricular volume and mass.<br />
<strong>Heart</strong> 1997;78:127-30.<br />
58. Fujimoto S, Mizuno R, Nakagawa Y, Dohi K, Nakano H. Estimation <strong>of</strong><br />
<strong>the</strong> right ventricular volume and ejection fraction by transthoracic<br />
three-dimensional echocardiography. A validation study using magnetic<br />
resonance imaging. Int J Card Imaging 1998;14:385-90.<br />
59. Kjaergaard J, Sogaard P, Hassager C. Quantitative echocardiographic<br />
analysis <strong>of</strong> <strong>the</strong> right ventricle in healthy individuals. J Am Soc Echocardiogr<br />
2006;19:1365-72.<br />
60. Jenkins C, Chan J, Bricknell K, Strudwick M, Marwick TH. Reproducibility<br />
<strong>of</strong> right ventricular volumes and ejection fraction using real-time<br />
three-dimensional echocardiography: comparison with cardiac MRI.<br />
Chest 2007;131:1844-51.<br />
61. Leibundgut G, Rohner A, Grize L, Bernheim A, Kessel-Schaefer A,<br />
Bremerich J, et al. Dynamic assessment <strong>of</strong> right ventricular volumes<br />
and function by real-time three-dimensional echocardiography: a comparison<br />
study with magnetic resonance imaging in 100 adult patients.<br />
J Am Soc Echocardiogr 2010;23:116-26.<br />
62. van der Zwaan HB, Helbing WA, McGhie JS, Geleijnse ML,<br />
Luijnenburg SE, Roos-Hesselink JW, et al. Clinical value <strong>of</strong> real-time<br />
three-dimensional echocardiography <strong>for</strong> right ventricular quantification<br />
in congenital heart disease: validation with cardiac magnetic resonance<br />
imaging. J Am Soc Echocardiogr 2010;23:134-40.<br />
63. Grewal J, Majdalany D, Syed I, Pellikka P, Warnes CA. Three-dimensional<br />
echocardiographic assessment <strong>of</strong> right ventricular volume and function<br />
in adult patients with congenital heart disease: comparison with magnetic<br />
resonance imaging. J Am Soc Echocardiogr 2010;23:127-33.<br />
64. Tamborini G, Marsan NA, Gripari P, Maffessanti F, Brusoni D,<br />
Muratori M, et al. Reference values <strong>for</strong> right ventricular volumes and<br />
ejection fraction with real-time three-dimensional echocardiography:<br />
evaluation in a large series <strong>of</strong> normal subjects. J Am Soc Echocardiogr<br />
2010;23:109-15.<br />
65. Lin SS, Reynertson SI, Louie EK, Levitsky S. <strong>Right</strong> ventricular volume<br />
overload results in depression <strong>of</strong> left ventricular ejection fraction. Implications<br />
<strong>for</strong> <strong>the</strong> surgical management <strong>of</strong> tricuspid valve disease. Circulation<br />
1994;90:II209-13.
710 Rudski et al Journal <strong>of</strong> <strong>the</strong> American Society <strong>of</strong> Echocardiography<br />
July 2010<br />
66. Louie EK, Bieniarz T, Moore AM, Levitsky S. Reduced atrial contribution<br />
to left ventricular filling in patients with severe tricuspid regurgitation after<br />
tricuspid valvulectomy: a Doppler echocardiographic study. J Am<br />
Coll Cardiol 1990;16:1617-24.<br />
67. Reynertson SI, Kundur R, Mullen GM, Costanzo MR, McKiernan TL,<br />
Louie EK. Asymmetry <strong>of</strong> right ventricular enlargement in response to tricuspid<br />
regurgitation. Circulation 1999;100:465-7.<br />
68. Ryan T, Petrovic O, Dillon JC, Feigenbaum H, Conley MJ, Armstrong WF.<br />
An echocardiographic index <strong>for</strong> separation <strong>of</strong> right ventricular volume<br />
and pressure overload. J Am Coll Cardiol 1985;5:918-27.<br />
69. Louie EK, Rich S, Levitsky S, Brundage BH. Doppler echocardiographic<br />
demonstration <strong>of</strong> <strong>the</strong> differential effects <strong>of</strong> right ventricular pressure and<br />
volume overload on left ventricular geometry and filling. J Am Coll Cardiol<br />
1992;19:84-90.<br />
70. Mori S, Nakatani S, Kanzaki H, Yamagata K, Take Y, Matsuura Y, et al.<br />
Patterns <strong>of</strong> <strong>the</strong> interventricular septal motion can predict conditions <strong>of</strong><br />
patients with pulmonary hypertension. J Am Soc Echocardiogr 2008;<br />
21:386-93.<br />
71. Galie N, Hinderliter AL, Torbicki A, Fourme T, Simonneau G, Pulido T,<br />
et al. Effects <strong>of</strong> <strong>the</strong> oral endo<strong>the</strong>lin-receptor antagonist bosentan on echocardiographic<br />
and doppler measures in patients with pulmonary arterial<br />
hypertension. J Am Coll Cardiol 2003;41:1380-6.<br />
72. Raymond RJ, Hinderliter AL, Willis PW, Ralph D, Caldwell EJ,<br />
Williams W, et al. <strong>Echocardiographic</strong> predictors <strong>of</strong> adverse outcomes<br />
in primary pulmonary hypertension. J Am Coll Cardiol 2002;39:1214-9.<br />
73. Badesch DB, Champion HC, Sanchez MA, Hoeper MM, Loyd JE,<br />
Manes A, et al. Diagnosis and assessment <strong>of</strong> pulmonary arterial hypertension.<br />
J Am Coll Cardiol 2009;54:S55-66.<br />
74. Lam CS, Borlaug BA, Kane GC, Enders FT, Rodeheffer RJ, Redfield MM.<br />
Age-associated increases in pulmonary artery systolic pressure in <strong>the</strong> general<br />
population. Circulation 2009;119:2663-70.<br />
75. McQuillan BM, Picard MH, Leavitt M, Weyman AE. Clinical correlates<br />
and reference intervals <strong>for</strong> pulmonary artery systolic pressure among<br />
echocardiographically normal subjects. Circulation 2001;104:<br />
2797-802.<br />
76. McLaughlin VV, Archer SL, Badesch DB, Barst RJ, Farber HW, Lindner JR,<br />
et al. ACCF/AHA 2009 expert consensus document on pulmonary hypertension:<br />
a report <strong>of</strong> <strong>the</strong> American College <strong>of</strong> Cardiology Foundation<br />
Task Force on Expert Consensus Documents and <strong>the</strong> American <strong>Heart</strong><br />
Association developed in collaboration with <strong>the</strong> American College <strong>of</strong><br />
Chest Physicians; American Thoracic Society, Inc.; and <strong>the</strong> Pulmonary<br />
Hypertension Association. J Am Coll Cardiol 2009;53:1573-619.<br />
77. Yock PG, Popp RL. Noninvasive estimation <strong>of</strong> right ventricular systolic<br />
pressure by Doppler ultrasound in patients with tricuspid regurgitation.<br />
Circulation 1984;70:657-62.<br />
78. Currie PJ, Seward JB, Chan KL, Fyfe DA, Hagler DJ, Mair DD, et al. Continuous<br />
wave Doppler determination <strong>of</strong> right ventricular pressure: a simultaneous<br />
Doppler-ca<strong>the</strong>terization study in 127 patients. J Am Coll<br />
Cardiol 1985;6:750-6.<br />
79. Fisher MR, Forfia PR, Chamera E, Housten-Harris T, Champion HC,<br />
Girgis RE, et al. Accuracy <strong>of</strong> Doppler echocardiography in <strong>the</strong> hemodynamic<br />
assessment <strong>of</strong> pulmonary hypertension. Am J Respir Crit Care<br />
Med 2009;179:615-21.<br />
80. Hinderliter AL, Willis PW, Barst RJ, Rich S, Rubin LJ, Badesch DB, et al.,<br />
Primary Pulmonary Hypertension Study Group. Effects <strong>of</strong> long-term infusion<br />
<strong>of</strong> prostacyclin (epoprostenol) on echocardiographic measures <strong>of</strong><br />
right ventricular structure and function in primary pulmonary hypertension.<br />
Circulation 1997;95:1479-86.<br />
81. Mahan G, Dabestani A, Gardin J, Allfie A, Burn C, Henry W. Estimation <strong>of</strong><br />
pulmonary artery pressure by pulsed Doppler echocardiography. Circulation<br />
1983;68:367.<br />
82. Dabestani A, Mahan G, Gardin JM, Takenaka K, Burn C, Allfie A, et al.<br />
Evaluation <strong>of</strong> pulmonary artery pressure and resistance by pulsed Doppler<br />
echocardiography. Am J Cardiol 1987;59:662-8.<br />
83. Abbas AE, Fortuin FD, Schiller NB, Appleton CP, Moreno CA, Lester SJ.<br />
<strong>Echocardiographic</strong> determination <strong>of</strong> mean pulmonary artery pressure.<br />
Am J Cardiol 2003;92:1373-6.<br />
84. Aduen JF, Castello R, Lozano MM, Hepler GN, Keller CA, Alvarez F,<br />
et al. An alternative echocardiographic method to estimate mean pulmonary<br />
artery pressure: diagnostic and clinical implications. J Am Soc Echocardiogr<br />
2009;22:814-9.<br />
85. Ristow B, Schiller NB. Stepping away from ritual right heart ca<strong>the</strong>terization<br />
into <strong>the</strong> era <strong>of</strong> noninvasively measured pulmonary artery pressure.<br />
J Am Soc Echocardiogr 2009;22:820-2.<br />
86. Milan A, Magnino C, Veglio F. <strong>Echocardiographic</strong> indexes <strong>for</strong> <strong>the</strong> noninvasive<br />
evaluation <strong>of</strong> pulmonary hemodynamics. J Am Soc Echocardiogr<br />
2010;23:225-39.<br />
87. Abbas AE, Fortuin FD, Schiller NB, Appleton CP, Moreno CA, Lester SJ.<br />
A simple method <strong>for</strong> noninvasive estimation <strong>of</strong> pulmonary vascular resistance.<br />
J Am Coll Cardiol 2003;41:1021-7.<br />
88. Farzaneh-Far R, McKeown BH, Dang D, Roberts J, Schiller NB, Foster E.<br />
Accuracy <strong>of</strong> Doppler-estimated pulmonary vascular resistance in patients<br />
be<strong>for</strong>e liver transplantation. Am J Cardiol 2008;101:259-62.<br />
89. Farzaneh-Far R, Na B, Whooley MA, Schiller NB. Usefulness <strong>of</strong> noninvasive<br />
estimate <strong>of</strong> pulmonary vascular resistance to predict mortality, heart<br />
failure, and adverse cardiovascular events in patients with stable coronary<br />
artery disease (from <strong>the</strong> <strong>Heart</strong> and Soul Study). Am J Cardiol<br />
2008;101:762-6.<br />
90. Rajagopalan N, Simon MA, Suffoletto MS, Shah H, Edelman K,<br />
Mathier MA, et al. Noninvasive estimation <strong>of</strong> pulmonary vascular<br />
resistance in pulmonary hypertension. Echocardiography 2009;26:<br />
489-94.<br />
91. Grunig E, Weissmann S, Ehlken N, Fijalkowska A, Fischer C, Fourme T,<br />
et al. Stress Doppler echocardiography in relatives <strong>of</strong> patients with idiopathic<br />
and familial pulmonary arterial hypertension: results <strong>of</strong> a multicenter<br />
European analysis <strong>of</strong> pulmonary artery pressure response to exercise<br />
and hypoxia. Circulation 2009;119:1747-57.<br />
92. Bossone E, Rubenfire M, Bach DS, Ricciardi M, Armstrong WF. Range <strong>of</strong><br />
tricuspid regurgitation velocity at rest and during exercise in normal adult<br />
men: implications <strong>for</strong> <strong>the</strong> diagnosis <strong>of</strong> pulmonary hypertension. J Am<br />
Coll Cardiol 1999;33:1662-6.<br />
93. Scapellato F, Temporelli PL, Eleuteri E, Corra U, Imparato A, Giannuzzi P.<br />
Accurate noninvasive estimation <strong>of</strong> pulmonary vascular resistance by<br />
Doppler echocardiography in patients with chronic failure heart failure.<br />
J Am Coll Cardiol 2001;37:1813-9.<br />
94. Dehnert C, Grunig E, Mereles D, von Lennep N, Bartsch P. Identification<br />
<strong>of</strong> individuals susceptible to high-altitude pulmonary oedema at low altitude.<br />
Eur Respir J 2005;25:545-51.<br />
95. Grunig E, Janssen B, Mereles D, Barth U, Borst MM, Vogt IR, et al. Abnormal<br />
pulmonary artery pressure response in asymptomatic carriers<br />
<strong>of</strong> primary pulmonary hypertension gene. Circulation 2000;102:<br />
1145-50.<br />
96. Bidart CM, Abbas AE, Parish JM, Chaliki HP, Moreno CA, Lester SJ. The<br />
noninvasive evaluation <strong>of</strong> exercise-induced changes in pulmonary artery<br />
pressure and pulmonary vascular resistance. J Am Soc Echocardiogr<br />
2007;20:270-5.<br />
97. Gleason WL, Braunwald E. Studies on <strong>the</strong> first derivative <strong>of</strong> <strong>the</strong> ventricular<br />
pressure pulse in man. J Clin Invest 1962;41:80-91.<br />
98. Anconina J, Danchin N, Selton-Suty C, Isaaz K, Juilliere Y, Buffet P, et al.<br />
Measurement <strong>of</strong> right ventricular dP/dt. A simultaneous/comparative<br />
hemodynamic and Doppler echocardiographic study [article in French].<br />
Arch Mal Coeur Vaiss 1992;85:1317-21.<br />
99. Anconina J, Danchin N, Selton-Suty C, Isaaz K, Juilliere Y, Buffet P, et al.<br />
Noninvasive estimation <strong>of</strong> right ventricular dP/dt in patients with tricuspid<br />
valve regurgitation. Am J Cardiol 1993;71:1495-7.<br />
100. Tei C, Dujardin KS, Hodge DO, Bailey KR, McGoon MD, Tajik AJ, et al.<br />
Doppler echocardiographic index <strong>for</strong> assessment <strong>of</strong> global right ventricular<br />
function. J Am Soc Echocardiogr 1996;9:838-47.<br />
101. Yoshifuku S, Otsuji Y, Takasaki K, Yuge K, Kisanuki A, Toyonaga K, et al.<br />
Pseudonormalized Doppler total ejection isovolume (Tei) index in patients<br />
with right ventricular acute myocardial infarction. Am J Cardiol<br />
2003;91:527-31.<br />
102. Rojo EC, Rodrigo JL, Perez de Isla L, Almeria C, Gonzalo N, Aubele A,<br />
et al. Disagreement between tissue Doppler imaging and conventional
Journal <strong>of</strong> <strong>the</strong> American Society <strong>of</strong> Echocardiography<br />
Volume 23 Number 7<br />
pulsed wave Doppler in <strong>the</strong> measurement <strong>of</strong> myocardial per<strong>for</strong>mance<br />
index. Eur J Echocardiogr 2006;7:356-64.<br />
103. Gaibazzi N, Petrucci N, Ziacchi V. Left ventricle myocardial per<strong>for</strong>mance<br />
index derived ei<strong>the</strong>r by conventional method or mitral annulus tissue-<br />
Doppler: a comparison study in healthy subjects and subjects with heart<br />
failure. J Am Soc Echocardiogr 2005;18:1270-6.<br />
104. Sebbag I, Rudski LG, Therrien J, Hirsch A, Langleben D. Effect <strong>of</strong><br />
chronic infusion <strong>of</strong> epoprostenol on echocardiographic right ventricular<br />
myocardial per<strong>for</strong>mance index and its relation to clinical outcome in<br />
patients with primary pulmonary hypertension. Am J Cardiol 2001;<br />
88:1060-3.<br />
105. Abd El Rahman MY, Abdul-Khaliq H, Vogel M, Alexi-Meskischvili V,<br />
Gutberlet M, Hetzer R, et al. Value <strong>of</strong> <strong>the</strong> new Doppler-derived myocardial<br />
per<strong>for</strong>mance index <strong>for</strong> <strong>the</strong> evaluation <strong>of</strong> right and left ventricular<br />
function following repair <strong>of</strong> tetralogy <strong>of</strong> Fallot. Pediatr Cardiol 2002;<br />
23:502-7.<br />
106. Chockalingam A, Gnanavelu G, Alagesan R, Subramaniam T. Myocardial<br />
per<strong>for</strong>mance index in evaluation <strong>of</strong> acute right ventricular myocardial<br />
infarction. Echocardiography 2004;21:487-94.<br />
107. Eidem BW, O’Leary PW, Tei C, Seward JB. Usefulness <strong>of</strong> <strong>the</strong> myocardial<br />
per<strong>for</strong>mance index <strong>for</strong> assessing right ventricular function in congenital<br />
heart disease. Am J Cardiol 2000;86:654-8.<br />
108. Moller JE, Sondergaard E, Poulsen SH, Appleton CP, Egstrup K. Serial<br />
Doppler echocardiographic assessment <strong>of</strong> left and right ventricular per<strong>for</strong>mance<br />
after a first myocardial infarction. J Am Soc Echocardiogr<br />
2001;14:249-55.<br />
109. Morner S, Lindqvist P, Waldenstrom A, Kazzam E. <strong>Right</strong> ventricular dysfunction<br />
in hypertrophic cardiomyopathy as evidenced by <strong>the</strong> myocardial<br />
per<strong>for</strong>mance index. Int J Cardiol 2008;124:57-63.<br />
110. Schwerzmann M, Samman AM, Salehian O, Holm J, Provost Y,<br />
Webb GD, et al. Comparison <strong>of</strong> echocardiographic and cardiac magnetic<br />
resonance imaging <strong>for</strong> assessing right ventricular function in adults with<br />
repaired tetralogy <strong>of</strong> Fallot. Am J Cardiol 2007;99:1593-7.<br />
111. Kaul S, Tei C, Hopkins JM, Shah PM. <strong>Assessment</strong> <strong>of</strong> right ventricular function<br />
using two-dimensional echocardiography. Am <strong>Heart</strong> J 1984;107:<br />
526-31.<br />
112. Lopez-Candales A, Dohi K, Rajagopalan N, Edelman K, Gulyasy B,<br />
Bazaz R. Defining normal variables <strong>of</strong> right ventricular size and function<br />
in pulmonary hypertension: an echocardiographic study. Postgrad Med J<br />
2008;84:40-5.<br />
113. Miller D, Farah MG, Liner A, Fox K, Schluchter M, Hoit BD. The relation<br />
between quantitative right ventricular ejection fraction and indices <strong>of</strong> tricuspid<br />
annular motion and myocardial per<strong>for</strong>mance. J Am Soc Echocardiogr<br />
2004;17:443-7.<br />
114. Tamborini G, Pepi M, Galli CA, Maltagliati A, Celeste F, Muratori M, et al.<br />
Feasibility and accuracy <strong>of</strong> a routine echocardiographic assessment <strong>of</strong><br />
right ventricular function. Int J Cardiol 2007;115:86-9.<br />
115. Lindqvist P, Waldenstrom A, Henein M, Morner S, Kazzam E. Regional<br />
and global right ventricular function in healthy individuals aged 20-90<br />
years: a pulsed Doppler tissue imaging study: Umea General Population<br />
<strong>Heart</strong> Study. Echocardiography 2005;22:305-14.<br />
116. Kukulski T, Hubbert L, Arnold M, Wranne B, Hatle L, Su<strong>the</strong>rland GR.<br />
Normalregional rightventricular function and its change with age: a Doppler<br />
myocardial imaging study. J Am Soc Echocardiogr 2000;13:194-204.<br />
117. Nikitin NP, Witte KK, Thackray SD, de Silva R, Clark AL, Cleland JG.<br />
Longitudinal ventricular function: normal values <strong>of</strong> atrioventricular annular<br />
and myocardial velocities measured with quantitative twodimensional<br />
color Doppler tissue imaging. J Am Soc Echocardiogr<br />
2003;16:906-21.<br />
118. Duan YY, Harada K, Toyono M, Ishii H, Tamura M, Takada G. Effects <strong>of</strong><br />
acute preload reduction on myocardial velocity during isovolumic contraction<br />
and myocardial acceleration in pediatric patients. Pediatr Cardiol<br />
2006;27:32-6.<br />
119. Kjaergaard J, Snyder EM, Hassager C, Oh JK, Johnson BD. Impact <strong>of</strong> preload<br />
and afterload on global and regional right ventricular function and<br />
pressure: a quantitative echocardiography study. J Am Soc Echocardiogr<br />
2006;19:515-21.<br />
Rudski et al 711<br />
120. Pauliks LB, Chan KC, Chang D, Kirby SK, Logan L, DeGr<strong>of</strong>f CG, et al.<br />
Regional myocardial velocities and isovolumic contraction acceleration<br />
be<strong>for</strong>e and after device closure <strong>of</strong> atrial septal defects: a color tissue<br />
Doppler study. Am <strong>Heart</strong> J 2005;150:294-301.<br />
121. Vogel M, Schmidt MR, Kristiansen SB, Cheung M, White PA, Sorensen K,<br />
et al. Validation <strong>of</strong> myocardial acceleration during isovolumic contraction<br />
as a novel noninvasive index <strong>of</strong> right ventricular contractility: comparison<br />
with ventricular pressure-volume relations in an animal model. Circulation<br />
2002;105:1693-9.<br />
122. Tousignant CP, Bowry R, Levesque S, Denault AY. Regional differences<br />
in color tissue Doppler-derived measures <strong>of</strong> longitudinal right ventricular<br />
function using transesophageal and transthoracic echocardiography.<br />
J Cardiothorac Vasc Anesth 2008;22:400-5.<br />
123. Tugcu A, Guzel D, Yildirimturk O, Aytekin S. Evaluation <strong>of</strong> right ventricular<br />
systolic and diastolic function in patients with newly diagnosed obstructive<br />
sleep apnea syndrome without hypertension. Cardiology<br />
2009;113:184-92.<br />
124. Sade LE, Ozin B, Ulus T, Acikel S, Pirat B, Bilgi M, et al. <strong>Right</strong> ventricular<br />
contractile reserve in mitral stenosis: implications on hemodynamic burden<br />
and clinical outcome. Int J Cardiol 2009;135:193-201.<br />
125. Tayyareci Y, Nisanci Y, Umman B, Oncul A, Yurdakul S, Altun I, et al.<br />
Early detection <strong>of</strong> right ventricular systolic dysfunction by using myocardial<br />
acceleration during isovolumic contraction in patients with mitral stenosis.<br />
Eur J Echocardiogr 2008;9:516-21.<br />
126. Toyono M, Harada K, Tamura M, Yamamoto F, Takada G. Myocardial acceleration<br />
during isovolumic contraction as a new index <strong>of</strong> right ventricular<br />
contractile function and its relation to pulmonary regurgitation in<br />
patients after repair <strong>of</strong> tetralogy <strong>of</strong> Fallot. J Am Soc Echocardiogr<br />
2004;17:332-7.<br />
127. Vogel M, Derrick G, White PA, Cullen S, Aichner H, Deanfield J, et al. Systemic<br />
ventricular function in patients with transposition <strong>of</strong> <strong>the</strong> great arteries<br />
after atrial repair: a tissue Doppler and conductance ca<strong>the</strong>ter<br />
study. J Am Coll Cardiol 2004;43:100-6.<br />
128. Vogel M, Vogt M. Noninvasive assessment <strong>of</strong> right ventricular contractile<br />
per<strong>for</strong>mance. In: Redington AN, Van Arsdell GS, Anderson RH, editors.<br />
Congenital diseases in <strong>the</strong> right heart. London: Springer; 2009. pp. 207-12.<br />
129. Jamal F, Bergerot C, Argaud L, Loufouat J, Ovize M. Longitudinal strain<br />
quantitates regional right ventricular contractile function. Am J Physiol<br />
<strong>Heart</strong> Circ Physiol 2003;285:H2842-7.<br />
130. Berg S. Myocardial Strain Rate by Doppler Ultrasound Methods. Angle<br />
dependency and error estimation. Master’s <strong>the</strong>sis, Department <strong>of</strong> Engineering<br />
Cybernetics, NTNU, Trondheim, Norway 2004.<br />
131. Su<strong>the</strong>rland GR, Di Salvo G, Claus P, D’hooge J, Bijnens B. Strain and<br />
strain rate imaging: a new clinical approach to quantifying regional myocardial<br />
function. J Am Soc Echocardiogr 2004;17:788-802.<br />
132. Kjaergaard J, Sogaard P, Hassager C. <strong>Right</strong> ventricular strain in pulmonary<br />
embolism by Doppler tissue echocardiography. J Am Soc Echocardiogr<br />
2004;17:1210-2.<br />
133. Kittipovanonth M, Bellavia D, Chandrasekaran K, Villarraga HR,<br />
Abraham TP, Pellikka PA. Doppler myocardial imaging <strong>for</strong> early detection<br />
<strong>of</strong> right ventricular dysfunction in patients with pulmonary hypertension.<br />
J Am Soc Echocardiogr 2008;21:1035-41.<br />
134. Chow PC, Liang XC, Cheung EW, Lam WW, Cheung YF. New twodimensional<br />
global longitudinal strain and strain rate imaging <strong>for</strong> assessment<br />
<strong>of</strong> systemic right ventricular function. <strong>Heart</strong> 2008;94:855-9.<br />
135. Koyama J, Ray-Sequin PA, Falk RH. Longitudinal myocardial function assessed<br />
by tissue velocity, strain, and strain rate tissue Doppler echocardiography<br />
in patients with AL (primary) cardiac amyloidosis. Circulation<br />
2003;107:2446-52.<br />
136. Lindqvist P, Ol<strong>of</strong>sson BO, Backman C, Suhr O, Waldenstrom A. Pulsed<br />
tissue Doppler and strain imaging discloses early signs <strong>of</strong> infiltrative cardiac<br />
disease: a study on patients with familial amyloidotic polyneuropathy.<br />
Eur J Echocardiogr 2006;7:22-30.<br />
137. Sun JP, Stewart WJ, Yang XS, Donnell RO, Leon AR, Felner JM, et al. Differentiation<br />
<strong>of</strong> hypertrophic cardiomyopathy and cardiac amyloidosis<br />
from o<strong>the</strong>r causes <strong>of</strong> ventricular wall thickening by two-dimensional<br />
strain imaging echocardiography. Am J Cardiol 2009;103:411-5.
712 Rudski et al Journal <strong>of</strong> <strong>the</strong> American Society <strong>of</strong> Echocardiography<br />
July 2010<br />
138. Fujii J, Yazaki Y, Sawada H, Aizawa T, Watanabe H, Kato K. Noninvasive<br />
assessment <strong>of</strong> left and right ventricular filling in myocardial infarction<br />
with a two-dimensional Doppler echocardiographic method. J Am Coll<br />
Cardiol 1985;5:1155-60.<br />
139. Yanase O, Motomiya T, Tejima T, Nomura S. Doppler echocardiographic<br />
assessment <strong>of</strong> right ventricular filling characteristics in hemodynamically<br />
significant right ventricular infarction. Am J Noninvasiv Cardiol 1992;6:<br />
230-6.<br />
140. Yilmaz M, Erol MK, Acikel M, Sevimli S, Alp N. Pulsed Doppler tissue<br />
imaging can help to identify patients with right ventricular infarction.<br />
<strong>Heart</strong> Vessels 2003;18:112-6.<br />
141. Berman GO, Reichek N, Brownson D, Douglas PS. Effects <strong>of</strong> sample volume<br />
location, imaging view, heart rate and age on tricuspid velocimetry<br />
in normal subjects. Am J Cardiol 1990;65:1026-30.<br />
142. Bove AA, Santamore WP. Ventricular interdependence. Prog Cardiovasc<br />
Dis 1981;23:365-88.<br />
143. Courtois M, Barzilai B, Gutierrez F, Ludbrook PA. Characterization <strong>of</strong> regional<br />
diastolic pressure gradients in <strong>the</strong> right ventricle. Circulation 1990;<br />
82:1413-23.<br />
144. Dell’Italia LJ, Walsh RA. <strong>Right</strong> ventricular diastolic pressure-volume relations<br />
and regional dimensions during acute alterations in loading conditions.<br />
Circulation 1988;77:1276-82.<br />
145. Weber KT, Janicki JS, Shr<strong>of</strong>f S, Fishman AP. Contractile mechanics<br />
and interaction <strong>of</strong> <strong>the</strong> right and left ventricles. Am J Cardiol 1981;47:<br />
686-95.<br />
146. Pye MP, Pringle SD, Cobbe SM. Reference values and reproducibility <strong>of</strong><br />
Doppler echocardiography in <strong>the</strong> assessment <strong>of</strong> <strong>the</strong> tricuspid valve and<br />
right ventricular diastolic function in normal subjects. Am J Cardiol<br />
1991;67:269-73.<br />
147. Klein AL, Leung DY, Murray RD, Urban LH, Bailey KR, Tajik AJ. Effects<br />
<strong>of</strong> age and physiologic variables on right ventricular filling dynamics in<br />
normal subjects. Am J Cardiol 1999;84:440-8.<br />
148. Redington AN, Penny D, Rigby ML, Hayes A. Antegrade diastolic pulmonary<br />
arterial flow as a marker <strong>of</strong> right ventricular restriction after complete<br />
repair <strong>of</strong> pulmonary atresia with intact septum and critical<br />
pulmonary valvar stenosis. Cardiol Young 1992;2:382-6.<br />
149. Innelli P, Esposito R, Olibet M, Nistri S, Galderisi M. The impact <strong>of</strong> ageing<br />
on right ventricular longitudinal function in healthy subjects: a pulsed tissue<br />
Doppler study. Eur J Echocardiogr 2009;10:491-8.<br />
150. Zoghbi WA, Habib GB, Quinones MA. Doppler assessment <strong>of</strong> right ventricular<br />
filling in a normal population. Comparison with left ventricular<br />
filling dynamics. Circulation 1990;82:1316-24.<br />
151. Yu CM, Lin H, Ho PC, Yang H. <strong>Assessment</strong> <strong>of</strong> left and right ventricular<br />
systolic and diastolic synchronicity in normal subjects by tissue Doppler<br />
echocardiography and <strong>the</strong> effects <strong>of</strong> age and heart rate. Echocardiography<br />
2003;20:19-27.<br />
152. Berman JL, Green LH, Grossman W. <strong>Right</strong> ventricular diastolic pressure<br />
in coronary artery disease. Am J Cardiol 1979;44:1263-8.<br />
153. Wells DE, Befeler B. Dysfunction <strong>of</strong> <strong>the</strong> right ventricle in coronary artery<br />
disease. Chest 1974;66:230-5.<br />
154. Guazzi M, Maltagliati A, Tamborini G, Celeste F, Pepi M, Muratori M,<br />
et al. How <strong>the</strong> left and right sides <strong>of</strong> <strong>the</strong> heart, as well as pulmonary venous<br />
drainage, adapt to an increasing degree <strong>of</strong> head-up tilting in hypertrophic<br />
cardiomyopathy: differences from <strong>the</strong> normal heart. J Am Coll<br />
Cardiol 2000;36:185-93.<br />
155. O’Sullivan CA, Duncan A, Daly C, Li W, Oldershaw P, Henein MY.<br />
Dobutamine stress-induced ischemic right ventricular dysfunction<br />
and its relation to cardiac output in patients with three-vessel coronary<br />
artery disease with angina-like symptoms. Am J Cardiol 2005;<br />
96:622-7.<br />
156. Pela G, Regolisti G, Coghi P, Cabassi A, Basile A, Cavatorta A, et al. Effects<br />
<strong>of</strong> <strong>the</strong> reduction <strong>of</strong> preload on left and right ventricular myocardial<br />
velocities analyzed by Doppler tissue echocardiography in healthy subjects.<br />
Eur J Echocardiogr 2004;5:262-71.<br />
157. Heywood JT, Grimm J, Hess OM, Jakob M, Krayenbuhl HP. <strong>Right</strong> ventricular<br />
diastolic function during exercise: effect <strong>of</strong> ischemia. J Am Coll Cardiol<br />
1990;16:611-22.<br />
158. Sade LE, Gulmez O, Eroglu S, Sezgin A, Muderrisoglu H. Noninvasive<br />
estimation <strong>of</strong> right ventricular filling pressure by ratio <strong>of</strong> early tricuspid<br />
inflow to annular diastolic velocity in patients with and without recent<br />
cardiac surgery. J Am Soc Echocardiogr 2007;20:982-8.<br />
159. Sundereswaran L, Nagueh SF, Vardan S, Middleton KJ, Zoghbi WA,<br />
Quinones MA, et al. Estimation <strong>of</strong> left and right ventricular filling pressures<br />
after heart transplantation by tissue Doppler imaging. Am J Cardiol<br />
1998;82:352-7.<br />
160. Sallach JA, Tang WHW, Borowski AG, Tong W, Porter T, Martin MG,<br />
et al. <strong>Right</strong> atrial volume index in chronic systolic heart failure and prognosis.<br />
JACC Cardiovasc Imaging 2009;2:527-34.<br />
161. Dernellis J. <strong>Right</strong> atrial function in hypertensive patients: effects <strong>of</strong> antihypertensive<br />
<strong>the</strong>rapy. J Hum Hypertens 2001;15:463-70.<br />
162. Gan CTJ, Holverda S, Marcus JT, Paulus WJ, Marques KM,<br />
Bronzwaer JGF, et al. <strong>Right</strong> ventricular diastolic dysfunction and <strong>the</strong><br />
acute effects <strong>of</strong> sildenafil in pulmonary hypertension patients. Chest<br />
2007;132:11-7.<br />
163. Sadler DB, Brown J, Nurse H, Roberts J. Impact <strong>of</strong> hemodialysis on left<br />
and right ventricular Doppler diastolic filling indices. Am J Med Sci<br />
1992;304:83-90.<br />
164. Turhan S, Tulunay C, Ozduman Cin M, Gursoy A, Kilickap M, Dincer I,<br />
et al. Effects <strong>of</strong> thyroxine <strong>the</strong>rapy on right ventricular systolic and diastolic<br />
function in patients with subclinical hypothyroidism: a study by<br />
pulsed wave tissue Doppler imaging. J Clin Endocrinol Metab 2006;<br />
91:3490-3.<br />
165. Cresci SG, Goldstein JA. Hemodynamic manifestations <strong>of</strong> ischemic right<br />
heart dysfunction. Ca<strong>the</strong>t Cardiovasc Diagn 1992;27:28-33.<br />
166. McConnell MV, Solomon SD, Rayan ME, Come PC, Goldhaber SZ,<br />
Lee RT. Regional right ventricular dysfunction detected by echocardiography<br />
in acute pulmonary embolism. Am J Cardiol 1996;78:469-73.<br />
167. Scridon T, Scridon C, Skali H, Alvarez A, Goldhaber SZ, Solomon SD.<br />
Prognostic significance <strong>of</strong> troponin elevation and right ventricular enlargement<br />
in acute pulmonary embolism. Am J Cardiol 2005;96:303-5.<br />
168. Ferlinz J. <strong>Right</strong> ventricular function in adult cardiovascular disease. Prog<br />
Cardiovasc Dis 1982;25:225-67.<br />
169. Berger PB, Ruocco NA Jr., Ryan TJ, Jacobs AK, Zaret BL, Wackers FJ,<br />
et al., The TIMI Research Group. Frequency and significance <strong>of</strong> right<br />
ventricular dysfunction during inferior wall left ventricular myocardial infarction<br />
treated with thrombolytic <strong>the</strong>rapy (results from <strong>the</strong> Thrombolysis<br />
In Myocardial Infarction [TIMI] II trial). Am J Cardiol 1993;71:<br />
1148-52.<br />
170. Gorcsan J III, Murali S, Counihan PJ, Mandarino WA, Kormos RL. <strong>Right</strong><br />
ventricular per<strong>for</strong>mance and contractile reserve in patients with severe<br />
heart failure. <strong>Assessment</strong> by pressure-area relations and association<br />
with outcome. Circulation 1996;94:3190-7.<br />
171. Polak JF, Holman BL, Wynne J, Colucci WS. <strong>Right</strong> ventricular ejection<br />
fraction: an indicator <strong>of</strong> increased mortality in patients with congestive<br />
heart failure associated with coronary artery disease. J Am Coll Cardiol<br />
1983;2:217-24.<br />
172. Di Salvo TG, Mathier M, Semigran MJ, Dec GW. Preserved right ventricular<br />
ejection fraction predicts exercise capacity and survival in advanced<br />
heart failure. J Am Coll Cardiol 1995;25:1143-53.<br />
173. Skali H, Zorn<strong>of</strong>f LA, Pfeffer MA, Arnold MO, Lamas GA, Moye LA, et al.<br />
Prognostic use <strong>of</strong> echocardiography 1 year after a myocardial infarction.<br />
Am <strong>Heart</strong> J 2005;150:743-9.<br />
174. Khush KK, Tasissa G, Butler J, McGlothlin D, De Marco T. ESCAPE Investigators.<br />
Effect <strong>of</strong> pulmonary hypertension on clinical outcomes in advanced<br />
heart failure: analysis <strong>of</strong> <strong>the</strong> Evaluation Study <strong>of</strong> Congestive<br />
<strong>Heart</strong> Failure and Pulmonary Artery Ca<strong>the</strong>terization Effectiveness (ES-<br />
CAPE) database. Am <strong>Heart</strong> J 2009;157:1026-34.<br />
175. Romero-Corral A, Somers VK, Pellikka PA, Olson EJ, Bailey KR,<br />
Korinek J, et al. Decreased right and left ventricular myocardial per<strong>for</strong>mance<br />
in obstructive sleep apnea. Chest 2007;132:1863-70.<br />
176. Bhattacharyya S, Toumpanakis C, Burke M, Taylor AM, Caplin ME,<br />
Davar J. Features <strong>of</strong> carcinoid heart disease identified by 2- and 3-dimensional<br />
echocardiography and cardiac MRI. Circ Cardiovasc Imaging<br />
2010;3:103-11.
Journal <strong>of</strong> <strong>the</strong> American Society <strong>of</strong> Echocardiography<br />
Volume 23 Number 7<br />
177. Callahan JA, Wroblewski EM, Reeder GS, Edwards WD, Seward JB,<br />
Tajik AJ. <strong>Echocardiographic</strong> features <strong>of</strong> carcinoid heart disease. Am J Cardiol<br />
1982;50:762-8.<br />
178. Mittal SR, Goozar RS. <strong>Echocardiographic</strong> evaluation <strong>of</strong> right ventricular systolic<br />
functions in pure mitral stenosis. Int J Cardiovasc Imaging 2001;17:13-8.<br />
179. Schenk P, Globits S, Koller J, Brunner C, Artemiou O, Klepetko W, et al.<br />
Accuracy <strong>of</strong> echocardiographic right ventricular parameters in patients<br />
with different end-stage lung diseases prior to lung transplantation.<br />
J <strong>Heart</strong> Lung Transplant 2000;19:145-54.<br />
Rudski et al 713<br />
180. Jurcut R, Giusca S, La Gerche A, Vasile S, Ginghina C, Voigt JU. The echocardiographic<br />
assessment <strong>of</strong> <strong>the</strong> right ventricle: what to do in 2010? Eur J<br />
Echocardiogr 2010;11:81-96.<br />
181. Shiota T. 3D echocardiography: evaluation <strong>of</strong> <strong>the</strong> right ventricle. Curr<br />
Opin Cardiol 2009;24:410-4.<br />
182. Lytrivi ID, Lai WW, Ko HH, Nielsen JC, Parness IA, Srivastava S. Color<br />
Doppler tissue imaging <strong>for</strong> evaluation <strong>of</strong> right ventricular systolic function<br />
in patients with congenital heart disease. J Am Soc Echocardiogr<br />
2005;18:1099-104.