

1dOprzL
1dOprzL
1dOprzL

You also want an ePaper? Increase the reach of your titles
YUMPU automatically turns print PDFs into web optimized ePapers that Google loves.
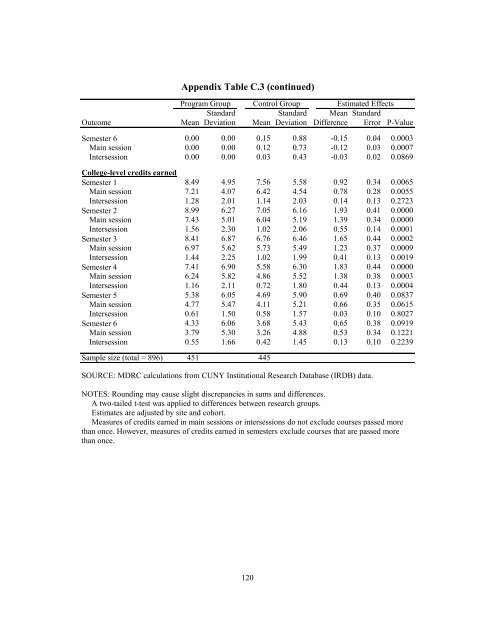
Appendix Table C.3 (continued)Program Group Control Group Estimated EffectsStandard Standard Mean StandardOutcome Mean Deviation Mean Deviation Difference Error P-ValueSemester 6 0.00 0.00 0.15 0.88 -0.15 0.04 0.0003Main session 0.00 0.00 0.12 0.73 -0.12 0.03 0.0007Intersession 0.00 0.00 0.03 0.43 -0.03 0.02 0.0869College-level credits earnedSemester 1 8.49 4.95 7.56 5.58 0.92 0.34 0.0065Main session 7.21 4.07 6.42 4.54 0.78 0.28 0.0055Intersession 1.28 2.01 1.14 2.03 0.14 0.13 0.2723Semester 2 8.99 6.27 7.05 6.16 1.93 0.41 0.0000Main session 7.43 5.01 6.04 5.19 1.39 0.34 0.0000Intersession 1.56 2.30 1.02 2.06 0.55 0.14 0.0001Semester 3 8.41 6.87 6.76 6.46 1.65 0.44 0.0002Main session 6.97 5.62 5.73 5.49 1.23 0.37 0.0009Intersession 1.44 2.25 1.02 1.99 0.41 0.13 0.0019Semester 4 7.41 6.90 5.58 6.30 1.83 0.44 0.0000Main session 6.24 5.82 4.86 5.52 1.38 0.38 0.0003Intersession 1.16 2.11 0.72 1.80 0.44 0.13 0.0004Semester 5 5.38 6.05 4.69 5.90 0.69 0.40 0.0837Main session 4.77 5.47 4.11 5.21 0.66 0.35 0.0615Intersession 0.61 1.50 0.58 1.57 0.03 0.10 0.8027Semester 6 4.33 6.06 3.68 5.43 0.65 0.38 0.0919Main session 3.79 5.30 3.26 4.88 0.53 0.34 0.1221Intersession 0.55 1.66 0.42 1.45 0.13 0.10 0.2239Sample size (total = 896) 451 445SOURCE: MDRC calculations from CUNY Institutional Research Database (IRDB) data.NOTES: Rounding may cause slight discrepancies in sums and differences.A two-tailed t-test was applied to differences between research groups.Estimates are adjusted by site and cohort.Measures of credits earned in main sessions or intersessions do not exclude courses passed morethan once. However, measures of credits earned in semesters exclude courses that are passed morethan once.120