1dOprzL
1dOprzL
1dOprzL
You also want an ePaper? Increase the reach of your titles
YUMPU automatically turns print PDFs into web optimized ePapers that Google loves.
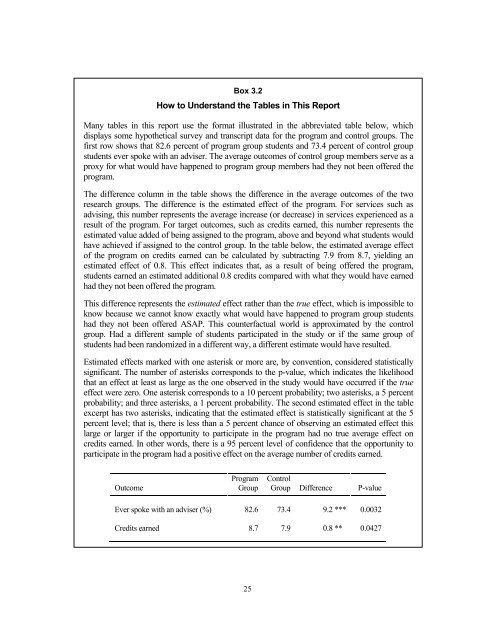
Box 3.2How to Understand the Tables in This ReportMany tables in this report use the format illustrated in the abbreviated table below, whichdisplays some hypothetical survey and transcript data for the program and control groups. Thefirst row shows that 82.6 percent of program group students and 73.4 percent of control groupstudents ever spoke with an adviser. The average outcomes of control group members serve as aproxy for what would have happened to program group members had they not been offered theprogram.The difference column in the table shows the difference in the average outcomes of the tworesearch groups. The difference is the estimated effect of the program. For services such asadvising, this number represents the average increase (or decrease) in services experienced as aresult of the program. For target outcomes, such as credits earned, this number represents theestimated value added of being assigned to the program, above and beyond what students wouldhave achieved if assigned to the control group. In the table below, the estimated average effectof the program on credits earned can be calculated by subtracting 7.9 from 8.7, yielding anestimated effect of 0.8. This effect indicates that, as a result of being offered the program,students earned an estimated additional 0.8 credits compared with what they would have earnedhad they not been offered the program.This difference represents the estimated effect rather than the true effect, which is impossible toknow because we cannot know exactly what would have happened to program group studentshad they not been offered ASAP. This counterfactual world is approximated by the controlgroup. Had a different sample of students participated in the study or if the same group ofstudents had been randomized in a different way, a different estimate would have resulted.Estimated effects marked with one asterisk or more are, by convention, considered statisticallysignificant. The number of asterisks corresponds to the p-value, which indicates the likelihoodthat an effect at least as large as the one observed in the study would have occurred if the trueeffect were zero. One asterisk corresponds to a 10 percent probability; two asterisks, a 5 percentprobability; and three asterisks, a 1 percent probability. The second estimated effect in the tableexcerpt has two asterisks, indicating that the estimated effect is statistically significant at the 5percent level; that is, there is less than a 5 percent chance of observing an estimated effect thislarge or larger if the opportunity to participate in the program had no true average effect oncredits earned. In other words, there is a 95 percent level of confidence that the opportunity toparticipate in the program had a positive effect on the average number of credits earned.Program ControlOutcome Group Group Difference P-valueEver spoke with an adviser (%) 82.6 73.4 9.2 *** 0.0032Credits earned 8.7 7.9 0.8 *** 0.042725


