Sectoral Approach
Sectoral Approach
Sectoral Approach

Create successful ePaper yourself
Turn your PDF publications into a flip-book with our unique Google optimized e-Paper software.
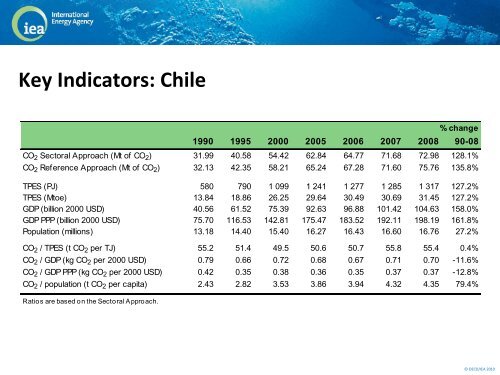
Key Indicators: ChileReference<strong>Approach</strong>% change1990 1995 2000 2005 2006 2007 2008 90-08CO 2 <strong>Sectoral</strong> <strong>Approach</strong> (Mt of CO 2 ) 31.99 40.58 54.42 62.84 64.77 71.68 72.98 128.1%CO 2 Reference <strong>Approach</strong> (Mt of CO 2 ) 32.13 42.35 58.21 65.24 67.28 71.60 75.76 135.8%<strong>Sectoral</strong><strong>Approach</strong>TPES (PJ) 580 790 1 099 1 241 1 277 1 285 1 317 127.2%TPES (Mtoe) 13.84 18.86 26.25 29.64 30.49 30.69 31.45 127.2%GDP (billion 2000 USD) 40.56 61.52 75.39 92.63 96.88 101.42 104.63 158.0%GDP PPP (billion 2000 USD) 75.70 116.53 142.81 175.47 183.52 192.11 198.19 161.8%Population (millions) 13.18 14.40 15.40 16.27 16.43 16.60 16.76 27.2%CO 2 / TPES (t CO 2 per TJ) 55.2 51.4 49.5 50.6 50.7 55.8 55.4 0.4%CO 2 / GDP (kg CO 2 per 2000 USD) 0.79 0.66 0.72 0.68 0.67 0.71 0.70 -11.6%CO 2 / GDP PPP (kg CO 2 per 2000 USD) 0.42 0.35 0.38 0.36 0.35 0.37 0.37 -12.8%CO 2 / population (t CO 2 per capita) 2.43 2.82 3.53 3.86 3.94 4.32 4.35 79.4%Ratios are based on the <strong>Sectoral</strong> <strong>Approach</strong>.©OECD/IEA 2010