Development of Optimal Cutting Plan using Linear ... - ijimt
Development of Optimal Cutting Plan using Linear ... - ijimt
Development of Optimal Cutting Plan using Linear ... - ijimt

You also want an ePaper? Increase the reach of your titles
YUMPU automatically turns print PDFs into web optimized ePapers that Google loves.
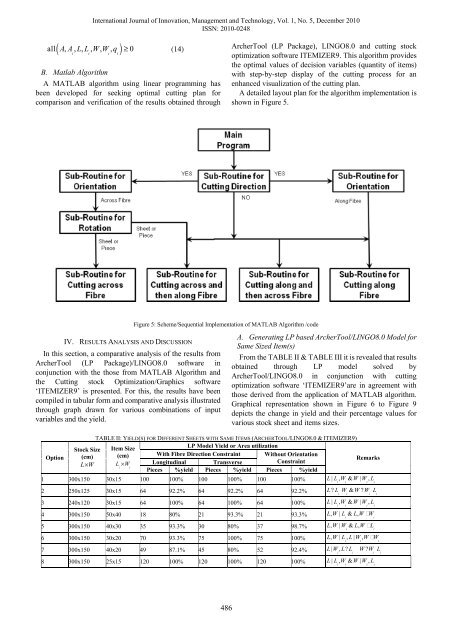
( )International Journal <strong>of</strong> Innovation, Management and Technology, Vol. 1, No. 5, December 2010ISSN: 2010-0248all AA , , LLWW , , , , q ≥ 0 (14)i i i iB. Matlab AlgorithmA MATLAB algorithm <strong>using</strong> linear programming hasbeen developed for seeking optimal cutting plan forcomparison and verification <strong>of</strong> the results obtained throughArcherTool (LP Package), LINGO8.0 and cutting stockoptimization s<strong>of</strong>tware ITEMIZER9. This algorithm providesthe optimal values <strong>of</strong> decision variables (quantity <strong>of</strong> items)with step-by-step display <strong>of</strong> the cutting process for anenhanced visualization <strong>of</strong> the cutting plan.A detailed layout plan for the algorithm implementation isshown in Figure 5.IV. RESULTS ANALYSIS AND DISCUSSIONIn this section, a comparative analysis <strong>of</strong> the results fromArcherTool (LP Package)/LINGO8.0 s<strong>of</strong>tware inconjunction with the those from MATLAB Algorithm andthe <strong>Cutting</strong> stock Optimization/Graphics s<strong>of</strong>tware‘ITEMIZER9’ is presented. For this, the results have beencompiled in tabular form and comparative analysis illustratedthrough graph drawn for various combinations <strong>of</strong> inputvariables and the yield.Figure 5: Scheme/Sequential Implementation <strong>of</strong> MATLAB Algorithm /codeA. Generating LP based ArcherTool/LINGO8.0 Model forSame Sized Item(s)From the TABLE II & TABLE III it is revealed that resultsobtained through LP model solved byArcherTool/LINGO8.0 in conjunction with cuttingoptimization s<strong>of</strong>tware ‘ITEMIZER9’are in agreement withthose derived from the application <strong>of</strong> MATLAB algorithm.Graphical representation shown in Figure 6 to Figure 9depicts the change in yield and their percentage values forvarious stock sheet and items sizes.TABLE II: YIELD(S) FOR DIFFERENT SHEETS WITH SAME ITEMS (ARCHERTOOL/LINGO8.0 & ITEMIZER9)Stock Size Item SizeLP Model Yield or Area utilizationOption (cm) (cm) With Fibre Direction Constraint Without OrientationRemarksL×W L × W Longitudinal TransverseConstrainti iPieces %yield Pieces %yield Pieces %yield1 300x150 30x15 100 100% 100 100% 100 100% L | L, W & W | W,Li i i i2 250x125 30x15 64 92.2% 64 92.2% 64 92.2% L? L W & W?W Li i i i3 240x120 30x15 64 100% 64 100% 64 100% L | L, W & W | W,Li i i i4 300x150 50x40 18 80% 21 93.3% 21 93.3% L , W | L & L , W W5 300x150 40x30 35 93.3% 30 80% 37 98.7% L , W | W & L , W L6 300x150 30x20 70 93.3% 75 100% 75 100% L, W | L, L| W, WWiii i i7 300x150 40x20 49 87.1% 45 80% 52 92.4% L | W, L? L W?W Li i i i8 300x150 25x15 120 100% 120 100% 120 100% L | L, W & W | W,Li i i iii486