TRC-SFD-1-07 - Tribology Group - Texas A&M University
TRC-SFD-1-07 - Tribology Group - Texas A&M University
TRC-SFD-1-07 - Tribology Group - Texas A&M University

Create successful ePaper yourself
Turn your PDF publications into a flip-book with our unique Google optimized e-Paper software.
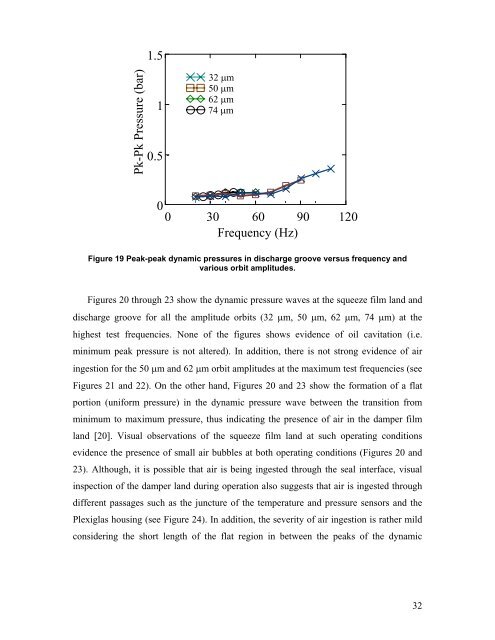
1.5Pk-Pk Pressure (bar)10.532 μm50 μm62 μm74 μm00 30 60 90 120Frequency (Hz)Figure 19 Peak-peak dynamic pressures in discharge groove versus frequency andvarious orbit amplitudes.Figures 20 through 23 show the dynamic pressure waves at the squeeze film land anddischarge groove for all the amplitude orbits (32 μm, 50 μm, 62 μm, 74 μm) at thehighest test frequencies. None of the figures shows evidence of oil cavitation (i.e.minimum peak pressure is not altered). In addition, there is not strong evidence of airingestion for the 50 μm and 62 μm orbit amplitudes at the maximum test frequencies (seeFigures 21 and 22). On the other hand, Figures 20 and 23 show the formation of a flatportion (uniform pressure) in the dynamic pressure wave between the transition fromminimum to maximum pressure, thus indicating the presence of air in the damper filmland [20]. Visual observations of the squeeze film land at such operating conditionsevidence the presence of small air bubbles at both operating conditions (Figures 20 and23). Although, it is possible that air is being ingested through the seal interface, visualinspection of the damper land during operation also suggests that air is ingested throughdifferent passages such as the juncture of the temperature and pressure sensors and thePlexiglas housing (see Figure 24). In addition, the severity of air ingestion is rather mildconsidering the short length of the flat region in between the peaks of the dynamic32