RUC20 - NWS Technical Procedures Bulletin - RUC - NOAA
RUC20 - NWS Technical Procedures Bulletin - RUC - NOAA
RUC20 - NWS Technical Procedures Bulletin - RUC - NOAA

You also want an ePaper? Increase the reach of your titles
YUMPU automatically turns print PDFs into web optimized ePapers that Google loves.
use type between the background and the observation for near-coastal stations. The <strong><strong>RUC</strong>20</strong> continues to use anoptimal interpolation analysis as in the <strong>RUC</strong>40 – implementation of a 3-d variational analysis has been deferred.6. Improved land-surface physicsThe <strong><strong>RUC</strong>20</strong> land-surface model is changed from that of the <strong>RUC</strong>40. It uses more detailed land-use and soil texturedata, in contrast to 1-degree resolution fields used in the <strong>RUC</strong>40. It includes improved cold-season processes (soilfreezing/thawing) and a 2-layer snow model. These changes improve the evolution of surface moisture andtemperature and snow cover, which in turn improve forecasts of surface temperature and moisture and precipitation.7. Lateral boundary conditionsThe <strong>RUC</strong>40 used lateral boundary conditions specified from the Eta model initialized every 12 h. The <strong><strong>RUC</strong>20</strong> addsupdates of its lateral boundaries from the 0600 and 1800 UTC Eta runs.8. Improved post-processingThe <strong><strong>RUC</strong>20</strong> includes improved diagnostic techniques for 2-m temperature and dewpoint, 10-m winds, helicity,visibility, convective available potential energy, and convective inhibition.Most significant improvements in <strong><strong>RUC</strong>20</strong> fields over those from <strong>RUC</strong>40 (<strong>RUC</strong>-2).• Precipitation – both summer and winter – From improved precipitation physics and higher resolution• All surface fields - temperature, moisture, winds – Reduced bias and RMS error in comparison withMETAR observations. From improved surface and cloud/precipitation physics and higher resolution• Upper-level winds and temperatures – From higher vertical and horizontal resolution, better physics• Orographically induced precipitation and circulations – From higher horizontal resolution, cloudphysics, and better use of surface data near mountains.2
1. INTRODUCTIONA new version of the Rapid Update Cycle (<strong>RUC</strong>) has been implemented at the National Centers for EnvironmentalPrediction (NCEP) on 17 April 2002 with a doubling of horizontal resolution (40km to 20km), an increased numberof vertical computational levels (40 to 50), and improvements in the analysis and model physical parameterizations.A primary goal in development of the 20-km <strong>RUC</strong> (or <strong><strong>RUC</strong>20</strong>) has been improvement in warm-season and coldseasonquantitative precipitation forecasts. Improvements in near-surface forecasts and cloud forecasts have alsobeen targeted. The <strong><strong>RUC</strong>20</strong> provides improved forecasts for these variables, as well as for wind, temperature, andmoisture above the surface.The <strong><strong>RUC</strong>20</strong> provides improved short-range numerical weather guidance for general public forecasting as well as forthe special short-term needs of aviation and severe-weather forecasting. The <strong><strong>RUC</strong>20</strong> continues to produce newanalyses and short-range forecasts on an hourly basis, with forecasts out to 12 h run every 3 h. The implementationof the <strong><strong>RUC</strong>20</strong> in 2002 follows previous major implementations of a 60-km 3-h cycle version in 1994 (Benjamin et al1994, 1991) and a 40-km 1-h cycle version in 1998 (Benjamin et al 1998).The uses of the <strong>RUC</strong> summarized below continue with the <strong><strong>RUC</strong>20</strong>:• Explicit use of short-range forecasts - The <strong>RUC</strong> forecasts are unique in that they are initialized with veryrecent data. Thus, usually, the most recent <strong>RUC</strong> forecast has been initialized with more recent data thanother available NCEP model forecasts. Even at 0000 or 1200 UTC, when other model runs are available,the <strong>RUC</strong> forecasts are useful for comparison over the next 12 h. Although there are many differencesbetween the <strong>RUC</strong> and other NCEP models, the key unique aspects of the <strong>RUC</strong> are its hybrid isentropicvertical coordinate (used in the analysis and model), hourly data assimilation, and model physics.• Monitoring current conditions with hourly analyses - Hourly analyses are particularly useful whenoverlaid with hourly satellite and radar images, or hourly observations such as from surface stations orprofilers.• Evaluating trends of longer-range models - <strong>RUC</strong> analyses and forecasts are useful for evaluation of theshort-term predictions of the Eta and AVN models.The users of the <strong>RUC</strong> include:• Aviation Weather Center/NCEP, Kansas City, MO• Storm Prediction Center/NCEP, Norman, OK• <strong>NWS</strong> Weather Forecast Offices• FAA/DOT, including use for air traffic management and other automated tools, and for FAA workstations• NASA Space Flight Centers• Private sector weather forecast providersSections below describe changes in the <strong>RUC</strong> with the <strong><strong>RUC</strong>20</strong> implementation regarding spatial resolution, dataassimilation, model, changes to lower and lateral boundary condition, and diagnostics / post-processing. Commentsfrom a field test for the <strong><strong>RUC</strong>20</strong> held March-April 2002 are included in an appendix.3
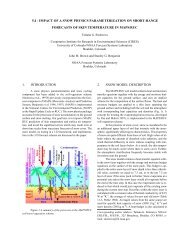
Figure 1. Terrain elevation for a) 40-km <strong>RUC</strong>-2, b) 20-km <strong><strong>RUC</strong>20</strong>4
2. SPATIAL RESOLUTIONThe <strong><strong>RUC</strong>20</strong> occupies the same spatial domain as the previous <strong>RUC</strong>40 (40-km <strong>RUC</strong>-2), as shown in Figs. 1a,b. The<strong><strong>RUC</strong>20</strong> grid points are still a subset of the AWIPS Lambert conformal grid (AWIPS/GRIB grid 215 for 20 km) usedas a distribution grid by the National Weather Service. Direct use of the AWIPS grid reduces the number ofdistribution grids for the <strong>RUC</strong>. The AWIPS grid ID for the <strong><strong>RUC</strong>20</strong> grid is 252, compared to 236 for the <strong>RUC</strong>40grid. Thus, the 252 grid for the <strong><strong>RUC</strong>20</strong> is a subset of the 215 grid. The <strong><strong>RUC</strong>20</strong> grid size is 301 x 225 grid points(compared to 151 x 113 for <strong>RUC</strong>40).2.a. Horizontal resolutionThe 20-km grid spacing allows better resolution of small-scale terrain variations, leading to improved forecasts ofmany topographically induced features, including low-level eddies, mountain/valley circulations, mountain waves,sea/lake breezes, and orographic precipitation. It also allows better resolution of land-water boundaries and otherland-surface discontinuities. While the most significant differences in the terrain resolution of the <strong><strong>RUC</strong>20</strong> (Fig. 1b)vs. <strong>RUC</strong>40 (Fig. 1a) are in the western United States, a number of important differences are also evident in theeastern part of the domain.The surface elevation of the <strong><strong>RUC</strong>20</strong>, as in the <strong>RUC</strong>40, is defined as a "slope envelope" topography. The standardenvelope topography is defined by adding the sub-grid-scale terrain standard deviation (calculated from a 10-kmterrain field) to the mean value over the grid box. By contrast, in the slope envelope topography, the terrain standarddeviation is calculated with respect to a plane fit to the high-resolution topography within each grid box. This givesmore accurate terrain values, especially in sloping areas at the edge of high-terrain regions. It also avoids a tendencyof the standard envelope topography to project the edge of plateaus too far laterally onto low terrain regions. Usingthe slope envelope topography gives lower terrain elevation at locations such as Denver and Salt Lake City whichare located close to mountain ranges. As shown in Table 1, the <strong><strong>RUC</strong>20</strong> more closely matches station elevations inthe western United States.Rawinsonde stationStation elevation minus<strong>RUC</strong>40 elevation (m)Station elevation minus<strong><strong>RUC</strong>20</strong> elevation (m)Edwards AFB, CA 300 41Denver, CO 354 26Grand Junction, CO 679 323Boise, ID 274 253Great Falls, MT 157 29Reno, NV 381 144Elko, NV 352 152Medford, OR 544 346Salem, OR 233 51Rapid City, SD 153 45Salt Lake City, UT 630 438Riverton, WY 225 119Table 1. Terrain elevation difference between station elevation and interpolated <strong>RUC</strong> elevation for selectedrawinsonde stations in western United States.The grid length is 20.317 km at 35 deg N. Due to the varying map-scale factor from the projection, the actual gridlength in <strong><strong>RUC</strong>20</strong> decreases to as small as 16 km at the north boundary. The grid length is about 19 km at 43 deg N.The <strong><strong>RUC</strong>20</strong> latitude/longitude (and terrain elevation) at each point in an ASCII file can be downloaded fromhttp://ruc.fsl.noaa.gov/MAPS.domain.html. The lower left corner point is (1,1), and the upper right corner point is(301,225), as shown in Table 2.An example is shown below (Fig. 2) of the improved orographic effect on low-level wind circulation comparing 3-hforecasts from <strong><strong>RUC</strong>20</strong> and <strong>RUC</strong>40, both displayed at 40-km resolution. The <strong><strong>RUC</strong>20</strong> shows a better depiction of the5
Denver-area cyclonic circulation, strong southerly flow up the San Luis Valley into southern Colorado nearAlamosa, and winds of greater than 20 knots near higher terrain in central Colorado and south central Utah. Theverifying analysis in Fig. 3 shows that all of these features appear to be better depicted in the <strong><strong>RUC</strong>20</strong> 3-h forecasts.Figure 2. <strong>RUC</strong> 3-h surface wind forecasts from a)<strong>RUC</strong>40 and b) <strong><strong>RUC</strong>20</strong>. Forecasts valid at 1800 UTC 3 April 2002.Figure 3. Verifying analysis of surface winds at 1800 UTC 3 April 2002 from <strong><strong>RUC</strong>20</strong>.6
<strong><strong>RUC</strong>20</strong> point AWIPS-212 point Latitude Longitude(1,1) (23,7) 16.2810 N 126.1378 W(1,225) (23,119) 54.1731 N 139.8563 W(301,1) (173,7) 17.3400 N 69.0371 W(301,225) (173,119) 55.4818 N 57.3794 WTable 2. Latitude/longitude and AWIPS-212 positions of corner points for the <strong><strong>RUC</strong>20</strong> domain.b. Vertical resolutionThe <strong><strong>RUC</strong>20</strong> continues to use the generalized vertical coordinate configured as a hybrid isentropic-sigma coordinate(Bleck and Benjamin 1993) used in previous versions of the <strong>RUC</strong>. This coordinate is used for both the analysisand the forecast model. The <strong>RUC</strong> hybrid coordinate has terrain-following layers near the surface with isentropiclayers above. This coordinate has proven to be advantageous in providing sharper resolution near fronts and thetropopause (e.g., Benjamin 1989, Johnson et al. 1993, 2000). Some of the other advantages are:• All of the adiabatic component of the vertical motion on the isentropic surfaces is captured in flow along the2-D surfaces. Vertical advection through coordinate surfaces, which usually has somewhat more truncationerror than horizontal advection, is less prominent in isentropic/sigma hybrid models than in quasi-horizontalcoordinate models. This characteristic results in improved moisture transport and less precipitation spin-upproblem in the first few hours of the forecast.• Improved conservation of potential vorticity. The potential vorticity and tropopause level (based on the 2.0PV unit surface) show very good spatial and temporal coherence in <strong>RUC</strong> grids (Olsen et al 2000).• Observation influence in the <strong>RUC</strong> analysis extends along isentropic surfaces, leading to improved air-massintegrity and frontal structure. From an isobaric perspective, the <strong>RUC</strong> isentropic analysis is implicitlyanisotropic (Benjamin 1989).The <strong><strong>RUC</strong>20</strong> has 50 vertical levels, compared to 40 levels in <strong>RUC</strong>40. Extra levels are added near the tropopause andlower stratosphere and also in the lower troposphere. The <strong>RUC</strong> hybrid coordinate is defined as follows:- Each of the 50 levels is assigned a reference virtual potential temperature (θ v ) that increases upward (Table 3).- The lowest atmospheric level (k=1) is assigned as the pressure at the surface (the model terrain elevation).- Each of the next 49 levels is assigned a minimum pressure thickness between it and the next level below. Thisthickness will apply to coordinate surfaces in the lower portion of the domain where the coordinate surfaces areterrain-following. For grid points with surface elevation near sea level, the minimum pressure thickness is 2.5, 5.0,7.5, and 10 hPa for the bottom 4 layers, and 15 hPa for all layers above. These minimum pressure thicknesses arereduced over higher terrain to avoid “bulges” of sigma layers protruding upward in these regions.- The pressure corresponding to the reference θ v for each (k) level is determined for each (i,j) column. (For lowerθ v values, this pressure may be determined via extrapolation as beneath the ground.)- At this point, there are two choices for the assignment of pressure to the (i,j,k) grid point, corresponding to:1) the reference θ v value (the isentropic definition), and2) the minimum pressure spacing, starting at the surface pressure (the sigma definition)If the isentropic pressure (1) is less than sigma pressure (2), the grid point pressure is defined as isentropic, orotherwise as terrain-following (sigma).224 232 240 245 250 255 260 265 270 273276 279 282 285 288 291 294 296 298 300302 304 306 308 310 312 314 316 318 320322 325 328 331 334 337 340 343 346 349352 355 359 365 372 385 400 422 450 500Table 3. Reference θ v values (K) for the <strong><strong>RUC</strong>20</strong> (50 levels).The maximum θ v value in the <strong><strong>RUC</strong>20</strong> is 500 K, compared to 450 K for the <strong>RUC</strong>40. The 500 K surface is typicallyfound at 45-60 hPa. As with the <strong>RUC</strong>40, a greater proportion of the hybrid levels are assigned as terrain-followingin warmer regions and warmer seasons. This is shown in Figs. 4a,b below.7
Figure 4. Vertical cross sections showing <strong>RUC</strong> native coordinate levels for a) <strong>RUC</strong>40 – 40 levels, and b)<strong><strong>RUC</strong>20</strong> – 50 levels. Data are taken from <strong>RUC</strong> 12-h forecasts valid at 1200 UTC 2 April 2002. Cross sectionsare oriented from south (Mississippi) on left to north (western Ontario) on rightIn this example (Fig. 4), north-south vertical cross sections are shown depicting the pressure at which the <strong>RUC</strong>native levels are found for a particular case. The case shown is from April 2002, with the cross section extendingfrom Mississippi (on the left) northward through Wisconsin (center point), across Lake Superior (slightly higherterrain on each side), and ending in western Ontario. A frontal zone is present in the middle of the cross section,where the <strong>RUC</strong> levels (mostly isentropic) between 700 and 300 hPa are strongly sloped.In the <strong><strong>RUC</strong>20</strong>, seven new levels have been added with reference θ v values between 330 K and 500 K. Three newlevels with reference θ v in the 270—290 K range have also been added. In the <strong><strong>RUC</strong>20</strong> depiction (Fig. 4b), thetropopause is more sharply defined than in the <strong>RUC</strong>40, and there are more levels in the stratosphere, resulting fromthe additional levels in the upper part of the domain. In the <strong><strong>RUC</strong>20</strong>, the isentropic levels from 270-355 K are nowresolved with no more than 3 K spacing.3. FORECAST MODEL CHANGES IN <strong><strong>RUC</strong>20</strong>The <strong><strong>RUC</strong>20</strong> forecast model is similar to that for the <strong>RUC</strong>40 but with important changes in physicalparameterizations and smaller changes in numerical approaches. The model continues to be based upon thegeneralized vertical coordinate model described by Bleck and Benjamin (1993). Modifications to a 20-line sectionof code in the model are sufficient to modify it from the hybrid isentropic-sigma coordinate described in section 2.bto either a pure sigma or pure isentropic model.3.a. Basic dynamics/numericsFirst, the basic numerical characteristics of the <strong>RUC</strong> model are reviewed (italicized where different in the <strong><strong>RUC</strong>20</strong>from the <strong>RUC</strong>40).8
• Arakawa-C staggered horizontal grid (Arakawa and Lamb 1977); u and v horizontal wind points offsetfrom mass points to improve numerical accuracy.• Generalized vertical coordinate equation set and numerics for adiabatic part of model following Bleck andBenjamin (1993)• No vertical staggering.• Time step is 30 seconds at 20-km resolution.• Positive definite advection schemes used for continuity equation (advection of pressure thickness betweenlevels) and for horizontal advection (Smolarkiewicz 1983) of virtual potential temperature and all vaporand hydrometeor moisture variables.• Application of adiabatic digital filter initialization (DFI, Lynch and Huang 1992) for 40-min period forwardand backward before each model start. The use of the DFI in the <strong>RUC</strong> is important for producing asufficiently “quiet” (reduced gravity wave activity) 1-h forecast to allow the 1-h assimilation cycle. Aproblem in application of digital filter weights is corrected in the <strong><strong>RUC</strong>20</strong>.The atmospheric prognostic variables of the <strong><strong>RUC</strong>20</strong> forecast model are:• pressure thickness between levels• virtual potential temperature - θ v• horizontal wind components• water vapor mixing ratio• cloud water mixing ratio• rain water mixing ratio• ice mixing ratio• snow mixing ratio• graupel (rimed snow, frozen rain drops) mixing ratio• number concentration for ice particles• turbulence kinetic energyThe soil prognostic variables (at six levels) of the <strong>RUC</strong> forecast model are:• soil temperature• soil volumetric moisture contentOther surface-related prognostic variables are snow water equivalent moisture and snow temperature (at 2 layers in<strong><strong>RUC</strong>20</strong>), and canopy water.Other differences in the <strong><strong>RUC</strong>20</strong> vs. <strong>RUC</strong>40 model numerics or design are as follows:• The order of solution in each time step:<strong>RUC</strong>40ContinuityHorizontal advection of θ v / moisturePhysics (sub-grid-scale parameterizations)Coordinate adjustmentMomentum<strong><strong>RUC</strong>20</strong>ContinuityHorizontal advection of θ v / moisturePhysicsMomentumCoordinate adjustment• The vertical advection for all variables is now calculated in a consistent manner using upstreamdifferencing. The placement of the call for coordinate adjustment at the end of the time step allows thisconsistent treatment.• More robust and flexible hybrid coordinate algorithm• Much improved modularization• Use of new version of Scalable Modeling System (SMS) message-passing library with non-intrusivecompiler directives (Govett et al. 2001) and improved modularization led to a significant reduction in linesof code in the <strong><strong>RUC</strong>20</strong> model.9
3.b.2. Convective parameterization.A new convective parameterization (Grell and Devenyi 2001) based on an ensemble approach is used in the <strong><strong>RUC</strong>20</strong>.This scheme is based on the Grell (1993) scheme but draws on other schemes by using an ensemble of variousclosure assumptions. The version of the Grell/Devenyi scheme used in the <strong><strong>RUC</strong>20</strong> includes the following closures:∂( CAPE)• ∂ t , where CAPE is convective available potential energy.• removal of total CAPE (Kain and Fritsch 1992) in a specified time period.• low-level horizontal moisture convergence.• low-level mass flux at cloud base.with different parameters applied to each of these closures. In the <strong><strong>RUC</strong>20</strong>, a total of 108 closure assumptions areused in the Grell/Devenyi convective scheme. The <strong><strong>RUC</strong>20</strong> convective scheme also now includes:• detrainment of cloud water and cloud ice• entrainment of environmental air into the updraft• relaxation of stability (convective inhibition) constraints at downstream points based on downdraft strength• removal of stability constraint at initial time of each model forecast in areas where GOES sounder effectivecloud amount (Schreiner et al 2001) indicates that convection may be present. This technique can aidconvection in starting more accurately at grid points where there is positive CAPE, although it cannotcreate positive CAPE• correction to exaggerated effects of surface processes in forcing convection. This bug in <strong>RUC</strong>40 resultedin too widespread convective precipitation over land in summer, especially in the southeastern U.S., andwidespread light precipitation over warm ocean areas.a)c)b)Figure 6. Precipitation (in) forecasts initialized at 0000 UTC 26 March 2002 from a) <strong>RUC</strong>40 and b)<strong><strong>RUC</strong>20</strong> for 0900-1200 UTC (9-12 h forecasts). c) Radar summary valid at 1115 UTC (verification).11
The skill of <strong>RUC</strong> precipitation forecasts is significantly improved with the <strong><strong>RUC</strong>20</strong> version, including theGrell/Devenyi ensemble-based convective parameterization. An example of this improvement is presented in Fig. 6,where Figs. 6a,b are 12-h forecasts of 3-h accumulated precipitation from the <strong>RUC</strong>40 and <strong><strong>RUC</strong>20</strong> respectively, andFig. 6c is a radar image in the verifying period. In this case, the <strong><strong>RUC</strong>20</strong> has accurately forecast much more intensitythan the <strong>RUC</strong>40 to the southern end of a convective line, especially in eastern Louisiana and southern Mississippi.Not only is the intensity improved in the <strong><strong>RUC</strong>20</strong> forecast, but also the position of the line is more accurately forecastto be farther east than in the <strong>RUC</strong>40 forecast, stretching from central Ohio into northwestern Alabama beforebending back to eastern Louisiana.Improvement in precipitation forecasts from the <strong><strong>RUC</strong>20</strong> relative to the <strong>RUC</strong>40 is also evident in overallprecipitation verification statistics over multi-week periods. Daily verification has been performed using the NCEP24-h precipitation analysis against <strong>RUC</strong> 24-h totals produced by summing two 12-h forecasts. Two scorestraditionally used for precipitation verification, equitable threat score and bias, are used to compare <strong><strong>RUC</strong>20</strong> and<strong>RUC</strong>40 forecasts. For a period from spring 2002, the <strong><strong>RUC</strong>20</strong> has a much higher equitable threat score (Fig. 7a) andbias (Fig. 7b) much closer to 1.0 (preferable) than the <strong>RUC</strong>40 for almost all precipitation thresholds. Precipitationverification for a November-December 2001 cold season period (Benjamin et al 2002a) also shows a markedimprovement for the <strong><strong>RUC</strong>20</strong>.24h precipitation verification - <strong>RUC</strong> 40 vs. <strong>RUC</strong> 20- vs. NCEP 24h precipitation analysis(20 March - 15 April 2001)0.4Bias - precipitation forecasts - <strong>RUC</strong> 40 vs. <strong>RUC</strong> 20(20 March - April 2001)1.2Equitable threat score0.350.30.250.20.150.10.05<strong>RUC</strong> 40 - ets<strong>RUC</strong> 20 - etsBias10.80.60.40.2<strong>RUC</strong> 40 - bias<strong>RUC</strong> 20 - bias00 0.5 1 1.5 2threshold - in00 0.5 1 1.5 2threshold - inFigure 7. Precipitation verification comparing <strong><strong>RUC</strong>20</strong> and <strong>RUC</strong>40 forecasts, a) equitable threat score andb) bias. Verification is against NCEP 24-h precipitation analysis. For period 20 March – 15 April 2001.As with the <strong>RUC</strong>40, the inclusion of downdrafts in the Grell scheme results in smaller-scale details in <strong>RUC</strong> warmseason precipitation patterns than may be evident in that from the Eta model using the Betts-Miller-Janjic convectiveparameterization. This same difference in character of precipitation forecasts is also evident in NCEP/NSSLexperiments comparing the Kain-Fritsch (which also includes downdrafts) and Betts-Miller-Janjic schemes bothwithin the MesoEta model (e.g., Kain et al. 1998).3.b.3. Land-surface physics.A new version of the <strong>RUC</strong> land-surface model (LSM) is used in the <strong><strong>RUC</strong>20</strong>, including accounting for freezing andthawing of soil, and using a 2-layer representation of snow (Smirnova et al. 2000b). This updated LSM is arefinement of the previous <strong>RUC</strong>40 version discussed in Smirnova et al. (1997). Surface (shelter/anemometer level)forecasts are often critically dependent on accurate estimates of surface fluxes, and in turn, on reasonably accuratesoil moisture and temperature estimates. The <strong>RUC</strong> soil model contains heat and moisture transfer equations solvedat 6 levels for each column together with the energy and moisture budget equations for the ground surface. Thesebudgets are applied to a thin layer spanning the ground surface and including both the soil and the atmosphere withcorresponding heat capacities and densities. (The budget formulation is one of the primary differences between the<strong>RUC</strong> LSM and LSMs in other operational models.) A treatment of the evapotranspiration process, developed byPan and Mahrt (1987), is implemented in the <strong>RUC</strong> LSM. When snow cover is present, snow is considered to be anadditional one or two upper layers of soil, depending on its depth.12
3g ( )32<strong><strong>RUC</strong>20</strong><strong>RUC</strong>402<strong><strong>RUC</strong>20</strong><strong>RUC</strong>40bias( f - o)10-16-h fcstsbias (f - o)10-112-h fcsts-2-2-30 300 600 900 1200 1500 1800 2100cycle (UTC)-30 300 600 900 1200 1500 1800 2100cycle (UTC)Figure 8. Diurnal variation of 2-m temperature (°C) bias (forecast-obs) in <strong><strong>RUC</strong>20</strong> and <strong>RUC</strong>40 forecasts.Forecast valid times on horizontal axis. Verification against METAR observations in <strong>RUC</strong> domain east of105°W. a) for 6-h forecasts, b) for 12-h forecasts.Figure 9. Comparison of 2-m temperature (°F) 12-h forecasts from <strong>RUC</strong>40 (upper left) and <strong><strong>RUC</strong>20</strong> (lowerleft) valid 1200 UTC 22 Feb 2002. Verification analyses from <strong>RUC</strong>40 (upper right) and <strong><strong>RUC</strong>20</strong> (lower right).13
To provide a more accurate solution of the energy budget through deeper snow, a snowpack thicker than 7.5 cm issplit up into two layers where the top layer is set to be 7.5 cm deep, and the energy budget is applied to the top halfof this top layer. A heat budget is also calculated at the boundary between the snow pack and the soil, allowingmelting from the bottom of the snow layer. Incorporation of a two-layer snow representation into the land-surfacescheme in the <strong><strong>RUC</strong>20</strong> significantly improves the skin temperatures in winter, and therefore, also the 2-mtemperature forecasts (Figs. 8, 9).The accumulation of snow on the ground surface is provided by the mixed-phase cloud microphysics algorithm ofthe <strong>RUC</strong> forecast scheme (Reisner et al. 1998, Brown et al. 2000, section 3.b.1 of this document). It predicts thetotal amount of precipitation and also the distribution of precipitation between the solid and liquid phase. In the<strong><strong>RUC</strong>20</strong>, the Grell/Devenyi convective parameterization scheme now also contributes to the snow accumulation ifthe surface temperature is at or below 0° C.As with the <strong>RUC</strong>40, the <strong><strong>RUC</strong>20</strong> cycles volumetric soil moisture and soil temperature at the 6 soil model levels, aswell as canopy water, and snow temperature. In the <strong><strong>RUC</strong>20</strong>, cycling of the snow temperature of the second layer(where needed) is also performed. The <strong>RUC</strong> continues to be unique among operational models in its specification ofsnow cover and snow water content through cycling (Smirnova et al. 2000b). The 2-layer snow model in the<strong><strong>RUC</strong>20</strong> improves this cycling, especially in spring time, more accurately depicting the snow melting season andspring spike in total runoff, as shown in 1-dimensional experiments with the <strong>RUC</strong> LSM over an 18-year period froma site in Russia (Smirnova et al 2000b).The <strong><strong>RUC</strong>20</strong> also uses a different formulation for thermal conductivity (Johansen 1975, Peters-Lidard 1998) thatgenerally reduces values of this parameter, especially in near-saturated soils, thereby contributing to a strongerdiurnal cycle. This change helps to correct an inadequate diurnal cycle (daytime too cool, nighttime too warm) inthe <strong>RUC</strong>40. Figure 8 shows that the diurnal cycle is better depicted in the <strong><strong>RUC</strong>20</strong> but that there is still someremaining tendency for inadequate nighttime cooling. An example of improved surface temperature forecasts isprovided in Fig. 9, where the <strong><strong>RUC</strong>20</strong> provides more accurate forecasts in the central plains (cooler), northernIndiana and Ohio (warmer), and central California (cooler) than the <strong>RUC</strong>40 for this overnight 12-h forecast endingat 1200 UTC 22 Feb 2002. Schwartz and Benjamin (2002) show that the <strong><strong>RUC</strong>20</strong> provides improved 2-mtemperature and 10-m wind forecasts, especially during daytime.3.b.4. Atmospheric radiation.The <strong><strong>RUC</strong>20</strong> continues to use the MM5 atmospheric radiation package (Dudhia 1989, Grell et al. 1994) withadditions for attenuation and scattering by all hydrometeor types. This scheme is a broadband scheme with separatecomponents for longwave and shortwave radiation. In the <strong><strong>RUC</strong>20</strong>, the calculation of shortwave radiation iscorrected for a 30-min mean time lag in solar radiation present in the <strong>RUC</strong>40. This correction helps to improvemorning near-surface temperature forecasts (e.g., Fig. 8 results for forecasts valid at 1500 UTC). The <strong><strong>RUC</strong>20</strong> alsoupdates shortwave radiation more frequently, every 30 min instead of every 60 min in <strong>RUC</strong>40 (Table 4). Theupdating of longwave radiation remains every 60 min in <strong><strong>RUC</strong>20</strong>, same as <strong>RUC</strong>40.3.b.5. Turbulent mixing.The <strong><strong>RUC</strong>20</strong> continues to prescribe turbulent mixing at all levels, including the boundary layer, via the explicitturbulence scheme of Burk and Thompson (1989). This scheme is a level-3.0 scheme, with explicit forecast ofturbulent kinetic energy and three other turbulence variables. The surface layer mixing continues to be prescribed byMonin-Obukhov similarity theory, specifically the three-layer scheme described in Pan et al. (1994). With theBurk-Thompson scheme, the <strong>RUC</strong> typically forecasts TKE amounts of 5-20 J/kg in the boundary layer, and alsoforecasts TKE maxima aloft, typically localized in frontal zones, corresponding to likely areas for clear-airturbulence.3.b.6. Time splitting for physical parameterizationsAs with other mesoscale models, the <strong>RUC</strong> gains efficiency by not calling physical parameterizations at the fullfrequency of each dynamic time step. Time truncation errors are, however, incurred by this time splitting. In the<strong><strong>RUC</strong>20</strong>, the frequency of calls to physical parameterizations has been increased, as is shown in Table 4. Of thesechanges, the one for the cloud microphysics is most significant, decreasing time truncation errors associated withmicrophysical processes and precipitation fallout.14
Physical parameterization <strong>RUC</strong>40 frequency(min)<strong><strong>RUC</strong>20</strong> frequency(min)Cloud microphysics 10 2Convection 5 2Turbulence 5 2Land-surface 5 2Shortwave radiation 60 30Longwave radiation 60 60Table 4. Frequency of calls to physical parameterizations in <strong>RUC</strong>40 and <strong><strong>RUC</strong>20</strong>.The application of tendencies (rate of change to temperature, moisture, wind, etc.) from the physicalparameterizations is also different in <strong><strong>RUC</strong>20</strong>. In <strong>RUC</strong>40, tendencies from each physics routine except for radiationwere applied with the parameterization time step only when the parameterization was called instead of being spreadevenly over the interval between calls. This technique, which we inelegantly term “chunking”, causes some shockto the model, although the effects did not seem harmful. In the <strong><strong>RUC</strong>20</strong>, tendencies are applied at each dynamicstime step, thus avoiding “chunking”.4. CHANGES TO LATERAL AND LOWER BOUNDARY CONDITIONS IN <strong><strong>RUC</strong>20</strong>4.a. Lateral boundary conditionsWith the <strong><strong>RUC</strong>20</strong>, lateral boundary conditions are specified from Eta model runs made every 6 h. Thus, the lateralboundaries are updated with more recent data than with <strong>RUC</strong>40, for which new Eta runs were incorporated onlyevery 12 h. The output frequency from the Eta used for the <strong>RUC</strong> boundary conditions is 3 h. The Eta data used for<strong>RUC</strong> lateral boundary conditions are currently from 25-hPa 40-km output grids. The Eta model forecasts areinterpolated to the <strong><strong>RUC</strong>20</strong> domain on its hybrid coordinate levels. Values of pressure thickness, virtual potentialtemperature, and horizontal winds at the edge of the <strong>RUC</strong> domain (up to 5 grid points from the boundary) arenudged (Davies 1976) toward the Eta values at each time step in a model run. For the <strong><strong>RUC</strong>20</strong>, fixes have beenmade in application of lateral boundary conditions, resulting in smoother fields near the boundaries.It is important to note that since the <strong>RUC</strong> runs prior to the Eta in NCEP’s operational suite, it uses “old” boundarycondition data for model forecasts made at 0000 and 1200 UTC. This timing sequence results in a slightdegradation of quality of <strong>RUC</strong> forecasts near the boundaries for runs initialized at these times. Tests at FSL inwhich the <strong>RUC</strong> runs at 0000 and 1200 UTC are made after Eta boundary conditions are available at those sametimes show a clear increase in statistical forecast skill.4.b. Lower boundary conditions• Sea-surface temperature – Uses same daily analysis as used for Eta runs (currently, the 50-km global realtimeSST analysis from the NCEP/EMC Ocean Modeling Branch). Higher-resolution information for theGreat Lakes is also incorporated. The <strong>RUC</strong>’s use of SST data is set via scripts to follow any changes madefor the Eta model.o In the <strong><strong>RUC</strong>20</strong>, a bug has been fixed that was causing 1° lat/lon blockiness in the SST used in the<strong>RUC</strong>40. This blockiness was also apparent in the 2-m temperatures over oceans (e.g., Fig. 10).o Monthly climatological values are used for Great Salt Lake in <strong><strong>RUC</strong>20</strong> but not <strong>RUC</strong>40 (L. Dunn,personal communication). Time interpolation is to date of month.15
oFigure 10. 2-m temperature 12-h forecasts from a) <strong>RUC</strong>40, b) <strong><strong>RUC</strong>20</strong>, valid at 1200 UTC 21Feb 2001• Ice cover – <strong><strong>RUC</strong>20</strong> uses NESDIS daily ice analysis, same as used by Eta model. No change from <strong>RUC</strong>40.• Land use – <strong><strong>RUC</strong>20</strong> land-use (Fig. 11b) is taken from USGS 24-class, 30-second data set used in MM5 andWRF (Weather Research and Forecasting) model pre-processing programs. <strong>RUC</strong>40 (Fig. 11a) used oldMM4 land-use data with 1° lat/lon resolution and caused blockiness in <strong>RUC</strong>40 surface fields.Figure 11. Land-use for a) <strong>RUC</strong>40 and b) <strong><strong>RUC</strong>20</strong>• Soil texture – <strong><strong>RUC</strong>20</strong> uses much higher resolution information than in <strong>RUC</strong>40. <strong><strong>RUC</strong>20</strong> soil type data aretaken from a global 30-second dataset, accessible from the WRF preprocessor code.• Vegetation fraction – For both <strong><strong>RUC</strong>20</strong> and <strong>RUC</strong>40, this is specified from monthly high-resolution (0.144°)data produced from 5-year climatology (Gutman and Ignatov 1998) of NDVI (normalized digital vegetationindex, an AVHRR-based satellite product). This is the same data set used by the Eta model. Values areinterpolated by date of month between monthly values assumed to be valid on the 15 th of each month.• Albedo – For <strong><strong>RUC</strong>20</strong>, this is also specified from NESDIS monthly high-resolution (0.144°) data producedfrom a 5-year climatology (Csiszar and Gutman 1999), and this is the same dataset used by Eta model. Inthe <strong>RUC</strong>40, albedo data were from a much coarser 1° seasonal climatology dataset.• Terrain elevation – As described in section 2.5. ANALYSIS CHANGES IN <strong><strong>RUC</strong>20</strong>16
The <strong><strong>RUC</strong>20</strong> analysis continues to use an optimal interpolation (OI) analysis applied on the <strong>RUC</strong> native hybridisentropic-sigma levels, but with some important modifications from the <strong>RUC</strong>40 OI analysis, as described below.[A 3-dimensional variational (3DVAR) analysis has been developed for the <strong>RUC</strong> (Devenyi et al 2001); some furthertuning is needed to squeeze out a little more skill in 3-h forecasts before it can be implemented. It is hoped that the<strong>RUC</strong> 3DVAR can be implemented 5-6 months after the initial <strong><strong>RUC</strong>20</strong> implementation.]5.a. Assimilation of GOES cloud-top pressure dataToward the goal of improved short-range forecasts of cloud/hydrometeors, icing, and precipitation, an advancedversion of the <strong>RUC</strong> cloud-top pressure assimilation technique (Benjamin et al 2002b) has been developed and tested.This improved technique, using GOES single field-of-view cloud-top pressure and temperature data provided byNESDIS, is being implemented into operations with the rest of the <strong><strong>RUC</strong>20</strong>. As described in section 3.b.1, the <strong>RUC</strong>uses a bulk mixed-phase cloud microphysics scheme from the NCAR/Penn State MM5 model, with 5 hydrometeortypes explicitly forecast (Brown et al. 2000). The prognostic variables in this scheme are mixing ratios of watervapor, cloud water, rain water, ice, snow, and graupel, and number concentration of ice particles. In the <strong>RUC</strong>40, theinitial conditions for the fields were simply those carried over from the previous 1-h <strong>RUC</strong> forecast. In the <strong><strong>RUC</strong>20</strong>including assimilation of GOES cloud-top data, these fields are modified each hour as part of the cloud clearing andcloud building.The <strong><strong>RUC</strong>20</strong> cloud/hydrometeor analysis technique is an advanced version of the procedures previously described byKim and Benjamin (2001, 2000). GOES cloud-top pressure data provide information on the horizontal location ofcloudy and cloud-free areas, but not on cloud depth. Also, unless there are broken layers, it cannot provideinformation on multiple cloud layers. Thus, the <strong>RUC</strong> cloud/hydrometeor assimilation technique is designed to usethis partial information. When GOES data indicate that no clouds are present, the technique removes anyhydrometeors and reduces water vapor mixing ratio to a subsaturation value. When GOES data indicate that cloudnot present in the <strong>RUC</strong> 1-h forecast at the correct level, cloud water and/or ice is added in a layer of not more than50 hPa depth. This layer is also saturated with respect to water or ice with a linear variation between these twosaturation vapor pressure values in the 248-263 K range.Other features of the <strong>RUC</strong> GOES cloud-top assimilation include:• Rederivation of cloud-top pressure from GOES cloud-top temperature if the original retrieval of cloud-toppressure is closer to the ground than 620 hPa. This rederivation of the cloud-top pressure uses the <strong>RUC</strong> 1-htemperature/moisture profile at the nearest grid point.• Use of single field-of-view GOES data (~10-km resolution). The median values from the fields-of-viewaround each <strong>RUC</strong> box are used. With this sampling, cloud fraction is calculated in <strong>RUC</strong> grid volumes.• Use of stability check to identify possible sub-field-of-view variations from small convective clouds thatresult in inaccurate cloud-top temperature and pressure determination.• Remove cloud indicators if they only occur at isolated (noncontiguous) <strong>RUC</strong> grid points, again on thepresumption that GOES may be observing sub-field-of-view clouds.• Special handling for marine stratus situations to force cloud-top at consistent level with top of marineinversion in <strong>RUC</strong> background profile.• Information from the GOES effective cloud amount is used to modify a stability constraint for convectionin the subsequent forecast run (see section 3.b.2).17
a)b)Figure 12. Cloud-top pressure valid 1200 UTC 9Dec 2001 for a) <strong>RUC</strong>40 3-h forecast, b) <strong><strong>RUC</strong>20</strong> 3-hforecast, c) analysis using NESDIS cloud-top data.White areas are clear skies.An example of the impact of GOES cloud-topassimilation on <strong>RUC</strong> forecasts is shown in Fig. 12.The <strong>RUC</strong> diagnostic cloud-top pressure field iscalculated by searching downward from the top of themodel at each grid point until a combined hydrometeorc)mixing ratio (cloud water, ice, rain, snow, graupel) ofat least 10 -6 g/g is encountered. (If none isencountered, conditions are regarded as clear skies.) A3-h forecast of cloud-top pressure from the <strong>RUC</strong>40(Fig. 12a) shows a general resemblance to the analysiscloud-top field (Fig. 12c) generated from the NESDIScloud product, but the <strong><strong>RUC</strong>20</strong> 3-h forecast (Fig. 12b)shows much better agreement with the analysis. This improved forecast is due not only to the cloud-top assimilation(and retention in the subsequent forecast), but also to other changes in the <strong><strong>RUC</strong>20</strong> including improved microphysicsand higher resolution.Ongoing statistical verification has been performed, calculating correlation coefficients between the NESDIS cloudtopproduct and <strong>RUC</strong>40 and <strong><strong>RUC</strong>20</strong> forecasts of durations from 1 h to 12 h. These statistics (Benjamin et al 2002b)show that the <strong><strong>RUC</strong>20</strong> produces improved cloud-top forecasts over <strong>RUC</strong>40 not just at 1-h and 3-h projections, butwith similar improvement out to 12-h forecasts.5.b. Improved observation pre-processingThe most important changes in the <strong><strong>RUC</strong>20</strong> OI analysis are the observation preprocessing and matching tobackground values. In the observation preprocessing, a more flexible, lower-memory, observation array structure isused in the <strong><strong>RUC</strong>20</strong> that allows each level of a profile observation (e.g., rawinsonde, profiler, VAD) to be associatedwith its own metadata (position, time, expected error) if necessary. This structure was developed for the <strong>RUC</strong>3DVAR but is also used in the <strong><strong>RUC</strong>20</strong> OI analysis. It allows, among other things, for use of varying positions toaccount for balloon drift in rawinsonde observations. However, the decision was made to not incorporate balloondrift in the <strong><strong>RUC</strong>20</strong> analysis since the effects of time change and position drift largely cancel each other.18
The following features are implemented in the <strong><strong>RUC</strong>20</strong> observation preprocessing to improve the use of observationsin the analysis. The goal of these features is to match the information in the observation and background as nearlyas possible.• Surface observationso Calculate 2-m temperature and moisture values and 10-m winds from background, instead ofsimply taking the 5-m background values. The result of this is reduced bias in the analysis.o Choose nearest land grid point from background for most surface observations over land, butchoose nearest water grid point for buoy surface observations when calculating observationminus-backgroundvalues for coastal surface stations. This improves the <strong><strong>RUC</strong>20</strong> analyzed surfacefields in coastal regions.o Improve use of background model lapse rate to match observations and background when theelevation is different. This constrained lapse rate reduction is applied for surface temperatureobservations, and the surface moisture observation is correspondingly modified such that theoriginal dewpoint depression is maintained.• Rawinsonde/profiler observationso Use code to preserve observed near-surface structure when rawinsonde surface elevation does notmatch that of model background. This logic is similar to that used for surface observations.o Use raw level observations now in addition to values interpolated to background levels (also usedfor wind profiler and VAD observations).o Prevent use of interpolated values if significant level data not present. For profilers, prevent use ofinterpolated values if separation between raw values exceeds 1200 m. This change in the <strong><strong>RUC</strong>20</strong>prevents a <strong>RUC</strong>40 problem in which unrealistic linearly interpolated profiles were used whenthere were large vertical gaps in rawinsonde, profiler, or VAD observation profiles.• Precipitable water observationso Account for elevation differences between observation and background.5.c. Modifications to optimal interpolation analysisA detailed description of the <strong>RUC</strong> OI analysis from the <strong>RUC</strong>40 is available in the <strong>RUC</strong>-2 <strong>Technical</strong> <strong>Procedures</strong><strong>Bulletin</strong> (Benjamin et al 1998, available from the <strong>NWS</strong> at http://205.156.54.206/om/tpb/448.htm ).Modifications made in the <strong><strong>RUC</strong>20</strong> to other aspects of the OI analysis are listed below.• Quality control – Continues to use the OI-based buddy check. In <strong><strong>RUC</strong>20</strong>, a buddy check is now performedfor cloud-drift winds and precipitable water observations (not in <strong>RUC</strong>40) and bugs are fixed. <strong><strong>RUC</strong>20</strong>honors NCEP observation QC flags, which was not done in <strong>RUC</strong>40. This means, for instance, that qualityflags from the <strong>NOAA</strong> Profiler Hub are now being used.• Improved observation search strategy allowing much more complete use of aircraft ascent/descent profilesthan in <strong>RUC</strong>40.• Moisture analysis looping – In order to force some interconsistency in the <strong><strong>RUC</strong>20</strong> analysis betweendifferent moisture observations, a two-pass loop is performed. Within each loop, the analysis order is asfollows: cloud-top observations, precipitable water observations, in situ moisture observations. Theobservation-minus-background values are recalculated after each part of the moisture analysis, and in situobservations are given the “last say”.• Moisture variable – changed from condensation pressure in <strong>RUC</strong>40 to natural logarithm of water vapormixing ratio (ln q). This simplifies the variable transformation needed for precipitable water analysis andcloud-top assimilation. The variable ln q is conserved under motion in adiabatic conditions, considered tobe desirable for the choice of an analysis variable. The cycled water vapor variable in the <strong>RUC</strong> andprognostic variable in the <strong>RUC</strong> model continues to be water vapor mixing ratio.• Constraints applied at end of analysiso A series of top-down and bottom-up lapse rate checks are applied which are designed to preventunrealistic lapse rates from occurring in the <strong><strong>RUC</strong>20</strong> temperature profiles. These checks alsoimprove the retention of surface temperature observations under conditions of a deep boundarylayer. A shallow superadiabatic layer near the surface of up to 1.5 K is allowed in these checks.o Supersaturation is removed (also performed in <strong>RUC</strong>40 analysis).19
• NCEP quality control flags for individual observations are used, and suspect observations are flagged sothat they will not be used in the <strong><strong>RUC</strong>20</strong> analysis.• More robust hybrid coordinate adjustment.The <strong><strong>RUC</strong>20</strong> OI analysis has been tested extensively at FSL with three additional new observation types:• GPS ground-based precipitable water values (now over 100 in U.S.)• 915 MHz boundary-layer profilers (about 25 in <strong>RUC</strong> domain)• RASS temperature low-level virtual temperature profiles from selected 405 MHz and 915 MHz profilersWork by FSL and NCEP is nearly complete to make these observations available to the <strong>RUC</strong> and other NCEPoperational models, and it is likely that they will be added to the <strong><strong>RUC</strong>20</strong> within 3 months after its initialimplementation.6. <strong><strong>RUC</strong>20</strong> OUTPUT FILES AND VARIABLES6.a. Output filesThe output files from the <strong><strong>RUC</strong>20</strong> are essentially the same as those produced by the <strong>RUC</strong>40, except that they will beavailable at both 20-km and 40-km resolution. The 40-km files are meant to provide ‘look-alike’ files so that thechange will be relatively transparent to <strong>RUC</strong> users. A list of the variables in each of these files is provided athttp://ruc.fsl.noaa.gov/ruc2vars.html . The gridded files provided by the <strong><strong>RUC</strong>20</strong> are reviewed below:• Native (bgrb, bgrb20) files – 14 3-D variables (no change from <strong>RUC</strong>40) and 46 2-d variables (the last 8 arenew, but the first 38 are identical to those being produced currently by the <strong>RUC</strong>40).o There are 50 vertical levels in the bgrb files at both 20-km and 40-km resolution, different fromthe 40 levels in the <strong>RUC</strong>40 bgrb files.• Isobaric (pgrb, pgrb20) files – 6 3-D variables at 25-hPa vertical resolution from 1000-100 hPa and 88 2-dvariables (surface, precipitation, mean-layer values, etc.). Surface pressure substituted for altimeter setting.Otherwise, no change from <strong>RUC</strong>40 variables.• Surface (sgrb, sgrb20) files – 25 2-D variables (surface, precipitation, precipitation type, stability indices,etc.). Surface pressure substituted for altimeter setting. Otherwise, no change from <strong>RUC</strong>40 variables. Allfields in the sgrb files are also found in the pgrb files.Improved BUFR data are available from <strong><strong>RUC</strong>20</strong>. Hourly BUFR soundings with the same format as used for the Etamodel are available with the <strong><strong>RUC</strong>20</strong>, including individual station files. These individual station files (only ~25-50KB each) were not available with the <strong>RUC</strong>40. The hourly output to 12 h is also new with the <strong><strong>RUC</strong>20</strong>. The stationlist is the same as that used for the Eta model for stations within the <strong>RUC</strong> domain. (One small difference in theBUFR data is that the <strong>RUC</strong> uses 6 soil levels compared with 4 levels with Eta BUFR output.) The so-called“monolithic” files with all stations and all output times are also available from the <strong><strong>RUC</strong>20</strong>.A summary of this information is available at http://ruc.fsl.noaa.gov/ruc20.data-access.html .6.b. Changes to GRIB identifiers for <strong><strong>RUC</strong>20</strong>When the <strong>RUC</strong>40 was implemented, some GRIB parameter values were used on an interim basis until officialdesignations were made. Since the <strong>RUC</strong>40 implementation, these GRIB parameter values have been officiallyassigned. These updated parameter values have also been changed (see Table 5) in the <strong><strong>RUC</strong>20</strong>.Field Parameter value in <strong>RUC</strong>40 Parameter value in <strong><strong>RUC</strong>20</strong>Water vapor mixing ratio 185 53Gust wind speed 255 180Soil moisture availability 199 207Soil volumetric moisture content 86 144Table 5. Changes in GRIB variable parameters in <strong><strong>RUC</strong>20</strong>20
Also, the GRIB level parameter for snow temperature is corrected from 116 in <strong>RUC</strong>40 to 111 in <strong><strong>RUC</strong>20</strong>.6.c. Basic 3-D output variablesThere is no change in the 3-dimensional variables output by the <strong><strong>RUC</strong>20</strong> for either bgrb (native) or pgrb (isobaric)fields resulting from post-processing changes except that isobaric heights from the <strong><strong>RUC</strong>20</strong> are smoother due to extrasmoothing passes.6.d. <strong>RUC</strong> 2-D diagnosed variablesAs with the 3-D fields, the 2-D fields from the <strong><strong>RUC</strong>20</strong> are different from those produced by the <strong>RUC</strong>40 due to all ofthe analysis, model, resolution, etc. changes listed in previous sections. Below are listed 2-D output variables forwhich there are significant changes from changes in diagnostic techniques or for other reasons not previouslyaddressed in this document.• 2-m temperature and dewpoint, and 10-m winds. Similarity theory is used to derive values at these levelsrather than the previous approximation of simply using the 5-m values. Note that the <strong><strong>RUC</strong>20</strong> continues to usea separate topography file (TOPOMINI, recalculated for 20km resolution) designed to more closely matchMETAR elevations than the model elevation, as shown in Table 6. The 20-km TOPOMINI matches theMETAR elevations more closely than the 40-km version. The 2-m temperature and dewpoint temperaturevalues from the <strong>RUC</strong> are not from the model terrain but are instead reduced to the TOPOMINI elevation.Thus, the <strong><strong>RUC</strong>20</strong> 2-m temperature and dewpoint values include effects both from reduction to the TOPOMINIelevation and similarity reduction to 2-m above the surface. In the <strong><strong>RUC</strong>20</strong>, the TOPOMINI is based not onlyon the minimum 10-km values within each 20-km grid box, but also includes a subsequent correction fromMETAR station elevations using a very short-length Cressman analysis.• convective available potential energy. Some bug fixes resulting in smoother CAPE and CIN (convectiveinhibition) fields.• helicity – corrections to helicity and storm-relative motion calculations, including change to Bunkers et al.(2000) formulation.Figure 13. Visibility (mi) valid at 1200 UTC 30 January 2002. a) <strong>RUC</strong>40 0-h forecast, b) <strong><strong>RUC</strong>20</strong> 0-h forecast,c) METAR observations.21
• MAPS mean sea-level pressure – Bug fixed for reduction over higher terrain, resulting in more coherentSLP patterns than in <strong>RUC</strong>40.• precipitation type – Less diagnosis of sleet (ice pellets) in <strong><strong>RUC</strong>20</strong> due to cloud microphysics changesdescribed in section 3.b.1.• visibility (see Smith et al. 2002, Smirnova et al. 2000a) – <strong><strong>RUC</strong>20</strong> diagnostic changed to use multiple levelsnear surface for hydrometeor and relative humidity and modification in hydrometeor and relative humidityeffects. An example of an improved visibility diagnostic is shown in Fig. 13, a situation with widespread fogin the southeastern U.S.Rawinsonde stationStation elevationminus <strong><strong>RUC</strong>20</strong>model elevation (m)Station elevation minus<strong><strong>RUC</strong>20</strong> TOPOMINIelevation (m)Edwards AFB, CA 41 -20Denver, CO 26 28Grand Junction, CO 323 6Boise, ID 253 69Great Falls, MT 29 -29Reno, NV 144 -83Elko, NV 152 -27Medford, OR 346 105Salem, OR 51 6Rapid City, SD 45 -70Salt Lake City, UT 438 10Riverton, WY 119 -74Table 6. Terrain elevation difference between station elevation and interpolated <strong><strong>RUC</strong>20</strong> elevation for selectedrawinsonde stations in western United States. Column 2 shows this difference for the <strong><strong>RUC</strong>20</strong> model elevationfield, and column 3 shows this difference for the <strong><strong>RUC</strong>20</strong> TOPOMINI elevation used for reducing 2-mtemperature and dewpoint fields.A detailed description of techniques to derive <strong>RUC</strong> diagnostic variables is available athttp://ruc.fsl.noaa.gov/vartxt.html . Some of these are listed below, and are unchanged from <strong>RUC</strong>40.Relative humidity - Defined with respect to saturation over water in the <strong>RUC</strong> isobaric fields and in the surfacerelative humidity field.Freezing levels - Two sets of freezing levels are output from <strong>RUC</strong>, one searching from the bottom up, and onesearching from the top down. Of course, these two sets will be equivalent under most situations, but they maysometimes identify multiple freezing levels. The bottom-up algorithm will return the surface as the freezing level ifany of the bottom three native <strong>RUC</strong> levels (up to about 50 m above the surface) are below freezing (per instructionsfrom Aviation Weather Center, which uses this product). The top-down freezing level returns the first level at whichthe temperature goes above freezing searching from the top downward. For both the top-down and bottom-upalgorithms, the freezing level is actually interpolated between native levels to estimate the level at which thetemperature goes above or below freezing.Tropopause pressure - Diagnosed from the 2.0 isentropic potential vorticity unit (PVU) surface. The 2.0 PVUsurface is calculated directly from the native isentropic/sigma <strong>RUC</strong> grids. First, a 3-D PV field is calculated in thelayers between <strong>RUC</strong> levels from the native grid. Then, the PV=2 surface is calculated by interpolating in the layerwhere PV is first found to be less than 2.0 searching from the top down in each grid column. Low tropopause22
egions correspond to upper-level waves and give a quasi-3D way to look at upper-level potential vorticity. Theyalso correspond very well to dry (warm) areas in water vapor satellite images, since stratospheric air is very dry.MAPS mean sea-level pressure - This reduction (Benjamin and Miller 1990) is the one used in previous versionsof the <strong>RUC</strong>. It uses the 700 hPa temperature to minimize unrepresentative local variations caused by local surfacetemperature variations. It has some improvement over the standard reduction method in mountainous areas andgives geostrophic winds that are more consistent with observed surface winds. As noted earlier, a bug fix forreduction over higher terrain is included in the <strong><strong>RUC</strong>20</strong>, improving the coherence of the sea-level pressure pattern inthese areas.3-h surface pressure change - These fields are determined by differencing surface pressure fields at valid timesseparated by 3 h. Since altimeter setting values (surface pressure) are used in the <strong>RUC</strong> analyses, this field reflectsthe observed 3-h pressure change fairly closely over areas with surface observations. It is based on the forecast indata-void regions. The 3-h pressure change field during the first 3 h of a model forecast often shows some nonphysicalfeatures, resulting from gravity wave sloshing in the model. After 3 h, the pressure change field appears tobe quite well-behaved. The smaller-scale features in this field appear to be very useful for seeing predictedmovement of lows, surges, etc. despite the slosh at the beginning of the forecast.2m temperature, dewpoint temperature - Temperature and dewpoint temperatures displayed are extrapolated to a"minimum" topography field to give values more representative of valley stations in mountainous areas, wheresurface stations are usually located.Precipitation accumulation - All precipitation values, including the 12-h total, are liquid equivalents, regardless ofwhether the precipitation is rain, snow, or graupel.Resolvable and subgrid scale precipitation – The Grell family of convective schemes used in the <strong>RUC</strong> tends toforce grid-scale saturation in its feedback to temperature and moisture fields. One result of this is that for the <strong>RUC</strong>model, some of the precipitation from weather systems that might be considered to be largely convective will bereflected in the resolvable-scale precipitation. Thus, the subgrid scale precipitation from <strong>RUC</strong> should not beconsidered equivalent to “convective precipitation.”Snow accumulation - Snow accumulations are calculated using a 10 to 1 ratio between snow and liquid waterequivalent. Of course, in reality, the ratio of snow to liquid water equivalent varies, but the ratio used here was set atthis constant value so that users will know the water equivalent exactly.Also, snow accumulation (through the snow liquid water equivalent) is not diagnosed based on temperature, but isexplicitly forecast through the mixed-phase cloud microphysics in the <strong>RUC</strong> model.Categorical precipitation types - rain/snow/ice pellets/freezing rain - These yes/no indicators are calculated fromthe explicit cloud microphysics in the <strong>RUC</strong> model (see section 3.b.1). These values are not mutually exclusive.More than one value can be yes (1) at a grid point. In other words, the <strong>RUC</strong> can predict mixed precipitation types.Here is how the diagnostics are done:Diagnostic logic for precipitation types• SnowThere are a few ways to get snow.o If fall rate for snow mixing ratio at ground is at least 0.2 x 10 -9 g/g/second, snow is diagnosed.o If fall rate for graupel mixing ratio at ground is > 1.0 x 10 -9 g/g/s and• surface temp is < 0 deg C, and max rain mixing ratio at any level < 0.05 g/kg or thegraupel rate at the surface is less than the snow fall rate, snow is diagnosed.• surface temp is between 0 - +2 deg C, snow is diagnosed.23
• Rain - If the fall rate for rain mixing ratio at ground is at least 0.01 g/g/second, and the temperature at thesurface is > or = 0 deg C, then rain is diagnosed. The temperature used for this diagnosis is that at theminimum topography, described above.• Freezing rain - Same as for rain, but if the temperature at the surface is < 0 deg C and some level above thesurface is above freezing, freezing rain is diagnosed.• Ice pellets - Ifo the graupel fall rate at the surface is at least 1.0 x 10 -9 g/g/s ando the surface temp is < 0 deg C and the max rain mixing ratio in the column is > 0.05 g/kg ando the graupel fall rate at the surface is greater than that for snow mixing ratio,then ice pellets are diagnosed.CAPE (Convective available potential energy) - Energy available for buoyant parcel from native <strong>RUC</strong> levels withmaximum buoyancy within 300 hPa of surface. Before the most buoyant level is determined, an averaging ofpotential temperature and water vapor mixing ratio is done in the lowest seven <strong>RUC</strong> native levels (about 40 hPa).CIN (Convective inhibition) -- Negative buoyant energy in layer through which a potentially buoyant parcel must belifted before becoming positively buoyant.Lifted index / Best lifted index - Lifted index uses the surface parcel, and best lifted index uses buoyant parcelfrom the native <strong>RUC</strong> level with maximum buoyancy within 300 hPa.Precipitable water - Integrated precipitable water vapor from surface of <strong>RUC</strong> model to top level (~50 hPa). Theprecipitable water calculation is performed by summing the product of the specific humidity at each level times themass of each surrounding layer. This mass layer is bounded by the mid-points between each level, since the native<strong>RUC</strong> vertical grid is nonstaggered.7. STATISTICAL VERIFICATION AGAINST RAWINSONDES<strong><strong>RUC</strong>20</strong> forecast skill was compared with that of the <strong>RUC</strong>40 for retrospective periods from February 2001 (coldseason, statistics at http://www.emc.ncep.noaa.gov/mmb/ruc2/oiretrostats/) and July 2001 (warm season, statistics athttp://www.emc.ncep.noaa.gov/mmb/ruc2/summerretrostats/). In addition, recent real-time runs provide resultsfrom cold season and transition season periods (statistics at http://www.emc.ncep.noaa.gov/mmb/ruc2/stats). Ingeneral, <strong><strong>RUC</strong>20</strong> analyses do not fit rawinsonde data quite as closely at this time as <strong>RUC</strong>40 analyses. This may bedue to improved use of aircraft ascent/descent data in the case of wind and temperature analyses, and the use of ln qas a moisture analysis variable in the case of relative humidity.For wind forecasts (Fig. 14a), the <strong><strong>RUC</strong>20</strong> provides some improvement over the <strong>RUC</strong>40 for 3-h forecasts (margin 0– 0.3 ms -1 ) and for 12-h forecasts (margin 0.1 – 0.4 ms -1 ). For temperatures (Fig. 14b), the <strong><strong>RUC</strong>20</strong> again gives someimprovement by this measure, especially in the lower troposphere.24
Figure 14. Verification of <strong>RUC</strong>40 and <strong><strong>RUC</strong>20</strong> 3-h and 12-h forecasts against rawinsonde observations. Fora) wind, and b) temperature, and for period 22 January – 8 February 2002.8. REFERENCES<strong>RUC</strong> web page – http://ruc.fsl.noaa.gov - real time products and a great deal of other information including a morecomplete list of referencesArakawa, A., and V.R. Lamb, 1977: Computational design of the basic dynamical processes of the UCLA generalcirculation model. Methods in Computational Physics, Vol. 17, Academic Press, 174-265, 337 pp.Benjamin, S.G., J.M. Brown, D. Devenyi, G.A. Grell, D. Kim, T.L. Smith, T.G. Smirnova, B.E. Schwartz, S.Weygandt, K.J. Brundage, and G.S. Manikin, 2002a: The 20-km Rapid Update Cycle--Overview andimplications for aviation applications. 10th Conf. on Aviation, Range, and Aerospace Meteorology,Portland, OR, Amer. Meteor. Soc., 24-27. (available in PDF from http://ruc.fsl.noaa.gov under ‘<strong>RUC</strong>pubs’)Benjamin, S.G., D. Kim, and J.M. Brown, 2002b: Cloud/hydrometeor initialization in the 20-km <strong>RUC</strong> with GOESand radar data. 10th Conf. on Aviation, Range, and Aerospace Meteorology, Portland, OR, Amer. Meteor.Soc., 232-235. (available in PDF from http://ruc.fsl.noaa.gov under ‘<strong>RUC</strong> pubs’)Benjamin, S.G., J.M. Brown, K.J. Brundage, B.E. Schwartz, T.G. Smirnova, T.L. Smith, L.L. Morone, 1998: <strong>RUC</strong>-2 - The Rapid Update Cycle Version 2. <strong>NWS</strong> <strong>Technical</strong> Procedure <strong>Bulletin</strong> No. 448. <strong>NOAA</strong>/<strong>NWS</strong>, 18 pp.[National Weather Service, Office of Meteorology, 1325 East-West Highway, Silver Spring, MD 20910]Available online at http://205.156.54.206/om/tpb/448.htm ).Benjamin, S.G., K.J. Brundage, and L.L. Morone, 1994: The Rapid Update Cycle. Part I: Analysis/modeldescription. <strong>Technical</strong> <strong>Procedures</strong> <strong>Bulletin</strong> No. 416, <strong>NOAA</strong>/<strong>NWS</strong>, 16 pp. [National Weather Service,Office of Meteorology, 1325 East-West Highway, Silver Spring, MD 20910].Benjamin, S. G., K. A. Brewster, R. L. Brummer, B. F. Jewett, T. W. Schlatter, T. L. Smith, and P. A. Stamus, 1991:An isentropic three-hourly data assimilation system using ACARS aircraft observations. Mon. Wea. Rev.,119, 888-906.Benjamin, S. G., and P. A. Miller, 1990: An alternative sea-level pressure reduction and a statistical comparison ofsurface geostrophic wind estimates with observed winds. Mon. Wea. Rev., 118, 2099-2116.Benjamin, S. G., 1989: An isentropic meso-alpha scale analysis system and its sensitivity to aircraft and surfaceobservations. Mon. Wea. Rev., 117, 1586-1603.Bleck, R., and S.G. Benjamin, 1993. Regional weather prediction with a model combining terrain-following andisentropic coordinates. Part I: model description. Mon. Wea. Rev., 121, 1770-1885.25
Brown, J.M., T.G. Smirnova, S.G. Benjamin, R. Rasmussen, G. Thompson, and K. Manning, 2000: Use of a mixedphasemicrophysics scheme in the operational NCEP Rapid Update Cycle. 9th Conf. on Aviation, Range,and Aerospace Meteorology, Amer. Meteor. Soc., Orlando, FL, 100-101.Bunkers, M.J., B.A. Klimowski, J.W. Zeitler, R.L. Thompson, M.L. Weisman, 2000: Prediction of supercell motionusing a new hodograph technique. Wea. Forecast., 15, 61-79.Burk, S.D., and W.T. Thompson, 1989: A vertically nested regional numerical prediction model with second-orderclosure physics. Mon. Wea. Rev., 117, 2305-2324.Csiszar, I. and G. Gutman, 1999: Mapping global land surface albedo from <strong>NOAA</strong>/AVHRR. J Geophys. Res. 104,6215-6228.Davies, H.C., 1976: A lateral boundary formulation for multi-level prediction models. Tellus, 102, 405-418.Devenyi, D., S.G. Benjamin, and S.S. Weygandt, 2001: 3DVAR analysis in the Rapid Update Cycle. 14th Conf. onNumerical Weather Prediction, Fort Lauderdale, FL, Amer. Meteor. Soc., J103-J107.Dudhia, J., 1989: Numerical study of convection observed during the winter monsoon experiment using a mesoscaletwo-dimensional model. J. Atmos. Sci., 46, 3077-3107.Govett, M.W., D.S. Schaffer, T.Henderson, L.B. Hart, J.P. Edwards, C.S. Lior and T.L. Lee, 2001: SMS: Adirective-based parallelization approach for shared and distributed memory high performance computers.Proceedings 9 th ECMWF Workshop on the Use of High Performance Computing in Meteorology,Volume: Developments in TeraComputing, World Scientific, 251-268.Grell, G.A., 1993: Prognostic evaluation of assumptions used by cumulus parameterizations. Mon. Wea. Rev., 121,764-787.Grell, G.A., J. Dudhia, and D.R. Stauffer, 1994: A description of the fifth-generation Penn State/NCAR MesoscaleModel (MM5). NCAR <strong>Technical</strong> Note, NCAR/TN-398 + STR, 138 pp.Grell, G.A., and D. Devenyi, 2001: Parameterized convection with ensemble closure/feedback assumptions. 9thConf. on Mesoscale Processes, Fort Lauderdale, FL, Amer. Meteor. Soc., 12-16.Gutman, G. and A. Ignatov, 1998: The derivation of green vegetation fraction from <strong>NOAA</strong>/AVHRR for use innumerical weather prediction models. Int. J. Remote Sens., 19, 1533-1543.Johansen, O., 1975: Thermal conductivity in soils. Ph.D. thesis, University of Trondheim, 236 pp. (Englishtranslation 637, Cold Reg. Res. and Eng. Lab., Hanover, N.H., 1977).Johnson, D.R., T.H. Zapotocny, F.M. Reames, B.J. Wolf, and R.B. Pierce, 1993: A comparison of simulatedprecipitation by hybrid isentropic-sigma and sigma models. Mon. Wea. Rev., 121, 2088-2114.Johnson, D.R., A.J. Lenzen, T.H. Zapotocny, and T.K. Schaack, 2000: Numerical uncertainties in the simulation ofreversible isentropic processes and entropy conservation. J. Climate, 13, 3860-3884.Kain, J.S., and J.M. Fritsch, 1992: The role of the convective “trigger function” in numerical forecasts of mesoscaleconvective systems. Meteor. Atmos. Phys., 49, 93-106.Kain, J.S., M.E. Baldwin, D.J. Stensrud, T.L. Black, and G.S. Manikin, 1998: Considerations for the implementationof a convective parameterization in an operational mesoscale model. 12 th Conf. Num Wea. Pred., Amer.Meteor. Soc., Phoenix, 103-106.Kim, D., and S.G. Benjamin, 2001: Cloud/hydrometeor initialization for the 20-km <strong>RUC</strong> using satellite and radardata. 14 th Conf. on Num. Wea. Pred., Fort Lauderdale, FL, Amer. Meteor. Soc., J113-J115.Kim, D., and S.G. Benjamin, 2000: An initial <strong>RUC</strong> cloud analysis assimilating GOES cloud-top data. Preprints, 9thConf. on Aviation, Range, and Aerospace Meteorology, AMS, Orlando, 522-524.Lynch, P. and X.-Y. Huang, 1992: Initialization of the HIRLAM model using a digital filter. Mon. Wea. Rev., 120,1019-1034.Pan, H.-L. and L. Mahrt, 1987: Interaction between soil hydrology and boundary-layer development. Bound.-LayerMeteorol., 38, 185-202.Olsen, M.A., W.A. Gallus, J.L. Stanford, and J.M. Brown, 2000: An intense Midwestern cyclone: Fine-scalecomparisons of model analysis with TOMS total ozone data. J. Geophys. Res., 105, 20487-20495.Pan, Z., S.G. Benjamin, J.M. Brown, and T. Smirnova. 1994. Comparative experiments with MAPS on differentparameterization schemes for surface moisture flux and boundary- layer processes. Mon. Wea. Rev. 122,449-470.Peters-Lidard, C. D., E. Blackburn, X. Liang, and E. F. Wood, 1998: The effect of soil thermal conductivityparmeterization on surface energy fluxes and temperatures, J. Atmos. Sci., 55, 1209-1224.Reisner, J., R.M. Rasmussen, and R.T. Bruintjes, 1998: Explicit forecasting of supercooled liquid water in winterstorms using the MM5 mesoscale model. Quart. J. Roy. Meteor. Soc., 142, 1071-1107.26
Schreiner, A. J., T. J. Schmit, W. Paul Menzel, 2001: Clouds based on GOES sounder data. J. Geophys. Res., 106,(D17), 20349-20363.Schwartz, B.E., and S.G. Benjamin, 2002: Verification of <strong>RUC</strong> surface forecasts at major U.S. airport hubs. 10thConf. on Aviation, Range, and Aerospace Meteorology, Portland, OR, Amer. Meteor. Soc., 327-330.(available in PDF from http://ruc.fsl.noaa.gov under ‘<strong>RUC</strong> pubs’)Smirnova, T.G., S.G. Benjamin, and J.M. Brown, 2000: Case study verification of <strong>RUC</strong>/MAPS fog and visibilityforecasts. 9th Conf. on Aviation, Range, and Aerospace Meteorology, AMS, Orlando, 31-36.Smirnova, T.G., J.M. Brown, S.G. Benjamin, and D. Kim, 2000: Parameterization of cold-season processes in theMAPS land-surface scheme. J. Geophys. Res., 105, D3, 4077-4086.Smirnova, T. G., J. M. Brown, and S. G. Benjamin, 1997: Performance of different soil model configurations insimulating ground surface temperature and surface fluxes. Mon. Wea. Rev., 125, 1870-1884.Smith, T.L., and S.G. Benjamin, 2002: Visibility forecasts from the <strong><strong>RUC</strong>20</strong>. 10th Conf. on Aviation, Range, andAerospace Meteorology, Portland, OR, Amer. Meteor. Soc., 150-153. (available in PDF fromhttp://ruc.fsl.noaa.gov under ‘<strong>RUC</strong> pubs’)Smolarkiewicz, P.K., 1983: A simple positive-definite advection transport algorithm. Mon. Wea. Rev., 111, 479-486.APPENDIX A. Known or suspected <strong><strong>RUC</strong>20</strong> biases or deficiencies as of April 2002 (per FSL)• Some remaining light precipitation bias. Even though the <strong><strong>RUC</strong>20</strong> clearly has reduced the dry precipitationbias from the <strong>RUC</strong>40, some of this bias remains (Fig. 7).• Weak diurnal cycle. Again, this problem has been considerably improved in the <strong><strong>RUC</strong>20</strong>, but it has notdisappeared. The <strong><strong>RUC</strong>20</strong> seems to do fairly well for daytime temperatures, but overall, does not cool quiteenough at night (Fig. 8).• Too cold at night over snow cover. The <strong><strong>RUC</strong>20</strong> seems to cool off at night too much over snow coveredareas. FSL has developed a fix to this problem that will be tested further and, if successful, will beimplemented hopefully over the next several months.APPENDIX B. Comments from field users during <strong><strong>RUC</strong>20</strong> evaluation from late March to early April 2002.Fred Mosher – SOO – Aviation Weather CenterWhile the time period for the <strong><strong>RUC</strong>20</strong> evaluation was short, and the weather was rather benign during the evaluationperiod, the evaluation did show the <strong><strong>RUC</strong>20</strong> to be a definite improvement over the current <strong>RUC</strong>2 model. The AWCevaluation focused mainly on the derived hazard fields (clouds, convection, turbulence, and visibility) rather thanthe traditional state of the atmosphere parameters (winds, temperature, etc.). The cloud tops and the convectivecloud tops showed a major improvement, as did the visibility fields. This shows a definite improvement in themoisture distribution and the cloud physics parameterizations within the models, as well as the ability of the <strong><strong>RUC</strong>20</strong>to better assimilate initial time period meteorological information. We did not notice any degradation of the forecastskill for any field, and we did notice big improvements in some fields. Hence the AWC would recommend that the<strong><strong>RUC</strong>20</strong> model become the operational NCEP model used for short-term forecasts.Steve Weiss – SOO – Storm Prediction CenterOur ability to assess the <strong><strong>RUC</strong>20</strong> has been tempered somewhat by the relatively inactive severe weather season so farthis spring, however we have been able to formulate some preliminary assessments based on a small number ofcases so far. I will focus on the Mar 25, Mar 29, and Apr 2 severe weather cases and attach some gif imagesrelevant to each case. In the gif images [not shown here], the <strong>RUC</strong>40x files refer to the <strong><strong>RUC</strong>20</strong> output displayed ona 40 km grid. In addition, Greg Carbin has created two web pages that examine 1) a 3 hour forecast of precipitationvalid at 00z Mar 18, and 2) 06z 28 Mar 00hr forecasts of 850 mb wind associated with the low level jet. These canbe found at1) http://www.spc.noaa.gov/staff/carbin/rucrvu/2) http://www.spc.noaa.gov/staff/carbin/rucrvu2/27
In Greg's first case, the <strong><strong>RUC</strong>20</strong> appears to overforecast the development of a precipitation along a front across theTN valley into AR, with radar showing that an elevated band of convection north of the front (and <strong><strong>RUC</strong>20</strong> forecast)is the primary precipitation activity at the verifying time. In his second case, he observed that the <strong><strong>RUC</strong>20</strong> depicts850 mb winds that are much weaker than observed by profilers and radar VWP. (There is some question regarding apossible influence of birds and/or insects in the profiler/VAD winds, especially near the center of the 850 mb lowwhere you might expect weaker winds.) In both cases, the <strong>RUC</strong>40 appeared to be better than the <strong><strong>RUC</strong>20</strong>. If youhave the data available, it would be good to look back at these cases. [FSL note: This case is a bird contaminationflagging issue. The <strong>RUC</strong>40 does not use the Profiler Hub flags, and so it let through profiler observations that the<strong><strong>RUC</strong>20</strong> did not use since it honors the Profiler Hub flags.]Our assessment focus has been primarily on short range forecasts of moisture, instability, and precipitation insupport of our short range severe weather forecast mission. Overall, we have found no persistent evidencesuggesting that the <strong><strong>RUC</strong>20</strong> should not be implemented as scheduled on April 16. The higher model resolution in the<strong><strong>RUC</strong>20</strong> seems to develop mesoscale features in the precipitation and vertical velocity fields that appear morerealistic than the <strong>RUC</strong>40, even when viewed at identical display resolutions. In addition, our small sample indicatesthe forecasts of MUCAPE are better from the <strong><strong>RUC</strong>20</strong> than the <strong>RUC</strong>40, although aspects of low level temperatureand dew point profiles from one case (Mar 29) raise interesting questions concerning the evolution of the afternoonboundary layer. Given the small number of cases we have seen, we plan to continue evaluating the <strong><strong>RUC</strong>20</strong> duringthis storm season in order to gain a better understanding of its strengths and weaknesses as it relates to convectiveforecasting issues. As always, we appreciate the opportunity to participate in the pre-implementation evaluation.Mar 25...15z runs with forecasts valid at 00z and 03zA weak surface low was forecast to move into central AR during the afternoon, and both <strong><strong>RUC</strong>20</strong> and <strong>RUC</strong>40showed a similar scenario that verified well by 00z. The <strong><strong>RUC</strong>20</strong> predicted higher CAPE into central AR comparedto the <strong>RUC</strong>40 (1000-1500 j/kg versus around 500 j/kg) and the stronger CAPE forecast also verified better. Both<strong>RUC</strong> versions predicted 3 hourly precipitation developing near the front from western TN across AR into parts ofLA and east TX by 00z and continuing through 03z. Although precipitation did develop along the corridorpredicted, both models were too fast in developing storms southward into east TX. The <strong><strong>RUC</strong>20</strong> 700-500 mb meanvertical velocity and 3 hourly precipitation forecasts exhibited more detailed structures that appeared to relate betterto the actual convective development when compared to the <strong>RUC</strong>40 forecasts.Mar 29...12z runs with forecasts valid 00zOn this day, there were two severe threat areas: 1) morning elevated severe storms moving eastward from MOtoward the OH valley were expected to develop southward into the warm sector over AR/TN during the afternoon,and 2) new convection was expected to develop over west/north central TX during the late afternoon or evening asmoisture returned northwestward across TX in advance of a strong upper low moving toward the southern Rockies.Both models were similar in predicting surface dew points over the lower MS valley region although the 12 hourforecast from the <strong><strong>RUC</strong>20</strong> was considered slightly better. Across TX both models did not transport surface moisturefast enough into southwest and central TX, with the <strong>RUC</strong>40 worse than the <strong><strong>RUC</strong>20</strong>. This resulted in not enoughinstability being forecast into central and southwest TX by both models. Overall, the instability predicted over thelower MS valley region by the <strong><strong>RUC</strong>20</strong> was "in the ballpark", and better than that from the <strong>RUC</strong>40 (see below formore discussion of sounding profiles).Twelve-hour forecasts of 3 hourly precipitation were similar from both models but the <strong><strong>RUC</strong>20</strong> showed morerealistic details in structure and location when compared to observed radar images over the OH and lower TNvalleys. Unlike the <strong>RUC</strong>40, the <strong><strong>RUC</strong>20</strong> also developed precipitation over a small part of southwest TX by 00z.Although deficient in coverage, the <strong><strong>RUC</strong>20</strong> forecast was more in agreement with the severe storms that haddeveloped by that time over parts of southwest/west central TX.We also looked closely at model forecast soundings constructed from 25 mb vertical grids, and compared the modelforecasts with observed soundings at LIT, SHV, and JAN. (There was precipitation occurring at BNA by 00z, sothis sounding may not be representative of the preconvective environment.) In all cases, the models were able toaccurately predict the general vertical structure in the warm sector showing a warm, moist boundary layer overlaid28
y an inversion based in the 800-850 mb layer, with drier conditions above the inversion before moistening again inthe middle and upper levels. The forecast inversion was not as sharp as in the observed soundings, but this may bepartially related to the use of 25 mb vertical grids which can smooth out some of the details between vertical levels.In all cases the <strong><strong>RUC</strong>20</strong> appeared to produce a boundary layer that was cooler and more moist than the observedboundary layers. The <strong>RUC</strong>40 forecast soundings were characterized by low level temperature profiles similar toobserved profiles, but moisture was greater than forecast (similar to the <strong><strong>RUC</strong>20</strong>). As a result, the <strong><strong>RUC</strong>20</strong>moisture/temperature errors tended to compensate for each other and forecast MUCAPE values were closer to theobserved values, whereas the <strong>RUC</strong>40 MUCAPE values were much higher than observed. Here is a small table withforecast and observed MUCAPE values from two raob sites at 00z 30 Mar computed from NSHARP:Location <strong><strong>RUC</strong>20</strong> <strong>RUC</strong>40 RaobSHV 2303 3869 2831LIT 2708 3541 1879(JAN observed sounding was a short run - observed MUCAPE could not be computed)Apr 02...12z run with forecasts valid 00zThere was a slight risk of severe thunderstorms across parts of AR/west TN in the day 2 and day 1 outlooks.Moisture was forecast to return northward ahead of an advancing cold front, with an axis of instability forecast bythe <strong>RUC</strong>40 and <strong><strong>RUC</strong>20</strong> during the afternoon. A primary question was determining whether or not thunderstormswould develop along the front during the afternoon. Both versions of the <strong>RUC</strong> indicated little in the way ofprecipitation by 00z, although the <strong><strong>RUC</strong>20</strong> showed a better defined axis of upward vertical motion in the 700-500 mblayer north of the surface front location. The lack of precipitation verified quite well, as thunderstorms failed todevelop across the area. In this case, the forecast soundings were quite close to the observed sounding at LIT,including boundary layer profiles of temperature and moisture.Tim Garner – <strong>NWS</strong> Spaceflight Meteorology Group (SMG), Johnson Space Flight Center, Houston, TXI filled out the on-line form concerning the <strong>RUC</strong> for a forecast on 25 March for the Edwards AFB and White Sandsareas. The <strong><strong>RUC</strong>20</strong> properly simulated that the mountains east of White Sands would block the progress of a coldfront. Low level winds on either side of the Tularosa Basin (location of White Sands) were simulated quite well.Flow inside the basin during the day was quite light and variable so it was hard to ascertain how well the modelperformed. In general that day it did an admirable job simulating the low level winds in southern California.I looked in more detail on the 27th when I used the 06Z and 12Z <strong><strong>RUC</strong>20</strong> runs as the primary tool for a landingsimulation that we were working. The <strong><strong>RUC</strong>20</strong> appeared to be the only model (including NGM and AVN MOS) thatforecasted a sea breeze in Florida. The forecast verified quite well. I had to fend off a lot of questions from some ofthe NASA users as to whether or not I was sure the winds would change. The <strong><strong>RUC</strong>20</strong> was almost spot on with the10m winds. It did seem to overdo the precipitation in Florida later that afternoon, but I didn't stick around muchafter 21Z to see how well it did. This is a great improvement. I remember how poorly the <strong>RUC</strong> low level windswere over Florida when it first came out. The early <strong>RUC</strong> was so disappointing that we lost so much confidence in itthat we rarely used it.As far as precipitation forecasts go, neither Tim Oram nor I have noticed whether it has been any better or worsethan the <strong>RUC</strong>40.Pablo Santos – SOO, Miami, FLWe have been using the model operationally for almost two weeks. Weather has been quite active for usparticularly during the afternoons this whole week. I used the model myself operationally for two dayslast week and I have gotten feedback from 2 forecasters so far. So far the model is proving to be a very goodmesoscale guidance tool. It picks up the sea breeze development but not as well as the Eta 12 although we mightattribute that to resolution [FSL note: Using 40km display] and the fact the we are looking at the Eta 12 in AWIPSthrough the D2D which gives us a lot of control over the display properties. The precipitation field forecast is29
turning out to be pretty good also although we do not concentrate much on QPF but rather the when and where. Inthis area it seems to be hand on hand with the Eta12. Although it is to early and soon to tell given how long we havehad it, you can tell data from the FSL Mesoscale data networks is going into it, and hence FAWN (FloridaAgricultural Weather Network) (am I right?). It seems it produces better analysis fields to begin with that guidancewe obtain from NCEP. Again, this is something I cannot conclude for certain until I get the data in AWIPS and amable to sample to grid. [FSL note: Mesonet data is only assimilated in FSL <strong><strong>RUC</strong>20</strong> as of this time, but is planned tobe added to the NCEP <strong><strong>RUC</strong>20</strong> within a few months of this writing.]The great advantage with this model is how frequently it updates. It really provides us with an excellent tool in thescale of hours when rapidly developing/weakening Florida type convection occurs. That to us is invaluable.Chris Buonanno – SOO, Little Rock, AROur office has often utilized the precipitation forecasts from the <strong><strong>RUC</strong>20</strong>. We have found these forecasts to beparticularly useful during the 6-18 h time frame, to help determine areal coverage (or lack of), and quantitativeprecipitation amounts during convective situations. We have noted that overall locations of forecast precipitationfrom the <strong><strong>RUC</strong>20</strong> seem to be improved compared to those from the <strong>RUC</strong>40. We have also noted during severalrecent events that the <strong><strong>RUC</strong>20</strong> correctly forecasted a lack of precipitation during situations where convectiveinhibition limited the extent of convection.30