Visualization of Diversity in Large Multivariate Data Sets
Visualization of Diversity in Large Multivariate Data Sets
Visualization of Diversity in Large Multivariate Data Sets

You also want an ePaper? Increase the reach of your titles
YUMPU automatically turns print PDFs into web optimized ePapers that Google loves.
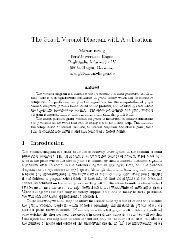
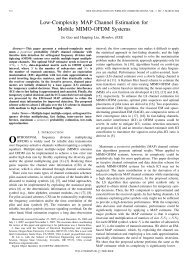
1058 IEEE TRANSACTIONS ON VISUALIZATION AND COMPUTER GRAPHICS, VOL. 16, NO. 6, NOVEMBER/DECEMBER 2010Fig. 4. Participants <strong>of</strong> the user study visualized us<strong>in</strong>g <strong>Diversity</strong> Map.The visualized attributes, from left to right, are major, degree, year <strong>in</strong>school, gender, and age-range. The participants represented a diverserange <strong>of</strong> majors, degrees, and ages.Table 1. Allocation <strong>of</strong> 40 participants across 4 treatments. E.g., 10 (DM,A)–(GH, B) <strong>in</strong>dicates 10 participants answered questions on collectionA with DM <strong>in</strong> phase 1 then on collection B with GH <strong>in</strong> phase 2.10 (DM, A)–(GH, B) 10 (DM, B)–(GH, A)10 (GH, B)–(DM, A) 10 (GH, A)–(DM, B)posted around the campus. They represented a diverse range <strong>of</strong> majors,degrees, and ages (Fig. 4), and, although their participation <strong>in</strong> ourstudy might <strong>in</strong>dicate <strong>in</strong>terest <strong>in</strong> diversity visualization, most <strong>of</strong> the participantswere unfamiliar with the field <strong>of</strong> <strong>in</strong>formation visualization.After the sign<strong>in</strong>g <strong>of</strong> an <strong>in</strong>formed consent document required byour university’s Institutional Review Board, each participant was randomlyassigned to different experimental conditions as described below.Participants were encouraged to ask any questions they mighthave at any time dur<strong>in</strong>g the course <strong>of</strong> the study.Experiment Design. We followed a two-phase crossover experimentdesign and used two collections <strong>of</strong> synthetic data sets, collectionA and collection B, for the two phases to avoid learn<strong>in</strong>g effect whenparticipants moved from one visualization method to the other. Notethat both data set collections are considered equivalent <strong>in</strong> all respects.They were simply generated with separate runs <strong>of</strong> the data generationalgorithm described <strong>in</strong> Section 5.1.Each participant’s session was divided <strong>in</strong>to two phases. In the firstphase, the participant answered questions about visualizations <strong>of</strong> onecollection <strong>of</strong> data sets created with one visualization method. In thesecond phase, the participant answered the same questions about visualizations<strong>of</strong> the other collection <strong>of</strong> data sets us<strong>in</strong>g the other visualizationmethod. The order <strong>of</strong> visualization methods and data set collectionswas counter-balanced across participants (see Table 1).In each phase, the participant first completed a short tutorial thatexpla<strong>in</strong>ed the visualization method <strong>in</strong>volved <strong>in</strong> the phase and <strong>in</strong>cludedseveral example images generated us<strong>in</strong>g that method. After complet<strong>in</strong>gthe tutorial, the participant answered several questions <strong>of</strong> each <strong>of</strong>the types described <strong>in</strong> Section 5. Note that participants were suppliedwith a hard copy <strong>of</strong> each tutorial to consult while answer<strong>in</strong>g thesequestions. Note also that the questions <strong>of</strong> one type are the same, buteach one is asked about visualizations <strong>of</strong> different data sets. The order<strong>in</strong>g<strong>of</strong> question types was randomized across two phases and acrossparticipants, but all questions <strong>of</strong> the same type were asked as a block.Each participant answered six questions <strong>of</strong> type Q1. A secondarygoal for this question type was to determ<strong>in</strong>e whether data set size affectedparticipants’ ability to judge and compare overall diversity levels.Thus, each participant was asked Q1 questions <strong>of</strong> three levels <strong>of</strong>difficulty (easy, medium, hard) for each <strong>of</strong> two different data set sizes(100 and 1000 objects). Half <strong>of</strong> the participants answered questionsus<strong>in</strong>g the smaller data sets first and the larger ones second, and theother half answered questions us<strong>in</strong>g the larger data sets first and thesmaller ones second. The order <strong>of</strong> the three difficulty levels was randomizedwith<strong>in</strong> each data set size for each participant. This order<strong>in</strong>gconvention was chosen to avoid order<strong>in</strong>g effects among participants.Each participant answered three questions <strong>of</strong> type Q2, and six questionseach <strong>of</strong> types Q3 and Q4. To avoid order<strong>in</strong>g effects for thesequestions, we used a counterbalanc<strong>in</strong>g/randomization approach similarto the one used with Q1 questions. For all <strong>of</strong> these questions, weused data sets with only 100 objects. Though our goal is to developvisualizations that can handle data sets with more that 1000 objects,we believed that GH would suffer with larger data sets because <strong>of</strong> occlusion/clutter.To compare the capabilities <strong>of</strong> the respective methodsto effectively communicate <strong>in</strong>formation about diversity, we used datasets with only 100 objects so as not to disadvantage GH.We collected answers to these questions not only to measure absolutecorrectness but also to identify how far each participant’s responsewas from the correct answer. We accomplished this by assign<strong>in</strong>g anerror distance to each response. For questions <strong>of</strong> type Q1, correct responseswere assigned an error distance <strong>of</strong> 0, while <strong>in</strong>correct responseswere assigned an error distance <strong>of</strong> 1. For questions <strong>of</strong> type Q2, Q3,and Q4, the error distance <strong>of</strong> each response was computed as the rankorder <strong>of</strong> the participant’s selected response <strong>in</strong> relation to the correctanswer. In particular, the best (correct) answer was assigned an errordistance <strong>of</strong> 0, the second-best answer was assigned an error distance <strong>of</strong>1, the third-best answer was assigned an error distance <strong>of</strong> 2, and so on.As an example, consider a question <strong>of</strong> type Q2 whose correct answerwas “low diversity.” For this question, a response <strong>of</strong> “very low diversity”would be assigned an error distance <strong>of</strong> 1, as would a response<strong>of</strong> “medium diversity,” while a response <strong>of</strong> “high diversity” would beassigned an error distance <strong>of</strong> 2, and a response <strong>of</strong> “very high diversity”would be assigned an error distance <strong>of</strong> 3. We used a similar system toassign error distances for questions <strong>of</strong> type Q3 and Q4 based on thediversity order<strong>in</strong>g <strong>of</strong> the attributes and the card<strong>in</strong>ality order<strong>in</strong>g <strong>of</strong> theattribute values, respectively.We also collected response times <strong>in</strong> addition to error distances. Participantswere given a time limit <strong>of</strong> two m<strong>in</strong>utes to answer each question.If the participant did not answer the question <strong>in</strong> the allotted time,the system timed out and sent the participant to the next question. Theparticipant was assigned the maximum possible error distance for thequestion type for any question on which he or she timed out.In addition to the questions <strong>of</strong> type Q1-Q4, at the end <strong>of</strong> each phase,the participants answered a short questionnaire about their experiencewith each method. This questionnaire conta<strong>in</strong>ed both Likert-stylequestions as well as open-ended questions. We discuss these questions<strong>in</strong> more detail <strong>in</strong> our analysis <strong>of</strong> the study results below.The entire study was adm<strong>in</strong>istered through a web-based <strong>in</strong>terfacethat collected demographic <strong>in</strong>formation, presented tutorials and questions,collected user answers, computed error distances and responsetimes, and stored these <strong>in</strong> a database for analysis. The resolution <strong>of</strong>the monitor used for all studies was the standard 1920 × 1200 pixels.The resolution <strong>of</strong> each image produced by the DM visualization was900×537 pixels, and the resolution <strong>of</strong> each image produced by the GHvisualization was 640 × 640 pixels. Each question for the GH methodrequired a legend image <strong>of</strong> 200×524 pixels. When the legend is taken<strong>in</strong>to account, visualizations <strong>of</strong> both methods are roughly the same size.6.2 Results and AnalysisHere, we analyze the results obta<strong>in</strong>ed from the user study. Our <strong>in</strong>itialhypothesis about these results was that, for each question type, DMwould outperform GH, both <strong>in</strong> terms <strong>of</strong> accuracy and response time.In particular, we believed that GH would suffer for some questionsdue to the fact that it does not treat all attributes as equal. Specifically,we expected users to have difficulty accurately judg<strong>in</strong>g diversity forthe attributes mapped to GH’s three spatial axes, due to the ambiguousmany-to-one mapp<strong>in</strong>g these axes produce. We also expected GH tosuffer <strong>in</strong> terms <strong>of</strong> time and/or accuracy due to the need for users toconsult the legend to remember the mapp<strong>in</strong>gs.For each question type, we did not analyze <strong>in</strong>dividual answers butcomputed the sum <strong>of</strong> error distances and the sum <strong>of</strong> response timesacross the questions <strong>of</strong> that type for each participant and comparedthe distributions <strong>of</strong> these aggregated values us<strong>in</strong>g statistical hypothesistest<strong>in</strong>g. While we <strong>in</strong>itially planned to use ANOVA and repeatedmeasuresANOVA directly for this comparison, we found that the responsedata did not meet these methods’ normality requirements. Wetherefore first applied a rank transformation [6] to the response databefore us<strong>in</strong>g these techniques.Our primary focus <strong>in</strong> analyz<strong>in</strong>g the results <strong>of</strong> the study is on error