1 - Oregon State University
1 - Oregon State University
1 - Oregon State University
You also want an ePaper? Increase the reach of your titles
YUMPU automatically turns print PDFs into web optimized ePapers that Google loves.
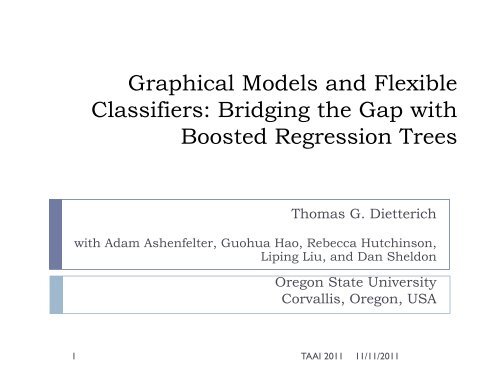
Graphical Models and FlexibleClassifiers: Bridging the Gap withBoosted Regression TreesThomas G. Dietterichwith Adam Ashenfelter, Guohua Hao, Rebecca Hutchinson,Liping Liu, and Dan Sheldon<strong>Oregon</strong> <strong>State</strong> <strong>University</strong>Corvallis, <strong>Oregon</strong>, USA1TAAI 201111/11/2011
Combining Two Approaches toMachine LearningProbabilisticGraphicalModelsFlexibleNonparametricModelsFlexibleNonparametricProbabilisticModels2TAAI 201111/11/2011
Outline Two Cultures of Machine Learning Probabilistic Graphical Models Non-Parametric Discriminative Models Advantages and Disadvantages of Each Representing conditional probability distributions usingnon-parametric machine learning methods Logistic regression (Friedman) Conditional random fields (Dietterich, et al.) Latent variable models (Hutchinson, et al.) Ongoing Work Conclusions3TAAI 201111/11/2011
Probabilistic Graphical Models Nodes: Random variables X 1 , X 2 , Y 1 , Y 2 Edges: Direct probabilistic dependencies P Y 1 X 1 , P(Y 2 |X 1 , X 2 )X 1 X 2Y 1Y 2 Joint probability distribution is the product of theindividual node distributions P X 1 , X 2 , Y 1 , Y 2 = P X 1 P X 2 P Y 1 X 1 P(Y 2 |X 1 , X 2 )4TAAI 201111/11/2011
§ 17. Allgemeine Rechtsgrundsätze des Völkerrechts 143„Im Sinne dieses Übereinkommens ist eine zwingende Norm des allgemeinenVölkerrechts eine Norm, die von der internationalen Staatengemeinschaftin ihrer Gesamtheit angenommen und anerkannt wird als eine Norm, von dernicht abgewichen werden darf und die nur durch eine spätere Norm des allgemeinenVölkerrechts derselben Rechtsnatur geändert werden kann.“ (Art. 53Satz 2 WVK).Die Bildung neuen ius cogens unterliegt gegenüber „schlichtem“Völkergewohnheitsrecht gesteigerten Anforderungen: Die Entstehungzwingenden Gewohnheitsrechts setzt voraus, dass seine Anerkennung– auch in dieser besonderen Qualität – quasi-universellenCharakter hat, also von fast allen Staaten getragen wird (siehe hierzuauch den Bericht der inter-amerikanischen Menschenrechtskommissionim Fall Domingues, dazu oben Randnummer 13). Zu diesem unabdingbarenBestand des Gewohnheitsrechts gehören mittlerweileetwa das Verbot des Angriffskrieges, elementare Menschenrechte(wie das Verbot des Völkermords, der Folter, der Sklaverei oder derRassendiskriminierung) sowie das Selbstbestimmungsrecht der Völker.Verstößt ein völkerrechtlicher Vertrag gegen eine solche Norm deszwingenden Völkergewohnheitsrechts, ist der Vertrag insoweit nichtig(Art. 53 Satz 1 WVK). Hierin erschöpft sich aber nicht die Wirkungzwingender Normen des Völkerrechts. Die meisten dieserzwingenden Regeln begründen nämlich Verpflichtungen gegenüberder gesamten Staatengemeinschaft (Verpflichtungen erga omnes, sieheunten, § 39).Literatur: J. A. Frowein, Jus Cogens, EPIL, Bd. 3, 1997, S. 65 ff.; L. Hannikeinen,Peremptory Norms (Jus Cogens) in International Law: Historical Development,Criteria, Present Status, 1988; S. Kadelbach, Zwingendes Völkerrecht,1992; A. Orakhelashvili, Peremptory Norms in International Law,2006.15§ 17. Allgemeine Rechtsgrundsätze des VölkerrechtsDas IGH-Statut nennt in Art. 38 Abs. 1 lit. c als dritte Quelle desVölkerrechts „die von den Kulturvölkern anerkannten allgemeinenRechtsgrundsätze“ (general principles of law recognized by civilizednations). Diese allgemeinen Rechtsgrundsätze ergänzen die Normendes Völkervertrags- und Völkergewohnheitsrechts. Hierunter fallendie Prinzipien, die den Rechtsordnungen der meisten Staaten bekanntsind. Der Bezug auf die „Kulturvölker“ ist nicht etwa als Rückfall ineine eurozentrische Sichtweise zu deuten. Damit wird vielmehr zum1
Probabilistic Graphical Models (3) How should the conditionalprobability distributions berepresented? Conditional Probability Tables(CPTs) with one parameter foreach combination of values:X 1 X 2 Y 1 P(Y 1 |X 1 , X 2 )0 0 0 α0 0 1 1 − α0 1 0 β0 1 1 1 − β1 0 0 γ1 0 1 1 − γ1 1 0 δ1 1 1 1 − δ Log-linear models log P Y 1=1 X 1 ,X 2P Y 1 =0 X 1 ,X 2= α′ + β′ ⋅ I[X 1 = 1] + γ′ ⋅ I[X 2 = 1]6TAAI 201111/11/2011
Advantages and Disadvantages ofParametric RepresentationsAdvantagesEach parameter has a meaningSupports statistical hypothesistesting: “Does X 1 influence Y 1 ?” H 0 : β′ = 0 H a : β′ ≠ 0DisadvantagesModel has fixed complexityWill typically either under-fit or overfitthe dataDesigner must decide aboutinteractions, non-linearities, etc. etc.Wrong decisions lead to highly biasedmodels and invalidate hypothesis testsCorrelated variables cause troubleDifficult for problems with manyfeaturesData must be transformed to matchthe parametric formDiscretizedSquare root or log transforms7TAAI 201111/11/2011
accuracyFlexible Machine Learning Models Support Vector Machines Classification andRegression Trees Key advantage: Can tunethe complexity of themodel to the complexityof the data Structural Risk Minimizationcomplexity8TAAI 201111/11/2011
Another Advantage:Interactions and NonlinearitiesSVMs:Polynomial kernels captureinteractions and polynomialnonlinearitiesGaussian kernels capturenonlinearities, however, interactionsare embedded in the distancefunction (typically Euclidean)Classification and regression treesInteractions are captured by the ifthen-elsestructure of the treeNonlinearities are approximated bypiecewise constant functionsY 1 =−5X 1 ≥ 3X 2 ≥ 0 X 2 ≥ 0Y 1 =3Y 1 =8Y 1 =1Y 1 = −5 ⋅ I X 1 ≥ 3, X 2 ≥ 0 + 3 ⋅ I X 1 ≥ 3, X 2 < 0 +8 ⋅ I x 1 < 3, X 2 ≥ 0 + 1 ⋅ I(X 1 < 3, X 2 < 0)9TAAI 201111/11/2011
Tree-Based MethodsAdvantages Flexible Model ComplexityControlled by depth of tree Can handle discrete,ordered, and continuousvariablesNo normalization or rescalingneeded Can handle missing valuesProportional distributionSurrogate splits Best “off the shelf” method(Breiman)Disadvantages Poor probability estimates Does not supporthypothesis testing Cannot handle latentvariables High variance, which canbe addressed by Boosting Bagging Randomization10TAAI 201111/11/2011
Can we combine the best of both?Probabilistic GraphicalModels Probabilistic semantics Structured by backgroundknowledge Latent variables anddynamic processesNon-Parametric TreeMethods Tunable model complexity No need for data scalingand preprocessing Discrete, ordered, orcontinuous values11TAAI 201111/11/2011
Existing Efforts Dependency Networks Heckerman et al. (JMLR 2000): Bayesian network where each P(X|Y) is a decision tree (withmultinomial output probabilities) Trained to maximize pseudo-likelihood Requires all variables to be observed RKHS embeddings of probabilities distributions Song, Gretton & Guestrin (AISTATS 2011) Tree-structured graphical model (undirected) No latent variables Bayesian semi-parametric methods Dirichlet processes (Blei, Jordan, et al.)12TAAI 201111/11/2011
Outline Two Cultures of Machine Learning Probabilistic Graphical Models Non-Parametric Discriminative Models Advantages and Disadvantages of Each Representing conditional probability distributions usingnon-parametric machine learning methods Logistic regression (Friedman) Conditional random fields (Dietterich, et al.) Latent variable models (Hutchinson, et al.) Ongoing Work Conclusions13TAAI 201111/11/2011
Representing P(Y|X) using boostedregression trees Friedman: Gradient Tree Boosting (2000; Annals ofStatistics, 2011) Consider logistic regression: logP Y=1P Y=0= β 0 + β 1 X 1 + ⋯ + β J X JN D = X i , Y i i=1 Log likelihood:are the training examples LL β = Y i log P Y = 1 X i ; β + 1 − Y i log P Y = 0 X i ; βi14TAAI 201111/11/2011
Fitting logistic regression via gradientdescent Let β 0 = g 0 = 0 For l = 1, … , L do Compute g l = ∇ β LL β β=βl−1 g l = gradient w.r.t. β β l ≔ β l−1 + η l g l take a step of size η l in direction ofgradient Final estimate of β is β L = g 0 + η 1 g 1 + ⋯ + η L g L15TAAI 201111/11/2011
Functional Gradient DescentBoosted Regression Trees Friedman (2000), Mason et al. (NIPS 1999), Breiman (1996) Fit a logistic regression model as a weighted sum of regressiontrees:P Y = 1logP Y = 0= tree0 (X) + η 1 tree 1 (X) + ⋯ + η L tree L (X)When “flattened” this gives a log linear model with complexinteraction terms16TAAI 201111/11/2011
L2-Tree Boosting Algorithm Let F 0 X = f 0 (X) = 0 be the zero function For l = 1, … , L do Construct a training set S l = X i , Y i i=1 where Y is computed as Y i ∂LL F= how we wish F would change at X i∂F F=F l−1 X i Let f l = regression tree fit to S l F l ≔ F l−1 + η l f l The step sizes η l are the weights computed in boosting This provides a general recipe for learning a conditionalprobability distribution for a Bernoulli or multinomialrandom variableN17TAAI 201111/11/2011
L2-TreeBoosting can be applied to any fullyobserveddirected graphical model P(Y 1 |X 1 ) as sum of trees P(Y 2 |X 1 , X 2 ) as sum of treesX 1 X 2 What about undirected graphicalmodels?Y 1Y 218TAAI 201111/11/2011
Tree Boosting for Conditional RandomFields Conditional Random Field(Lafferty et al., 2001)Y 1Y 2…Y T P(Y 1 , … , Y T |X 1 , … , X T ) Undirected graph over theY’s conditioned on the X’s. Φ(Y t−1 , Y t , X) = log linearmodelX 1X 2…X T Dietterich, Hao, Ashenfelter (JMLR 2008; ICML 2004) Fit Φ(Y t−1 , Y t , X) using tree boosting A form of automatic feature discovery for CRFs19TAAI 201111/11/2011
Test Set Accuracy (%)Experimental Results100959085807570LogLinearTreeCRF65605550Protein NetTalk Hyphen ai-general ai-neural aixDataset20All differences statistically significant p
Tree Boosting for Latent Variable Models Both Friedman’s L2-TreeBoosted logistic regression andour L2-TreeBoosted CRFs assumed that all variables wereobserved in the training data Can we extend Tree Boosting to latent variable graphicalmodels? Motivating application: Species Distribution Modeling21TAAI 201111/11/2011
Species Distribution ModelingObservations22Leathwick et al, 2008TAAI 201111/11/2011
Species Distribution ModelingObservationsFitted Model23Leathwick et al, 2008TAAI 201111/11/2011
Disregarding coststo fishing industry24Leathwick et al, 2008Full consideration of coststo fishing industryTAAI 201111/11/2011
Wildlife Surveys with Imperfect DetectionProblem Partial Problem Solution: 1: We 2: don’t Some Multiple observe birds visits: are everywhere Different hidden birds hide on different visits25TAAI 201111/11/2011
Multiple Visit DataSiteA(forest,elev=400m)B(forest,elev=500m)C(forest,elev=300m)D(grassland,elev=200m)True occupancy(latent)Visit 1(rainy day,12pm)Detection HistoryVisit 2(clear day, 6am)Visit 3(clear day, 9am)1 0 1 11 0 1 01 0 0 00 0 0 026TAAI 201111/11/2011
Occupancy-Detection ModelOccupancyfeatures (e.g.elevation,vegetation)Probability of occupancy(function of X i )Probability of detection(function of W it )Detectionfeatures (e.g.time of day,effort)o id itX iZ iY itW itt=1,…,Ti=1,…,MVisitsSitesTrue (latent) presence/absenceZ i ~ Bern(o i )Observed presence/absenceY it | Z i ~ Bern(Z i d it )27MacKenzie, et al, 2006 TAAI 2011 11/11/2011
Parameterizing the modelX io iZ iY itd itW itt=1,…,Ti=1,…,Mz i ~P(z i |x i ): Species Distribution ModelP z i = 1 x i = o i = F(x i ) “occupancy probability”y it ~P(y it |z i , w it ): Observation modelP y it = 1 z i , w it = z i d itd it = G(w it ) “detection probability”28TAAI 201111/11/2011
Standard Approach: Log Linear (logisticregression) models log logF X1−F XG W1−G W Train via EM= β 0 + β 1 X 1 + ⋯ + β J X J= α 0 + α 1 W 1 + ⋯ + α K W K People tend to use very simple models: J = 4, K = 229TAAI 201111/11/2011
Regression Tree Parameterization log logF x1−F x= f0 (x) + ρ 1 f 1 (x) + ⋯ + ρ L f L (x)G w1−G w = g0 w + η 1 g 1 w + ⋯ + η L g L (w) Perform functional gradient descent alternating betweenF and G Could also use EM30TAAI 201111/11/2011
Alternating Functional Gradient Descent Loss function L(F, G, y) F 0 = G 0 = f 0 = g 0 = 0 For l = 1, … , L For each site i computez i = ∂L(F l−1 x i , G l−1 , y i )/∂F l−1 x i Fit regression tree f l to x i , z i Let F l = F l−1 + ρ l f lMi=1 For each visit t to site i, computey it = ∂L F l x i , G l−1 w it , y it /∂Gl−1 w it Fit regression tree g l to w it , y it Let G l = G l−1 + η l g lM,T ii=1,t=131Hutchinson, Liu, Dietterich, AAAI 2011 TAAI 2011 11/11/2011
Experiment Algorithms:Supervised methods: S-LR: logistic regression from x i , w it → y it S-BRT: boosted regression trees x i , w it → y itOccupancy-Detection methods: Data:OD-LR: F and G logistic regressionsOD-BRT: F and G boosted regression trees12 bird species3 synthetic species 3124 observations from New York <strong>State</strong>, May-July 2006-2008All features rescaled to zero mean, unit variance32TAAI 201111/11/2011
Features33TAAI 201111/11/2011
Simulation Study using Synthetic Species Synthetic Species 2: F and G nonlinearo i1log = −2 x 2 21 − o i+ 3 x 2 3i− 2x i id itlog = exp(−0.5w 41 − d it) + sin(1.25w 1 it+ 5)it34TAAI 201111/11/2011
Results for AUC of y itNo significant differences35TAAI 201111/11/2011
PredictingOccupancySyntheticSpecies 236TAAI 201111/11/2011
Partial Dependence PlotSynthetic Species 1 OD-BRT hasthe least bias37TAAI 2011Distance of survey11/11/2011
Partial Dependence PlotSynthetic Species 3 OD-BRT hasthe least biasand correctlycaptures the bimodaldetectionprobability38TAAI 2011Time of Day11/11/2011
PartialDependencePlotBlue Jay vs.Time of Day39Time of DayTAAI 201111/11/2011
PartialDependencePlotBlue Jay vs.Duration ofObservation40Effort in HoursTAAI 201111/11/2011
Open Problems Sometimes the OD model finds trivial solutions Detection probability = 0 at many sites, which allows the Occupancymodel complete freedom at those sites Occupancy probability constant (0.2) Log likelihood for latent variable models suffers from localminimaProper initialization?Proper regularization?Posterior regularization? How much data do we need to fit this model?Can we detect when the model has failed?41TAAI 201111/11/2011
Outline Two Cultures of Machine Learning Probabilistic Graphical Models Non-Parametric Discriminative Models Advantages and Disadvantages of Each Representing conditional probability distributions usingnon-parametric machine learning methods Logistic regression (Friedman) Conditional random fields (Dietterich, et al.) Latent variable models (Hutchinson, et al.) Ongoing Work Conclusions42TAAI 201111/11/2011
Next Steps Modeling Expertise in Citizen Science From Occupancy (0/1) to Abundance (n) From Static to Dynamic Models43TAAI 201111/11/2011
Modeling Expertise in Citizen Science Project eBird Bird watchers upload checklists to ebird.org >3M data points per month (May 2011) World-wide coverage 24x365 Wide variation in “birder” expertise44TAAI 201111/11/2011
Occupancy/Detectability/ExpertiseModelOccupancy ModelExpertise ModelU jE jj=1,…,Jexpertisefeaturesexpert/noviceDetection ModelX iZ iY itd itW itt=1,…,T ii=1,…,N45TAAI 201111/11/2011
AUCAUCFirst ResultsAverage AUC on four common bird speciesAverage AUC on four hard-to-detect bird species0.800.800.700.700.600.600.50Blue JayWhite-breastedNuthatchNorthernCardinalGreat BlueHeronLR 0.6726 0.6283 0.6831 0.6641OD 0.6881 0.6262 0.7073 0.6691ODE 0.7104 0.6600 0.7085 0.69590.50Brown ThrasherBlue-headedVireoNorthern RoughwingedSwallowWood ThrushLR 0.6576 0.7976 0.6575 0.6579OD 0.6920 0.8055 0.6609 0.6643ODE 0.6954 0.8325 0.6872 0.6903 eBird data for May and June (peak detectability period) forNY<strong>State</strong> Expertise component trained via supervised learningJun Yu, Weng-Keen Wong, Rebecca Hutchinson (2010). Modeling Experts and Novicesin Citizen Science Data. ICDM 2010.46TAAI 201111/11/2011
New Project: BirdCast Goal: Continent-wide birdmigration forecasting Additional data sources: Doppler weather radar Night flight calls Wind observations (assimilatedto wind forecast model)47TAAI 201111/11/2011
irdsBirdCast Model:n s t (c) = # of birds of speciess at cell c and time t.x s t (i, o) = eBird count forvisit o at site i species s andtime tsy t,t+1 (k) = # of flight callsfor species s at site k on thenight (t, t + 1)z t,t+1 = # of birds (allspecies) observed at radar von night t, t + 1…n tsx t s (i, o)sa t,t+1 (k)sy t,t+1 (k)sn t,t+1s = 1, … , S…sr t,t+1 (v)z t,t+1 (v)Occupancy changes eachnightTransition probabilitiesshould be influenced bymany habitat features:parameterize using boostedtreeso = 1, … , O(i, t)s = 1, … , Si = 1, … , Ls = 1, … , Sk = 1, … , Kv = 1, … , VeBird acoustic radar48TAAI 201111/11/2011
Outline Two Cultures of Machine Learning Probabilistic Graphical Models Non-Parametric Discriminative Models Advantages and Disadvantages of Each Representing conditional probability distributions usingnon-parametric machine learning methods Logistic regression (Friedman) Conditional random fields (Dietterich, et al.) Latent variable models (Hutchinson, et al.) Ongoing Work Conclusions49TAAI 201111/11/2011
Concluding Remarks Gradient Tree Boosting can be integrated intoprobabilistic graphical models Fully observed directed models Conditional random fields Latent variable models When to do this? When you want to condition on a large number of features When you have a lot of data50TAAI 201111/11/2011
Combining Two Approaches toMachine LearningProbabilisticGraphicalModelsFlexibleNonparametricModelsFlexibleNonparametricProbabilisticModels• Easier to use• More accurate51TAAI 201111/11/2011
Thank-you Adam Ashenfelter, Guo-Hua Hao: TreeBoosting for CRFs Rebecca Hutchinson, Liping Liu: Boosted Regression Treesin OD models Weng-Keen Wong, Jun Yu: ODE model Dan Sheldon: Models for Bird Migration Steve Kelling and colleagues at the Cornell Lab ofOrnithology National Science Foundation Grants 0083292, Off-theshelf,0832804 and 090588552TAAI 201111/11/2011


