An Assessment of the Operational Performance of Supermarkets in ...
An Assessment of the Operational Performance of Supermarkets in ...
An Assessment of the Operational Performance of Supermarkets in ...

You also want an ePaper? Increase the reach of your titles
YUMPU automatically turns print PDFs into web optimized ePapers that Google loves.
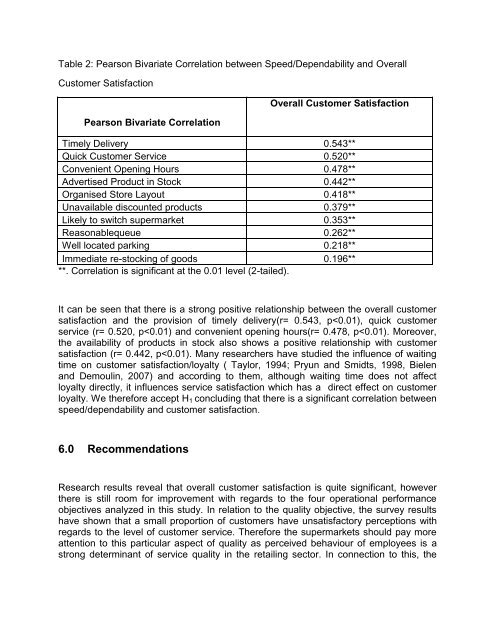
Table 2: Pearson Bivariate Correlation between Speed/Dependability and OverallCustomer SatisfactionPearson Bivariate CorrelationOverall Customer SatisfactionTimely Delivery 0.543**Quick Customer Service 0.520**Convenient Open<strong>in</strong>g Hours 0.478**Advertised Product <strong>in</strong> Stock 0.442**Organised Store Layout 0.418**Unavailable discounted products 0.379**Likely to switch supermarket 0.353**Reasonablequeue 0.262**Well located park<strong>in</strong>g 0.218**Immediate re-stock<strong>in</strong>g <strong>of</strong> goods 0.196****. Correlation is significant at <strong>the</strong> 0.01 level (2-tailed).It can be seen that <strong>the</strong>re is a strong positive relationship between <strong>the</strong> overall customersatisfaction and <strong>the</strong> provision <strong>of</strong> timely delivery(r= 0.543, p