Salicylaldoxime (H2salox) in iron(III) carboxylate chemistry ...
Salicylaldoxime (H2salox) in iron(III) carboxylate chemistry ...
Salicylaldoxime (H2salox) in iron(III) carboxylate chemistry ...

Create successful ePaper yourself
Turn your PDF publications into a flip-book with our unique Google optimized e-Paper software.
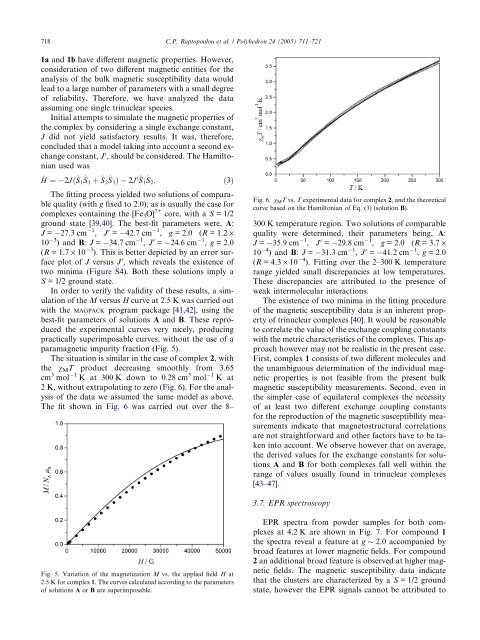
718 C.P. Raptopoulou et al. / Polyhedron 24 (2005) 711–7211a and 1b have different magnetic properties. However,consideration of two different magnetic entities for theanalysis of the bulk magnetic susceptibility data wouldlead to a large number of parameters with a small degreeof reliability. Therefore, we have analyzed the dataassum<strong>in</strong>g one s<strong>in</strong>gle tr<strong>in</strong>uclear species.Initial attempts to simulate the magnetic properties ofthe complex by consider<strong>in</strong>g a s<strong>in</strong>gle exchange constant,J did not yield satisfactory results. It was, therefore,concluded that a model tak<strong>in</strong>g <strong>in</strong>to account a second exchangeconstant, J 0 , should be considered. The Hamiltonianused was^H ¼ 2Jð^S 1^S 3 þ ^S 2^S 3 Þ 2J 0^S 1^S 2 : ð3ÞThe fitt<strong>in</strong>g process yielded two solutions of comparablequality (with g fixed to 2.0), as is usually the case forcomplexes conta<strong>in</strong><strong>in</strong>g the [Fe 3 O] 7+ core, with a S = 1/2ground state [39,40]. The best-fit parameters were, A:J = 27.3 cm 1 , J 0 = 42.7 cm 1 , g = 2.0 (R = 1.2 ·10 3 ) and B: J = 34.7 cm 1 , J 0 = 24.6 cm 1 , g = 2.0(R = 1.7 · 10 3 ). This is better depicted by an error surfaceplot of J versus J 0 , which reveals the existence oftwo m<strong>in</strong>ima (Figure S4). Both these solutions imply aS = 1/2 ground state.In order to verify the validity of these results, a simulationof the M versus H curve at 2.5 K was carried outwith the MAGPACK program package [41,42], us<strong>in</strong>g thebest-fit parameters of solutions A and B. These reproducedthe experimental curves very nicely, produc<strong>in</strong>gpractically superimposable curves, without the use of aparamagnetic impurity fraction (Fig. 5).The situation is similar <strong>in</strong> the case of complex 2, withthe v M T product decreas<strong>in</strong>g smoothly from 3.65cm 3 mol1 K at 300 K down to 0.28 cm 3 mol1 K at2 K, without extrapolat<strong>in</strong>g to zero (Fig. 6). For the analysisof the data we assumed the same model as above.The fit shown <strong>in</strong> Fig. 6 was carried out over the 8–Fig. 6. v M T vs. T experimental data for complex 2, and the theoreticalcurve based on the Hamiltonian of Eq. (3) (solution B).300 K temperature region. Two solutions of comparablequality were determ<strong>in</strong>ed, their parameters be<strong>in</strong>g, A:J = 35.9 cm 1 , J 0 = 29.8 cm 1 , g = 2.0 (R = 3.7 ·10 4 ) and B: J = 31.3 cm 1 , J 0 = 41.2 cm 1 , g = 2.0(R = 4.3 · 10 4 ). Fitt<strong>in</strong>g over the 2–300 K temperaturerange yielded small discrepancies at low temperatures.These discrepancies are attributed to the presence ofweak <strong>in</strong>termolecular <strong>in</strong>teractions.The existence of two m<strong>in</strong>ima <strong>in</strong> the fitt<strong>in</strong>g procedureof the magnetic susceptibility data is an <strong>in</strong>herent propertyof tr<strong>in</strong>uclear complexes [40]. It would be reasonableto correlate the value of the exchange coupl<strong>in</strong>g constantswith the metric characteristics of the complexes. This approachhowever may not be realistic <strong>in</strong> the present case.First, complex 1 consists of two different molecules andthe unambiguous determ<strong>in</strong>ation of the <strong>in</strong>dividual magneticproperties is not feasible from the present bulkmagnetic susceptibility measurements. Second, even <strong>in</strong>the simpler case of equilateral complexes the necessityof at least two different exchange coupl<strong>in</strong>g constantsfor the reproduction of the magnetic susceptibility measurements<strong>in</strong>dicate that magnetostructural correlationsare not straightforward and other factors have to be taken<strong>in</strong>to account. We observe however that on average,the derived values for the exchange constants for solutionsA and B for both complexes fall well with<strong>in</strong> therange of values usually found <strong>in</strong> tr<strong>in</strong>uclear complexes[43–47].3.7. EPR spectroscopyFig. 5. Variation of the magnetization M vs. the applied field H at2.5 K for complex 1. The curves calculated accord<strong>in</strong>g to the parametersof solutions A or B are superimposable.EPR spectra from powder samples for both complexesat 4.2 K are shown <strong>in</strong> Fig. 7. For compound 1the spectra reveal a feature at g 2.0 accompanied bybroad features at lower magnetic fields. For compound2 an additional broad feature is observed at higher magneticfields. The magnetic susceptibility data <strong>in</strong>dicatethat the clusters are characterized by a S = 1/2 groundstate, however the EPR signals cannot be attributed to