

The Experiences of Workers Hired Under Consumer Direction in ...
The Experiences of Workers Hired Under Consumer Direction in ...
The Experiences of Workers Hired Under Consumer Direction in ...

Create successful ePaper yourself
Turn your PDF publications into a flip-book with our unique Google optimized e-Paper software.
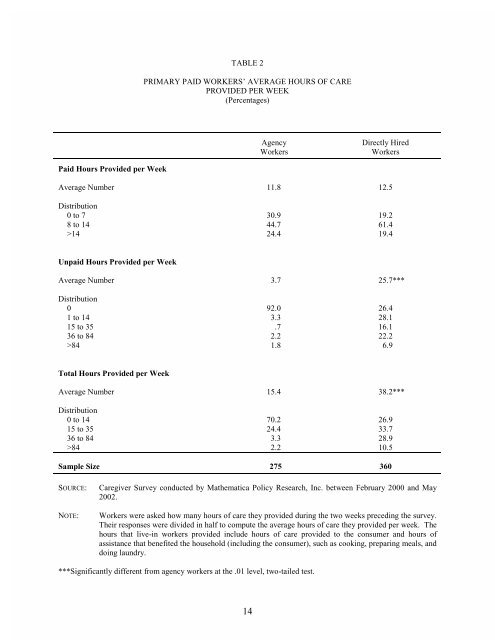
TABLE 2PRIMARY PAID WORKERS’ AVERAGE HOURS OF CAREPROVIDED PER WEEK(Percentages)Agency<strong>Workers</strong>Directly <strong>Hired</strong><strong>Workers</strong>Paid Hours Provided per WeekAverage Number 11.8 12.5Distribution0 to 7 30.9 19.28 to 14 44.7 61.4>14 24.4 19.4Unpaid Hours Provided per WeekAverage Number 3.7 25.7***Distribution0 92.0 26.41 to 14 3.3 28.115 to 35 .7 16.136 to 84 2.2 22.2>84 1.8 6.9Total Hours Provided per WeekAverage Number 15.4 38.2***Distribution0 to 14 70.2 26.915 to 35 24.4 33.736 to 84 3.3 28.9>84 2.2 10.5Sample Size 275 360SOURCE:NOTE:Caregiver Survey conducted by Mathematica Policy Research, Inc. between February 2000 and May2002.<strong>Workers</strong> were asked how many hours <strong>of</strong> care they provided dur<strong>in</strong>g the two weeks preced<strong>in</strong>g the survey.<strong>The</strong>ir responses were divided <strong>in</strong> half to compute the average hours <strong>of</strong> care they provided per week. <strong>The</strong>hours that live-<strong>in</strong> workers provided <strong>in</strong>clude hours <strong>of</strong> care provided to the consumer and hours <strong>of</strong>assistance that benefited the household (<strong>in</strong>clud<strong>in</strong>g the consumer), such as cook<strong>in</strong>g, prepar<strong>in</strong>g meals, anddo<strong>in</strong>g laundry.***Significantly different from agency workers at the .01 level, two-tailed test.14


