

The Experiences of Workers Hired Under Consumer Direction in ...
The Experiences of Workers Hired Under Consumer Direction in ...
The Experiences of Workers Hired Under Consumer Direction in ...

You also want an ePaper? Increase the reach of your titles
YUMPU automatically turns print PDFs into web optimized ePapers that Google loves.
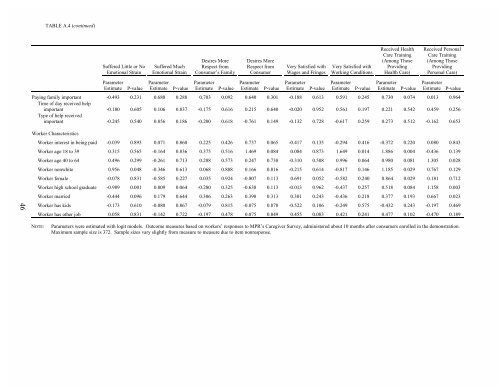
TABLE A.4 (cont<strong>in</strong>ued)Suffered Little or NoEmotional Stra<strong>in</strong>Suffered MuchEmotional Stra<strong>in</strong>Desires MoreRespect from<strong>Consumer</strong>’s FamilyDesires MoreRespect from<strong>Consumer</strong>Very Satisfied withWages and Fr<strong>in</strong>gesVery Satisfied withWork<strong>in</strong>g ConditionsReceived HealthCare Tra<strong>in</strong><strong>in</strong>g(Among ThoseProvid<strong>in</strong>gHealth Care)Received PersonalCare Tra<strong>in</strong><strong>in</strong>g(Among ThoseProvid<strong>in</strong>gPersonal Care)ParameterEstimateP-valueParameterEstimateP-valueParameterEstimateP-valueParameterEstimateP-valueParameterEstimateP-valueParameterEstimateP-valueParameterEstimateP-valueParameterEstimate P-valuePay<strong>in</strong>g family important -0.493 0.231 0.680 0.288 0.703 0.092 0.640 0.301 -0.188 0.613 0.591 0.245 0.730 0.074 0.013 0.964Time <strong>of</strong> day received helpimportant -0.180 0.605 0.106 0.837 -0.175 0.616 0.215 0.640 -0.020 0.952 0.561 0.197 0.221 0.542 0.459 0.256Type <strong>of</strong> help receivedimportant -0.245 0.540 0.856 0.186 -0.200 0.618 -0.761 0.149 -0.132 0.728 -0.617 0.259 0.273 0.512 -0.162 0.65346Worker CharacteristicsWorker <strong>in</strong>terest <strong>in</strong> be<strong>in</strong>g paid -0.039 0.893 0.071 0.860 0.225 0.426 0.737 0.065 -0.417 0.135 -0.294 0.416 -0.372 0.220 0.080 0.843Worker age 18 to 39 0.315 0.565 -0.164 0.836 0.375 0.516 1.469 0.084 0.084 0.873 1.649 0.014 1.886 0.004 -0.436 0.139Worker age 40 to 64 0.496 0.299 -0.261 0.713 0.288 0.573 0.247 0.738 -0.310 0.508 0.996 0.064 0.980 0.081 1.305 0.028Worker nonwhite 0.956 0.048 -0.346 0.613 0.068 0.888 0.166 0.816 -0.215 0.614 -0.817 0.146 1.185 0.029 0.767 0.129Worker female -0.078 0.831 -0.585 0.227 0.035 0.924 -0.807 0.113 0.691 0.052 -0.582 0.240 0.864 0.029 0.181 0.712Worker high school graduate -0.989 0.001 0.809 0.064 -0.280 0.325 -0.638 0.113 -0.013 0.962 -0.437 0.257 0.518 0.084 1.158 0.003Worker married -0.444 0.096 0.179 0.644 0.306 0.263 0.398 0.313 0.301 0.243 -0.436 0.218 0.377 0.193 0.667 0.023Worker has kids -0.173 0.610 -0.080 0.867 -0.079 0.815 -0.075 0.870 -0.522 0.106 -0.249 0.575 -0.432 0.243 -0.197 0.469Worker has other job 0.058 0.831 -0.142 0.722 -0.197 0.478 0.075 0.849 0.455 0.083 0.421 0.241 0.477 0.102 -0.470 0.189NOTE:Parameters were estimated with logit models. Outcome measures based on workers’ responses to MPR’s Caregiver Survey, adm<strong>in</strong>istered about 10 months after consumers enrolled <strong>in</strong> the demonstration.Maximum sample size is 372. Sample sizes vary slightly from measure to measure due to item nonresponse.


