2010 NRMCA - National Ready Mixed Concrete Association
2010 NRMCA - National Ready Mixed Concrete Association
2010 NRMCA - National Ready Mixed Concrete Association
You also want an ePaper? Increase the reach of your titles
YUMPU automatically turns print PDFs into web optimized ePapers that Google loves.
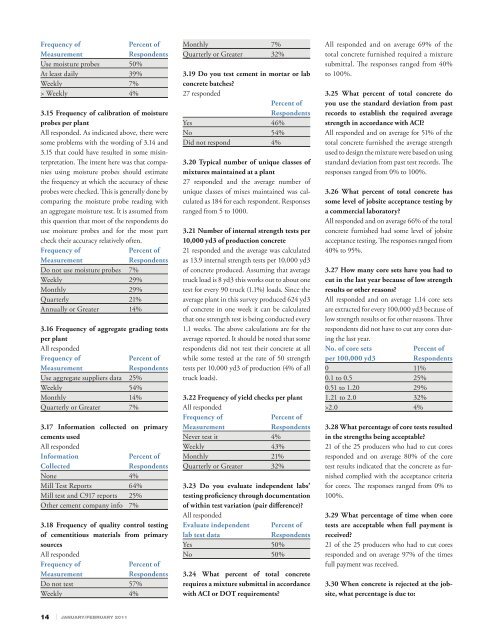
Frequency ofPercent ofMeasurementRespondentsUse moisture probes 50%At least daily 39%Weekly 7%> Weekly 4%3.15 Frequency of calibration of moistureprobes per plantAll responded. As indicated above, there weresome problems with the wording of 3.14 and3.15 that could have resulted in some misinterpretation.The intent here was that companiesusing moisture probes should estimatethe frequency at which the accuracy of theseprobes were checked. This is generally done bycomparing the moisture probe reading withan aggregate moisture test. It is assumed fromthis question that most of the respondents douse moisture probes and for the most partcheck their accuracy relatively often.Frequency ofPercent ofMeasurementRespondentsDo not use moisture probes 7%Weekly 29%Monthly 29%Quarterly 21%Annually or Greater 14%3.16 Frequency of aggregate grading testsper plantAll respondedFrequency ofPercent ofMeasurementRespondentsUse aggregate suppliers data 25%Weekly 54%Monthly 14%Quarterly or Greater 7%3.17 Information collected on primarycements usedAll respondedInformationPercent ofCollectedRespondentsNone 4%Mill Test Reports 64%Mill test and C917 reports 25%Other cement company info 7%3.18 Frequency of quality control testingof cementitious materials from primarysourcesAll respondedFrequency ofPercent ofMeasurementRespondentsDo not test 57%Weekly 4%Monthly 7%Quarterly or Greater 32%3.19 Do you test cement in mortar or labconcrete batches?27 respondedPercent ofRespondentsYes 46%No 54%Did not respond 4%3.20 Typical number of unique classes ofmixtures maintained at a plant27 responded and the average number ofunique classes of mixes maintained was calculatedas 184 for each respondent. Responsesranged from 5 to 1000.3.21 Number of internal strength tests per10,000 yd3 of production concrete21 responded and the average was calculatedas 13.9 internal strength tests per 10,000 yd3of concrete produced. Assuming that averagetruck load is 8 yd3 this works out to about onetest for every 90 truck (1.1%) loads. Since theaverage plant in this survey produced 624 yd3of concrete in one week it can be calculatedthat one strength test is being conducted every1.1 weeks. The above calculations are for theaverage reported. It should be noted that somerespondents did not test their concrete at allwhile some tested at the rate of 50 strengthtests per 10,000 yd3 of production (4% of alltruck loads).3.22 Frequency of yield checks per plantAll respondedFrequency ofPercent ofMeasurementRespondentsNever test it 4%Weekly 43%Monthly 21%Quarterly or Greater 32%3.23 Do you evaluate independent labs’testing proficiency through documentationof within test variation (pair difference)?All respondedEvaluate independent Percent oflab test dataRespondentsYes 50%No 50%3.24 What percent of total concreterequires a mixture submittal in accordancewith ACI or DOT requirements?All responded and on average 69% of thetotal concrete furnished required a mixturesubmittal. The responses ranged from 40%to 100%.3.25 What percent of total concrete doyou use the standard deviation from pastrecords to establish the required averagestrength in accordance with ACI?All responded and on average for 51% of thetotal concrete furnished the average strengthused to design the mixture were based on usingstandard deviation from past test records. Theresponses ranged from 0% to 100%.3.26 What percent of total concrete hassome level of jobsite acceptance testing bya commercial laboratory?All responded and on average 66% of the totalconcrete furnished had some level of jobsiteacceptance testing. The responses ranged from40% to 95%.3.27 How many core sets have you had tocut in the last year because of low strengthresults or other reasons?All responded and on average 1.14 core setsare extracted for every 100,000 yd3 because oflow strength results or for other reasons. Threerespondents did not have to cut any cores duringthe last year.No. of core setsPercent ofper 100,000 yd3Respondents0 11%0.1 to 0.5 25%0.51 to 1.20 29%1.21 to 2.0 32%>2.0 4%3.28 What percentage of core tests resultedin the strengths being acceptable?21 of the 25 producers who had to cut coresresponded and on average 80% of the coretest results indicated that the concrete as furnishedcomplied with the acceptance criteriafor cores. The responses ranged from 0% to100%.3.29 What percentage of time when coretests are acceptable when full payment isreceived?21 of the 25 producers who had to cut coresresponded and on average 97% of the timesfull payment was received.3.30 When concrete is rejected at the jobsite,what percentage is due to:14 ı JANUARY/FEBRUARY 2011


