2010 NRMCA - National Ready Mixed Concrete Association
2010 NRMCA - National Ready Mixed Concrete Association
2010 NRMCA - National Ready Mixed Concrete Association

Create successful ePaper yourself
Turn your PDF publications into a flip-book with our unique Google optimized e-Paper software.
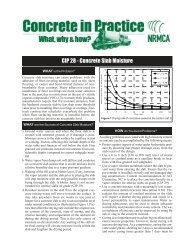
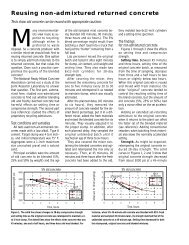
The included tables show the breakdown and the key variances forthe current and past surveys.Change,2009 vs.2008Income Statement, Dollars per Cubic Yard 2007 2008 2009 % $Material Costs (including freight)Cement costs 24.39 24.61 23.77 -3.4% (0.84)Fly Ash 1.77 1.99 2.13 7.9% 0.14Coarse Aggregates 12.77 14.23 13.55 -5.3% (0.68)Fine aggregates 8.58 9.29 9.51 2.6% 0.22Plant CostsPlant/Yard wages (hourly only - reg & OT) & Fringes 1.95 2.32 2.77 23.1% 0.45Delivery CostsDriver wages (for all on-duty time) 6.77 7.44 7.85 6.1% 0.41Fuel expenses (gas, diesel & oil for all truck mixers) 2.66 3.75 2.63 -42.1% (1.12)Direct Fixed Costs - PlantQuality Control (incl. salaries, fringes & lab) 0.59 0.70 0.85 25.4% 0.15Superintendent wages (or other wages not above) 0.74 0.94 1.51 77.0% 0.57Other direct plant expenses 0.53 0.72 0.96 45.3% 0.24Selling ExpensesSales salaries (commissions & bonuses) & Fringes 1.04 1.29 1.61 30.8% 0.32General & Administrative ExpensesOffice salaries and wages 0.80 1.10 1.31 26.3% 0.21Fringes (p/r taxes, FICA, Wrkr Comp, health., etc.) 0.38 0.55 0.59 10.5% 0.04Chart 1AComponents of A Cubic Yard of <strong>Concrete</strong>Typical Co. vs. Upper & Lower Quartiles - 2009Chart 1BComponents of A Cubic Yard of <strong>Concrete</strong>Typical Co. vs. Upper & Lower Quartiles - 2008Lower QuartileAvg Selling Price$9436 cyd$51.7154.8%$18.4319.5%$5.976.3%$28.9630.7%$-10.37-11%Upper QuartileAvg Selling Price$99.74 cyd$54.1054.24%$16.1916.23%$5.685.69%$20.1320.18%$4.264.27%Typical MemberAvg Selling Price$96.05 cyd$52.7054.9%$17.3518.06%$6.006.25%$23.0223.97%$-3.07-3.2%$0.00 $10.00 $20.00 $30.00 $40.00 $50.00 $60.00 $70.00 $80.00 $90.00 $100.00Material Costs Delivery Costs Plant Costs Fixed Costs Pre-taxChart 2: Pre-Tax Profit as a % of Sales byCompany Size - 2007 through 200915.0%10.0%5.0%0.0%-5.0%-10.0%-15.0%4.1%1.3%-4.7%Under 100,000cyd4.1%0.5%-0.9%100,000 -299,999 cyd5.7%4.6%300,000 -500,000 cyd-2.5%7.1%-0.4% -3.7%Over 500,000cyd6.7%0.2%-3.1%Typical <strong>NRMCA</strong>Member1.8%-4.6%Lowest Quartile-11.0%10.6%5.9%Upper Quartile4.3%Chart 3: Pre-Tax Profit as a % of Sales by Region2007 through 200920.0%15.0%10.0%5.0%0.0%-5.0%4.8%2.8%-0.6%7.0%-4.8%3.6%-1.9%1.8% 3.0% 2.1%2.3%1.9%-2.5%-4.7%10.9%3.7%0.6%15.2%5.2%5.7%6.9%2.5%6.7%0.2%-3.1%1.8%-4.6%10.6%5.9%4.3%2007 2008 2009-10.0%-15.0%-12.1%NE/MA SE Nth Ctrl Sth Ctrl Grt Lakes RockyMtnPac.Nthwst-11.8%Pac.SthwstTypicalMember-11.0%LowestQuartileUpperQuartile20 ı JANUARY/FEBRUARY 2011