M.A.R.C.: an Actuarial Model for Credit Risk - Proceedings ASTIN ...
M.A.R.C.: an Actuarial Model for Credit Risk - Proceedings ASTIN ...
M.A.R.C.: an Actuarial Model for Credit Risk - Proceedings ASTIN ...

You also want an ePaper? Increase the reach of your titles
YUMPU automatically turns print PDFs into web optimized ePapers that Google loves.
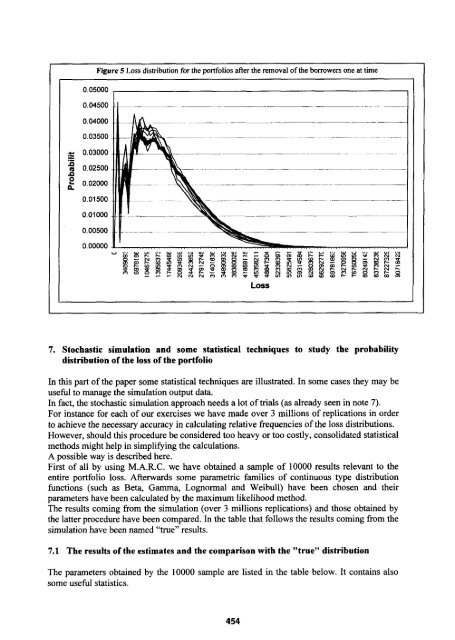
Figure 5 Loss distribution <strong>for</strong> the portfolios after the removal of the borrowers one at time0.050000.045000.040000.035000.030000.025000.020000.015000.010000.005000.00000Loss7. Stochastic simulation <strong>an</strong>d some statistical techniques to study the probabilitydistribution of the loss of the portfolioIn this part of the paper some statistical techniques are illustrated. In some cases they may beuseful to m<strong>an</strong>age the simulation output data.In fact, the stochastic simulation approach needs a lot of trials (as already seen in note 7).For inst<strong>an</strong>ce <strong>for</strong> each of our exercises we have made over 3 millions of replications in orderto achieve the necessary accuracy in calculating relative frequencies of the loss distributions.However, should this procedure be considered too heavy or too costly, consolidated statisticalmethods might help in simplifying the calculations.A possible way is described here.First of all by using M.A.R.C. we have obtained a sample of 10000 results relev<strong>an</strong>t to theentire portfolio loss. Afterwards some parametric families of continuous type distributionfunctions (such as Beta, Gamma, Lognormal <strong>an</strong>d Weibull) have been chosen <strong>an</strong>d theirparameters have been calculated by the maximum likelihood method.The results coming from the simulation (over 3 millions replications) <strong>an</strong>d those obtained bythe latter procedure have been compared. In the table that follows the results coming from thesimulation have been named “true” results.7.1 The results of the estimates <strong>an</strong>d the comparison with the “true” distributionThe parameters obtained by the 10000 sample are listed in the table below. It contains alsosome useful statistics.454