Math 214 Statistics Fall 13 Sample Midterm 1 (1) The following ...
Math 214 Statistics Fall 13 Sample Midterm 1 (1) The following ...
Math 214 Statistics Fall 13 Sample Midterm 1 (1) The following ...

You also want an ePaper? Increase the reach of your titles
YUMPU automatically turns print PDFs into web optimized ePapers that Google loves.
2(b) Using the stem and leaf diagram, find the minimum, median and maximum.(c) Using the stem and leaf diagram, do you expect the mean to be largeror smaller than the median? Explian why.(3) A data set on the size, in millimeters, of a sample of 40 potato bugs producesthe <strong>following</strong> histogram.Histogram of bugsFrequency0 1 2 3 4 5 6 74 6 8 10 12 14 16Length (mm)(a) What percentage of bugs have lengths less that 10mm?length exactly 10mm.)(None have(b) Find the median, Q1, and Q3. Compute the interquartile range (IQR).(c) Construct the corresponding box plot.
(4) <strong>The</strong> <strong>following</strong> data comes from a study of birtweights of newborn babies. <strong>The</strong>data set of over 1,000 newborns was broken up by the smoking status of themother. For each group a boxplot was produced.3Based on the boxplots, answer the <strong>following</strong> questions.(a) Which group has the smallest median birthweight?(b) Which group contains the baby with the smallest birthweight?(c) Approximately % of babies born to mothers who smoked duringpregnancy were below the median birth weight of babies born to motherswho never smoked.(d) True or False: <strong>The</strong> group with the largest range of birthweights has thesmallest IQR of birthweights.(e) Based on the boxplots, what would you advise a newly pregnant womanwho smokes? Explain you reasoning.
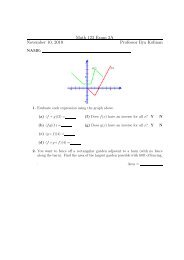
4(5) A game consits fo rolling two fair dice, a 4-sided tetrahedron, and a 6-sidedcube, and then adding up their scores. <strong>The</strong> random variable X is the sum ofthe two numbers on the dice.(a) List the sample space of the game, i.e. list all possible outcomes of rollingthe dice.(b) What is the probability that the sum (X) is equal to 3?(c) Find the probabilities P (X < 5) and P (x ≠ 8).(d) Draw the probablity distribution of X.(6) Let Z be a normally distributed random variable with mean µ = 0 andstandard deviation σ = 1.(a) Find P (Z < −0.5).(b) Find P (0 < Z < 1.5).(7) <strong>The</strong> average time for an Empire penguin egg to hatch is 70 days, with astandard deviation of 5 days. Assume the distribution of times is normallydistributed.(a) Find the probability that an egg hatches in 73 days or more.(b) Find the probability that an egg hatches between 65 and 75 days.(c) By what day have 90% of the eggs hatched?(8) Below is a screenshot from salary.com showing the distribution of publicschool salaries in New York City.
5(a) What percentage of teachers of earn between $52, 423 and $78, 335?(b) <strong>The</strong> distribution is actually skewed a little. Right or Left? What is bigger,mean or median?(c) Assuming the distribution is approximately normal, what is the standarddeviation?