Lab Project 5: The Normal approximation to Binomial distribution
Lab Project 5: The Normal approximation to Binomial distribution
Lab Project 5: The Normal approximation to Binomial distribution

You also want an ePaper? Increase the reach of your titles
YUMPU automatically turns print PDFs into web optimized ePapers that Google loves.
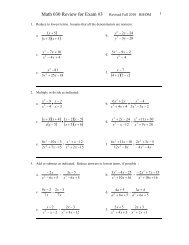
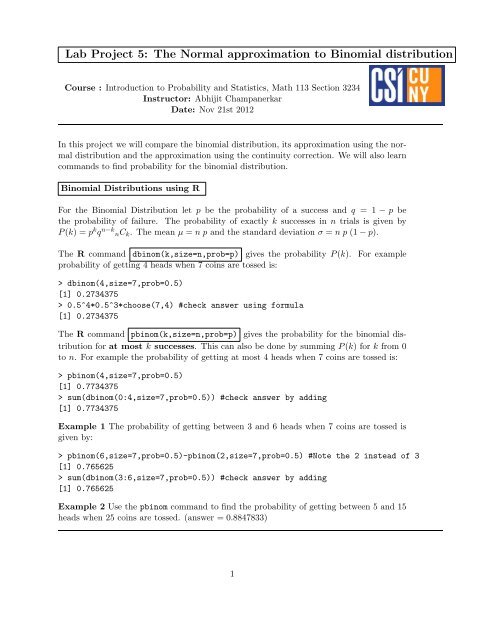
<strong>Lab</strong> <strong>Project</strong> 5: <strong>The</strong> <strong>Normal</strong> <strong>approximation</strong> <strong>to</strong> <strong>Binomial</strong> <strong>distribution</strong>Course : Introduction <strong>to</strong> Probability and Statistics, Math 113 Section 3234Instruc<strong>to</strong>r: Abhijit ChampanerkarDate: Nov 21st 2012In this project we will compare the binomial <strong>distribution</strong>, its <strong>approximation</strong> using the normal<strong>distribution</strong> and the <strong>approximation</strong> using the continuity correction. We will also learncommands <strong>to</strong> find probability for the binomial <strong>distribution</strong>.<strong>Binomial</strong> Distributions using RFor the <strong>Binomial</strong> Distribution let p be the probability of a success and q = 1 − p bethe probability of failure. <strong>The</strong> probability of exactly k successes in n trials is given byP (k) = p k q n−k nC k . <strong>The</strong> mean µ = n p and the standard deviation σ = n p (1 − p).<strong>The</strong> R command dbinom(k,size=n,prob=p) gives the probability P (k).probability of getting 4 heads when 7 coins are <strong>to</strong>ssed is:For example> dbinom(4,size=7,prob=0.5)[1] 0.2734375> 0.5^4*0.5^3*choose(7,4) #check answer using formula[1] 0.2734375<strong>The</strong> R command pbinom(k,size=n,prob=p) gives the probability for the binomial <strong>distribution</strong>for at most k successes. This can also be done by summing P (k) for k from 0<strong>to</strong> n. For example the probability of getting at most 4 heads when 7 coins are <strong>to</strong>ssed is:> pbinom(4,size=7,prob=0.5)[1] 0.7734375> sum(dbinom(0:4,size=7,prob=0.5)) #check answer by adding[1] 0.7734375Example 1 <strong>The</strong> probability of getting between 3 and 6 heads when 7 coins are <strong>to</strong>ssed isgiven by:> pbinom(6,size=7,prob=0.5)-pbinom(2,size=7,prob=0.5) #Note the 2 instead of 3[1] 0.765625> sum(dbinom(3:6,size=7,prob=0.5)) #check answer by adding[1] 0.765625Example 2 Use the pbinom command <strong>to</strong> find the probability of getting between 5 and 15heads when 25 coins are <strong>to</strong>ssed. (answer = 0.8847833)1
<strong>Normal</strong> Distributions using R<strong>The</strong> command pnorm(x,mean=0,sd=1) gives theprobability for that the z-value is less than x i.e. thecumulative area on the left of a x for a standard normal<strong>distribution</strong>. <strong>The</strong> area which pnorm computesis shown here. For example, probability of getting anumber less than 1 in the standard normal <strong>distribution</strong>is:> pnorm(1,mean=0,sd=1)[1] 0.8413447<strong>The</strong> command pnorm(x,mean=m,sd=s) gives the probability for selecting a number lessthan x from a normal <strong>distribution</strong> with mean m and standard deviation s.Example 3 <strong>The</strong> probability of getting a number between 1 and 4 in the a normal <strong>distribution</strong>with mean 2 and standard <strong>distribution</strong> 0.7 is given by:> pnorm(4,mean=2,sd=.7)-pnorm(1,mean=2,sd=0.7)[1] 0.9978535Example 4 Use the pnorm command <strong>to</strong> find the probability of getting a number between5 and 15 heads for a normal <strong>distribution</strong> with mean 8 and standard deviation 4. (answer= 0.7333135).Approximating the <strong>Binomial</strong> <strong>distribution</strong>Now we are ready <strong>to</strong> approximate the binomial <strong>distribution</strong> using the normal curve andusing the continuity correction.Example 5 Suppose 35% of all households in Carville have three cars, what is the probabilitythat a random sample of 80 households in Carville will contain at least 30 householdsthat have three cars.Solution : For this problem n = 80 and p = 35% = 0.35, q = 0.65. <strong>The</strong> mean µ = n × p =80 × 0.35 = 28 and the standard deviation σ = √ n × p × q = √ 80 × 0.35 × 0.65 = 4.26.Using binomial <strong>distribution</strong>:> pbinom(80,size=80,prob=0.35)- pbinom(29,size=80,prob=0.35)[1] 0.3588295Using the normal <strong>distribution</strong>:> 1-pnorm(30,mean=28,sd=4.26)[1] 0.3193622
Since we need <strong>to</strong> find probability that at least 30 households that have three cars, weneed <strong>to</strong> use 30 − 0.5 in the continuity correction.Using continuity correction:> 1-pnorm(29.5,mean=28,sd=4.26)[1] 0.3623769You can see that the answer using continuity correction is much closer <strong>to</strong> the actual value !QuestionsAbout two out of every three gas purchases at Cheap Gas station are paid for by creditcards. 480 cus<strong>to</strong>mers buying gas at this station are randomly selected. Find the followingprobabilities using the binomial <strong>distribution</strong>, normal <strong>approximation</strong> and using the continuitycorrection.1. Find n, p, q, the mean and the standard deviation.2. Find the probability that greater than 300 will pay for their purchases using creditcard.3. Find the probability that between 220 <strong>to</strong> 320 will pay for their purchases usingcredit card.4. Generate a random number using the command floor(rnorm(1, mean=200, sd=50)).Write this number down. Lets call it N. (This number will be different for each student.)5. Find the probability that at most N cus<strong>to</strong>mers will pay for their purchases usingcredit card.Write the answers you found for the above questions in the tear off sheet on the next pageand hand in this sheet.3