FT-IR microscopic identification of fibers - Bruker
FT-IR microscopic identification of fibers - Bruker
FT-IR microscopic identification of fibers - Bruker
- No tags were found...

You also want an ePaper? Increase the reach of your titles
YUMPU automatically turns print PDFs into web optimized ePapers that Google loves.
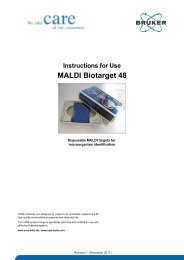
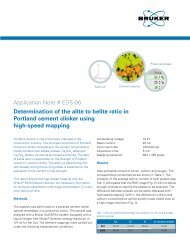
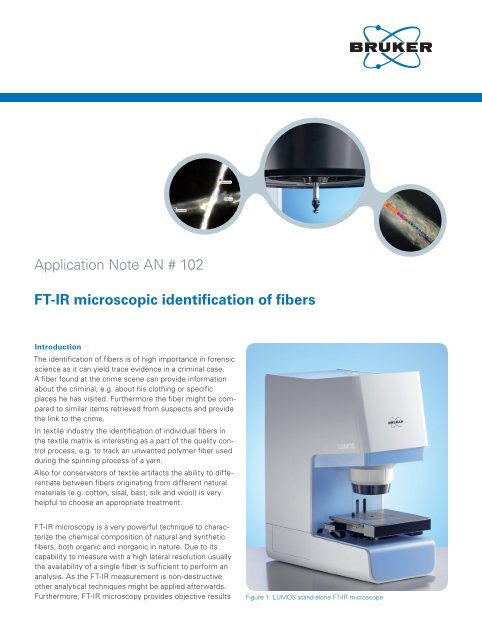
and is in most cases quicker, easier, and sometimes, moreselective than classical methods. Due to these multiplebenefits the <strong>IR</strong>-<strong>microscopic</strong> method is described by ASTMInternational as standard method for forensic analysis <strong>of</strong><strong>fibers</strong> (ASTM E2224-10) and for <strong>identification</strong> <strong>of</strong> <strong>fibers</strong> intextiles (ASTM D276-12).Using the ATR-(Attenuated Total Reflectance) techniqueminimal sample preparation is required to perform an <strong>FT</strong>-<strong>IR</strong>-<strong>microscopic</strong> measurement. Just a fixation <strong>of</strong> the fiberon a flat substrate like a metal plate is required to avoid itsmovement during visual inspection and definition <strong>of</strong> themeasurement positions. In this application note measurements<strong>of</strong> different natural and synthetic <strong>fibers</strong> using thefully automated <strong>FT</strong>-<strong>IR</strong> microscope LUMOS are presented.InstrumentationThe presented fiber measurements were performed usingthe stand-alone <strong>FT</strong>-<strong>IR</strong> microscope LUMOS (Fig.1). Itstands out due its full automation and ease-<strong>of</strong>-use combinedwith sample visualization and infrared spectroscopicperformance <strong>of</strong> excellent quality. Its 8x objective providesthe measurement modes ATR, transmission and reflectionand high quality visual inspection capabilities.All required changes <strong>of</strong> hardware settings as well as thecomplete <strong>IR</strong>-measurement procedures including backgroundmeasurements are performed fully automated– even in the ATR-mode which is the typical approach tomeasure <strong>fibers</strong>. To provide perfect contact to samplesranging from s<strong>of</strong>t to very hard the ATR-device <strong>of</strong>fers threepressure steps and is equipped with a very precise internalpressure sensor.Due to a large working distance and an unobstructedaccess to the planar sample stage the sample positioningis extremely convenient. Additionally for maximum performanceand convenience the LUMOS includes:gggggMotorized Germanium ATR crystal with internalpressure controlLarge field <strong>of</strong> view: 1.5 x 1.2 mmAutomated change <strong>of</strong> the numerical aperture between<strong>IR</strong> and Vis mode to achieve a high depth <strong>of</strong> field for thevisual inspection <strong>of</strong> a sample, but also highest sensitivityfor the <strong>IR</strong> analysisIndependent white light LED illumination in transmissionand reflectionFast CMOS camera with 4x zoomgMotorized stage (option), position accuracy <strong>of</strong> 0.1 µmgOptional macro accessory that allows to use all QuickSnap sampling modules from the compact <strong>FT</strong><strong>IR</strong>spectrometer ALPHAWork-flow <strong>of</strong> the fiber analysisBefore measurement the fiber sample is fixed on a metalplate with adhesive tape. For analysis the plate is placedon the sample stage <strong>of</strong> the <strong>IR</strong>-microscope. Utilizing fullmotorization <strong>of</strong> the LUMOS, the Opus s<strong>of</strong>tware guides theuser very efficiently through the process <strong>of</strong> data acquisition.All required changes <strong>of</strong> the hardware settings areperformed s<strong>of</strong>tware controlled. The user interface presentsthe operator always the appropriate functions for thecurrent step.Fig.2: Visual inspection<strong>of</strong> a fiber sample usingthe LUMOS s<strong>of</strong>tware.The live camera view <strong>of</strong>the sample is shown inthe middle (here withoutpolarizer) and storedimages in the overview onthe right (here an imagetaken with crossed polarizersis shown).
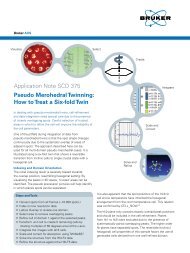
Fig.3: Definition <strong>of</strong> measurement positions and according knife edge aperture settings (indicated by red rectangle).Figure 2 shows the user interface during the visual inspection<strong>of</strong> a fiber sample during which pictures <strong>of</strong> the samplecan be taken using the digital camera. The function baron the left side provides the functions useful for this step,like the setting <strong>of</strong> polarizers for contrast enhancement. Inthe middle window the live view <strong>of</strong> the camera shows thesample and in the overview on the right side the savedpictures are displayed.The definition <strong>of</strong> the measurement positions on the fiber isshown in Fig.3. Resizing and turning <strong>of</strong> the red rectanglesallows setting the automated knife-edge aperture accordingto the sample dimensions individually at each measurementposition. To always provide the optimal backgroundspectrum for sample positions with differing aperture sizesthe LUMOS <strong>of</strong>fers a mode where upon aperture changea new background spectrum is recorded automatically.In the ATR-mode automation <strong>of</strong> the background measurementis realized by an internal piezo drive moving thecrystal into the focus.a quite similar visual appearance prepared on a blacksampling plate. Though, despite their visual similarity the<strong>IR</strong>-<strong>microscopic</strong> spectra on the right reveal that only for tw<strong>of</strong>ibers the same type <strong>of</strong> polymer was used. By search indedicated spectral databases (e.g. <strong>Bruker</strong> Synthetic FibersLibrary) the fiber material easily can be determined (figure5).Poly phenylenesulfide (PPS)Polyamide(PA, Nylon)Poly lactic acid(PLA, Polyester)Polyamide(PA, Nylon)Example: Identification <strong>of</strong> synthetic <strong>fibers</strong>Various synthetic <strong>fibers</strong> with a diameter in the range <strong>of</strong>25 to 40µm were measured using the <strong>FT</strong>-<strong>IR</strong> microscopeLUMOS with the automatic knife-edge aperture set accordinglyto the fiber dimensions. The measurements wereperformed using the ATR-mode with an acquisition time <strong>of</strong>20seconds/spectrum and at an spectral resolution <strong>of</strong> 4cm -1 .The picture in figure 4 shows the five <strong>fibers</strong> which havePolyetyleneterephthalate(PET, Polyester)Fig.4: Synthetic <strong>fibers</strong> prepared on sampling plate (left) and accordingspectra (right). Library search <strong>of</strong> the spectra allows easy <strong>identification</strong><strong>of</strong> the fiber’s chemical composition. Even though the visualappearance is very similar, only two <strong>fibers</strong> are made from the samepolymer.
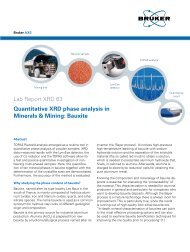
Fig.5: The measured fiber spectrum (red) is unambiguously identifiedas Nylon by search in the <strong>Bruker</strong> Synthetic Fibers spectra library: Thefirst seven hits in the list originate from pure Nylon fiber references.The spectra <strong>of</strong> hit 1 (blue) and hit 4 (green) are shown for comparison.Example: Analysis <strong>of</strong> natural <strong>fibers</strong>The result <strong>of</strong> the measurement <strong>of</strong> two crossed <strong>fibers</strong> isshown in figure 6 as displayed in the Chemical Imagingwindow <strong>of</strong> the Opus s<strong>of</strong>tware. The upper left “Overview”allows selection <strong>of</strong> available <strong>microscopic</strong> pictures. Zoomingand navigation on the selected picture is performedusing the red rectangle. The upper right “Selection view”shows the zoomed area with measurement positions,indications <strong>of</strong> used apertures and annotations. Accordingto the color <strong>of</strong> the measurement positions the samplespectra are displayed in the “Spectra view” together withFig. 6: The blue spectrum originates from the lower fiber, the red one from the upper fiber. For comparison reference spectra are displayed(black: wool, orange: cotton)
eference spectra, e.g. from spectra libraries. The <strong>IR</strong>-spectrumclearly shows that the lower fiber (blue spectrum) ismade from wool (black reference spectrum) whereas theupper one (red spectrum) is made from cotton (orangereference spectrum).Example: Chemical Imaging <strong>of</strong> a human hair<strong>IR</strong>-microscopy even allows detecting and visualizingchemical variances on the surface <strong>of</strong> a single fiber. Thisexample shows the measurement <strong>of</strong> a human hair that hasbeen partially bleached. To expand the area on which themapping measurement can be performed and to preventsample deformation due to the contact with the ATR-crystalthe hair was flattened using a diamond compressioncell prior to the measurement.A line map was performed along the hair covering ableached and a non-bleached (outgrown) part. Thebleaching affects the fingerprinting range <strong>of</strong> the <strong>IR</strong>-spectra,e.g. bands at 1180cm -1 and 1040cm -1 increase in intensity.Figure 7 shows the chemical image based on theintegration <strong>of</strong> the 1040cm -1 band superimposed with thevisual image <strong>of</strong> the hair. With the integration intensitiesat each measurement position being color and size codedthe image clearly shows the chemical difference betweenbleached and unbleached hair.Summary<strong>IR</strong>-microscopy is an established technique to determinethe chemical identity <strong>of</strong> synthetic and natural <strong>fibers</strong>. Theimaging capabilities <strong>of</strong> the <strong>IR</strong>-<strong>microscopic</strong> method evenallow visualizing chemical differences on single <strong>fibers</strong> withhigh lateral resolution. With the fully automated standalone<strong>IR</strong>-microscope LUMOS the analysis <strong>of</strong> <strong>fibers</strong> can beperformed without specific <strong>IR</strong>-spectroscopic expertise.The intuitive s<strong>of</strong>tware guided workflow allows even untrainedpersonal quickly performing the measurement andspectra evaluation.Fig.7: Line map measurement on a human hair covering bleached and non-bleached areas. The red rectangles indicate the applied lateralresolution <strong>of</strong> the measurement. The superimposed chemical image visualizes the difference between bleached and unbleached hair based onthe <strong>IR</strong>-band at about 1040cm -1 .www.bruker.com/optics<strong>Bruker</strong> Optics Inc.<strong>Bruker</strong> Optik GmbH<strong>Bruker</strong> Hong Kong Ltd.Billerica, MA · USAPhone +1 (978) 439-9899Fax +1 (978) 663-9177info@brukeroptics.comEttlingen · DeutschlandPhone +49 (7243) 504-2000Fax +49 (7243) 504-2050info@brukeroptics.deHong KongPhone +852 2796-6100Fax +852 2796-6109hk@brukeroptics.com.hk<strong>Bruker</strong> Optics is continually improving its products and reserves the right to change specifications without notice.© 2010 <strong>Bruker</strong> Optics BOPT-4000479-01