What America's Users Spend on Illegal Drugs 1988-2000 - National ...
What America's Users Spend on Illegal Drugs 1988-2000 - National ...
What America's Users Spend on Illegal Drugs 1988-2000 - National ...
- No tags were found...

You also want an ePaper? Increase the reach of your titles
YUMPU automatically turns print PDFs into web optimized ePapers that Google loves.
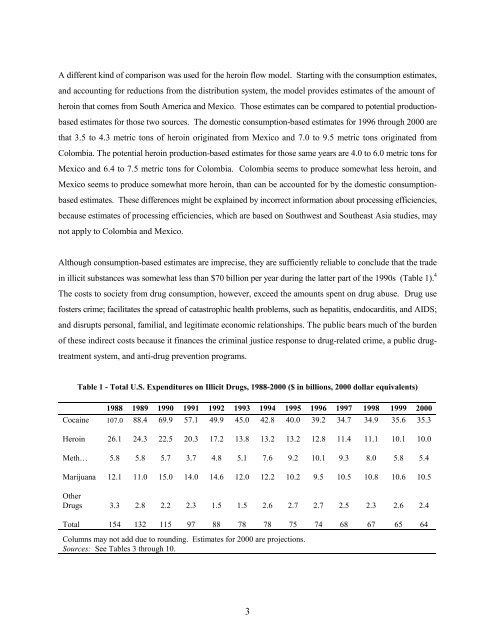
A different kind of comparis<strong>on</strong> was used for the heroin flow model. Starting with the c<strong>on</strong>sumpti<strong>on</strong> estimates,and accounting for reducti<strong>on</strong>s from the distributi<strong>on</strong> system, the model provides estimates of the amount ofheroin that comes from South America and Mexico. Those estimates can be compared to potential producti<strong>on</strong>basedestimates for those two sources. The domestic c<strong>on</strong>sumpti<strong>on</strong>-based estimates for 1996 through <strong>2000</strong> arethat 3.5 to 4.3 metric t<strong>on</strong>s of heroin originated from Mexico and 7.0 to 9.5 metric t<strong>on</strong>s originated fromColombia. The potential heroin producti<strong>on</strong>-based estimates for those same years are 4.0 to 6.0 metric t<strong>on</strong>s forMexico and 6.4 to 7.5 metric t<strong>on</strong>s for Colombia. Colombia seems to produce somewhat less heroin, andMexico seems to produce somewhat more heroin, than can be accounted for by the domestic c<strong>on</strong>sumpti<strong>on</strong>basedestimates. These differences might be explained by incorrect informati<strong>on</strong> about processing efficiencies,because estimates of processing efficiencies, which are based <strong>on</strong> Southwest and Southeast Asia studies, maynot apply to Colombia and Mexico.Although c<strong>on</strong>sumpti<strong>on</strong>-based estimates are imprecise, they are sufficiently reliable to c<strong>on</strong>clude that the tradein illicit substances was somewhat less than $70 billi<strong>on</strong> per year during the latter part of the 1990s (Table 1). 4The costs to society from drug c<strong>on</strong>sumpti<strong>on</strong>, however, exceed the amounts spent <strong>on</strong> drug abuse. Drug usefosters crime; facilitates the spread of catastrophic health problems, such as hepatitis, endocarditis, and AIDS;and disrupts pers<strong>on</strong>al, familial, and legitimate ec<strong>on</strong>omic relati<strong>on</strong>ships. The public bears much of the burdenof these indirect costs because it finances the criminal justice resp<strong>on</strong>se to drug-related crime, a public drugtreatmentsystem, and anti-drug preventi<strong>on</strong> programs.Table 1 - Total U.S. Expenditures <strong>on</strong> Illicit <strong>Drugs</strong>, <strong>1988</strong>-<strong>2000</strong> ($ in billi<strong>on</strong>s, <strong>2000</strong> dollar equivalents)<strong>1988</strong> 1989 1990 1991 1992 1993 1994 1995 1996 1997 1998 1999 <strong>2000</strong>Cocaine 107.0 88.4 69.9 57.1 49.9 45.0 42.8 40.0 39.2 34.7 34.9 35.6 35.3Heroin 26.1 24.3 22.5 20.3 17.2 13.8 13.2 13.2 12.8 11.4 11.1 10.1 10.0Meth… 5.8 5.8 5.7 3.7 4.8 5.1 7.6 9.2 10.1 9.3 8.0 5.8 5.4Marijuana 12.1 11.0 15.0 14.0 14.6 12.0 12.2 10.2 9.5 10.5 10.8 10.6 10.5Other<strong>Drugs</strong> 3.3 2.8 2.2 2.3 1.5 1.5 2.6 2.7 2.7 2.5 2.3 2.6 2.4Total 154 132 115 97 88 78 78 75 74 68 67 65 64Columns may not add due to rounding. Estimates for <strong>2000</strong> are projecti<strong>on</strong>s.Sources: See Tables 3 through 10.3