What America's Users Spend on Illegal Drugs 1988-2000 - National ...
What America's Users Spend on Illegal Drugs 1988-2000 - National ...
What America's Users Spend on Illegal Drugs 1988-2000 - National ...
- No tags were found...

Create successful ePaper yourself
Turn your PDF publications into a flip-book with our unique Google optimized e-Paper software.
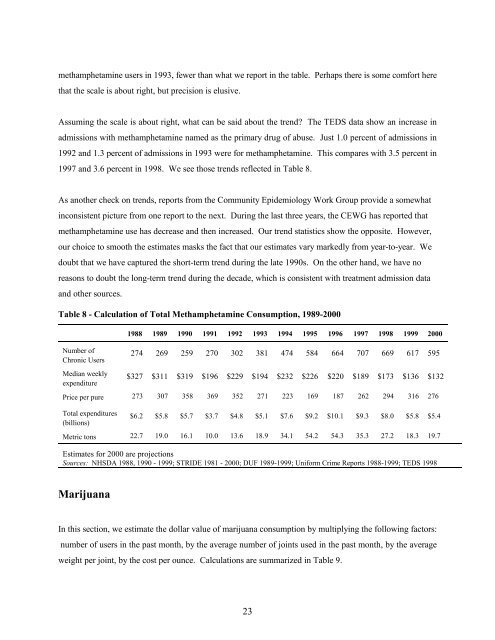
methamphetamine users in 1993, fewer than what we report in the table. Perhaps there is some comfort herethat the scale is about right, but precisi<strong>on</strong> is elusive.Assuming the scale is about right, what can be said about the trend? The TEDS data show an increase inadmissi<strong>on</strong>s with methamphetamine named as the primary drug of abuse. Just 1.0 percent of admissi<strong>on</strong>s in1992 and 1.3 percent of admissi<strong>on</strong>s in 1993 were for methamphetamine. This compares with 3.5 percent in1997 and 3.6 percent in 1998. We see those trends reflected in Table 8.As another check <strong>on</strong> trends, reports from the Community Epidemiology Work Group provide a somewhatinc<strong>on</strong>sistent picture from <strong>on</strong>e report to the next. During the last three years, the CEWG has reported thatmethamphetamine use has decrease and then increased. Our trend statistics show the opposite. However,our choice to smooth the estimates masks the fact that our estimates vary markedly from year-to-year. Wedoubt that we have captured the short-term trend during the late 1990s. On the other hand, we have noreas<strong>on</strong>s to doubt the l<strong>on</strong>g-term trend during the decade, which is c<strong>on</strong>sistent with treatment admissi<strong>on</strong> dataand other sources.Table 8 - Calculati<strong>on</strong> of Total Methamphetamine C<strong>on</strong>sumpti<strong>on</strong>, 1989-<strong>2000</strong><strong>1988</strong> 1989 1990 1991 1992 1993 1994 1995 1996 1997 1998 1999 <strong>2000</strong>Number ofChr<strong>on</strong>ic <str<strong>on</strong>g>Users</str<strong>on</strong>g>274 269 259 270 302 381 474 584 664 707 669 617 595Median weeklyexpenditure$327 $311 $319 $196 $229 $194 $232 $226 $220 $189 $173 $136 $132Price per pure 273 307 358 369 352 271 223 169 187 262 294 316 276Total expenditures(billi<strong>on</strong>s)$6.2 $5.8 $5.7 $3.7 $4.8 $5.1 $7.6 $9.2 $10.1 $9.3 $8.0 $5.8 $5.4Metric t<strong>on</strong>s 22.7 19.0 16.1 10.0 13.6 18.9 34.1 54.2 54.3 35.3 27.2 18.3 19.7Estimates for <strong>2000</strong> are projecti<strong>on</strong>sSources: NHSDA <strong>1988</strong>, 1990 - 1999; STRIDE 1981 - <strong>2000</strong>; DUF 1989-1999; Uniform Crime Reports <strong>1988</strong>-1999; TEDS 1998MarijuanaIn this secti<strong>on</strong>, we estimate the dollar value of marijuana c<strong>on</strong>sumpti<strong>on</strong> by multiplying the following factors:number of users in the past m<strong>on</strong>th, by the average number of joints used in the past m<strong>on</strong>th, by the averageweight per joint, by the cost per ounce. Calculati<strong>on</strong>s are summarized in Table 9.23