Professional Panel Screen by LC/MS/MS
Professional Panel Screen by LC/MS/MS
Professional Panel Screen by LC/MS/MS

Create successful ePaper yourself
Turn your PDF publications into a flip-book with our unique Google optimized e-Paper software.
<strong>Professional</strong> <strong>Panel</strong> <strong>Screen</strong> <strong>by</strong><strong>LC</strong>/<strong>MS</strong>/<strong>MS</strong>Andrew J. Fischinger Ph.D., MT(ASCP) &Lesli Joseph B.S. Norchem Drug Testing,Flagstaff, AZ
<strong>LC</strong>/<strong>MS</strong>/<strong>MS</strong> GC/<strong>MS</strong>
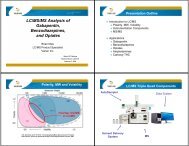
1200L <strong>LC</strong>/<strong>MS</strong> & <strong>LC</strong>/<strong>MS</strong>/<strong>MS</strong>ProStar Binary 210Solvent DeliverySystemProStar 430AutoSamplerModule1200L <strong>MS</strong>with ESI
Analyzer ComponentsQ1Multiplier+/- 5kV postaccelerationQ3Q2Curved186 mmPath
MRM Scanning of m/z Parent >Daughter mass fragmentsAnalyte Parent > Daughter RTCollision EnergyMeperidine-D4: 252.3 > 224.0 0.483 min -18.5 VoltsKetamine: 238.2 > 125.0 0.434 min -24.5 VoltsPentazocine: 286.5 > 218.0 0.524 min -17.5 VoltsButorphanol: 328.4 > 310.0 0.497 min -19.5 VoltsMeperidine:248.2 > 220.0 0.484 min -18.5 VoltsTramadol: 264.2 > 58.00.459 min -10.5 Volts264.2 > 246.0 0.459 min -09.0 Volts
Method PerformanceAnalyte Withinthin-run Between-run Limit Accuracy(ng/mL) Linearity LOD/LOQ Precision Precision PCarryover %Ketamine 23-12004 / 23 2.2 % CV 2.4 % CV 1200 99.5Pentazocine 14 - 300 2 / 14 3.6 % CV 4.8 % CV 300 95.7Meperidine 173-3600 3600 34 / 173 5.5 % CV 6.3 % CV 3600 101.3Butorphanol 18 - 300 8 / 18 8.6 % CV 13.8 % CV 300 103.0Tramadol 170-3600 30 / 170 5.5 % CV 6.4 % CV 3600 101.3Interferences:None with over 80 high levels of variousdrugs of abuse and therapeutic drugs tested as documentedin our validation study (as recently documented in our CAPFUDT Inspection)
Specimen Preparation for <strong>LC</strong>/<strong>MS</strong>/<strong>MS</strong> RunInternal Standard (IS): Meperidine-D4, 2.0 ng/mL QC: -25 and 25% & neg. controls.Calibrator: 25 ng/mL of Butorphanol & Pentazocine, 300 ng/mL for fMeperidine &Tramadol, and 100 ng/mL for Ketamine. Assay calibrated for 1.00 mL Samples1. Add 100 mcL of IS to each tube. Add 1.00 mL of Calibrator, controls and urinespecimens.2. Add 1.0 mL of pH 8.5, 2.0 M TRIS buffer to each tube, vortex.3. Pass 1.0 mL methanol through SPE column (BCD GV-65).4. Pour specimen into column and let drip through <strong>by</strong> gravity.5. Wash column with 2.0 mL of 0.1 M pH 8.5, TRIS buffer.6. Dry columns under full vacuum for 2 minutes.7. Elute with 0.5 mL acetonitrile (B organic on <strong>LC</strong>/<strong>MS</strong>/<strong>MS</strong>).8. Add 250 mcL of A (0.1% aq. formic acid, on <strong>LC</strong>/<strong>MS</strong>/<strong>MS</strong>) to eluent. Vortex.9. Transfer to labeled <strong>LC</strong>/<strong>MS</strong>/<strong>MS</strong> plastic conical 0.5 mL vials. Cap vials vand tapto dislodge any air bubbles at bottom of vial.10. Run gradient flow on Varian 1200L w. 420 Autosampler & Nitrogen generator.11. Gradient: %A & %B at 50% at time 0-202 sec, ramping to 97.5% B for 50 sec,holding 97.5% B for 7 sec, & going back to 50% B during the last second ofthe 1min run. NOTE: Due to current “software/hardware”? Constraints ittakes another 55 sec to print out results!
• Costeffectiv
<strong>LC</strong>/<strong>MS</strong>/<strong>MS</strong> for <strong>Screen</strong>ing?Advantages:1. No need to derivitize, , faster processing for multipleanalytes.2. Can screen more analytes with a single simple, rapidextraction.3. More specific, even at peaks appearing at same retentiontimes (RT).4. Higher sensitivity, no need to dry down SPE eluates.Disadvantages:1. Same MW parents generally need RT separation, e.g.,morphine / hydromorphone, and codeine / hydrocodone.2. Generally limited to a multiple screen of @ 10 analytes for“rapid” <strong>LC</strong>/<strong>MS</strong>/<strong>MS</strong> screening runs of @ 1min.
<strong>LC</strong>/<strong>MS</strong>/<strong>MS</strong> <strong>Screen</strong>ing vs. Confirmations<strong>Screen</strong>ing:1. Need only a minimum of Parent > Daughter transitions.NOTE: One Parent > Daughter monitoring generally OK,except if interfering analytes (other drugs or metabolites)appear within the set Q1 amu or RT peak seek window.2. Rapid multiple screening at @ 1 min/run, if interferinganalytes not seen within RT peak seek window,@ +/- .2minNOTE:Can find other daughter ions to remove interferants.Confirmation:1. Same considerations as above, but probably need 3daughters with 2 qualifiers,to meet forensic requirements.2. Need LOQ and ULOL controls as well as +/- 25% Controls.
Tramadol with 246.0 m/z qualifier246 m/z secondarydaughter ionqualifier insures thatwe can distinguishfrom Venlafaxine(Effexor)
Venlafaxine (Effexor) vs. TramadolEffexor (Antidepressant)MW = 313.87O-Demethylated RT = 0.372ESI + 264.6 > 246.0 100.0 %ESI + 264.6 > 58.0 60.9 %Area (246.0)/Area (58.0) = 164.1%Tramadol (Analgesic, Non-narcotic) MW = 263.40RT = 0.466(+/- 0.2 min search window)ESI + 264.2 > 58.0 100 %ESI + 264.2 > 246.0 2.25 %Area (246.0)/Area (58.0) = 2.25 %
Other Advantages of <strong>LC</strong>/<strong>MS</strong>/<strong>MS</strong>• Rapid analyses, < 2 minutes usually.• High linearities, 5 – 10,000 ng/mL fortypical confirmations of urine drugs ofabuse, allowing high sample predilutions& faster TAT’s.• Automation & increased accuracy withrapid (TECAN) 96 microtiter plate samplewith reagents dispenser (Flexispense)addition.
Mass Analyzer w/ 2 GuidesIon energy 3.0 eVIon GuideQ1Ion GuideRF onlyRF & DCRF onlyPre-filter ion guides (rather than lenses) reducethe radial displacement in the mass filter andimprove the peak shape and resolution. Thisimproves tuning and ion throughput over awide mass range and energy level
Ion Guides (Q1 and Q3)Pre-ion guidePost-ion guide• Pre-ion and post-ion guides– A set of 1 cm long quadrupole rods at entrance and exitof main quadrupole assembly– RF only waveform is applied to lessen fringe affects atends of DC/RF quadrupole field– On both Q1 and Q3• Using ion guides and the elimination of lensesincreases ion transmission efficiency (signal)
Collision Cell• 180 degree path– 40 degree pre-guide evacuation section– 100 degree collision cell (186 mm path)– 40 degree post-guide evacuation section• Curved for low noise and high sensitivity– Removes neutrals from the CID process– Positions the detector in off-axis from the source• Long path for wide CID energy range– Efficient dissociation of stable ions• Square geometry with flat surfaces– Larger cross sectional area for ion transmission• Collision cell without lenses– Decreased ion losses
Collision Cell: Curved DesignIonSourceNeutral Noise Positions the ion detector off-axis from the ionsource Removes photons, metastables, & high energycharged droplets from ion detectorDetectorIons
Summary for <strong>MS</strong> Analyzer• <strong>MS</strong> Analyzer with pre- and post-filter ion guides– Maximum ion transmission– Optimal tune over entire mass range– No lenses in analyzer• Collision cell– Long path for wide CID energy range– Curved for low noise and high sensitivity– Pre- and post-guide evacuation section• High performance detector for pos. & neg. ions– Long life
1200L <strong>LC</strong>/<strong>MS</strong>Electrospray Ionization
State-ofof-the-Art DesignFeatures with proven value for maximum performance, robustoperation and user convenience:1. Off-axis orientation of the needle and sampling capillary2. Adjustable nebulization parameters3. Full range of X-Y needle position4. Counter-flow of heated drying gas5. Wide bore sampling capillary6. Off-axis orientation of the capillary and ion guide7. High efficiency, hexapole ion guide8. Heated spray chamber with slight angle to promote drainage9. Hinged spray chamber with quick release clips10. Snap-on spray plate11. Simplified cleaning procedure for all components12. Design summaryClick on desired topic
Off-axis Spray NeedleOff-axis orientation between the sprayneedle and sampling capillaryeliminates contamination of theinterface <strong>by</strong> large droplets
Adjustable NebulizationInner NeedleAdjustmentAdjustment of the inner, liquidcapillary needle to maximizenebulization efficiency
Adjustable NebulizationLiquidNebulizingGasInner to outer needleposition is critical tonebulization efficiencyOptimum dependson liquid flow
Other Nebulization Parameters• Gas flow rate– Higher liquid flows require higher gasflows• Type of nebulization gas– Nitrogen for positive ESI application• Less than 1% oxygen– Air for some negative ESI application• Suppresses electrical discharge at highpotentials
Fully Adjustable SprayNeedleX-AdjustmentX-Y adjustment ofspray needle tooptimize sensitivityand maximizerobust operationTOP VIEW
Counter-flow Drying GasGasHeaterN 2N 2 drying gasDropletsCapillary RestrictionDrying gas blows large dropletsaway from capillary inlet
Desolvation andDeclusteringGasHeaterN 2N 2 drying gasIonsDropletsCapillary Restriction1 L/minDrying gas also promotes rapiddesolvation of droplets anddeclustering of solvent from ions
Electrospray DropletsDistribution of droplet sizesNumberUseable DropletsDesolvated and DeclusteredHigherProbabilityOf ThermalDegradationBlown Away By Drying GasDirect Away(Off-axis needle)1 micronDroplet Diameter300 micron
Wide Bore, Metal CapillaryGasHeaterN 2DropletsIonsCapillaryWide (0.4 mm) internal diametermaximizes ion transmission1 L/minStainless steel capillary reducespotential for charge buildupwhich could impede ions
Summary of ESI DesignObjectives1. Maximize Ion Formation & Transmission- High temperature gas phase desolvation of droplets- Large diameter capillary vacuum restriction - reduce space charge effects2. Minimize Noise- Metal capillary tube - no charging effects like glass- Off axis spray needle - no large droplets entering interface- Patented off axis ion guide - eliminate residual droplet noise3. Minimize Source contamination- Off axis spray needle - excess spray directed away from interface- No droplet desolvation inside capillary - no contaminants to plugvacuum restriction- Counter flow gas - blow contaminates away from interface- Large diameter vacuum restriction - more tolerant of overloading
ELECTROSPRAY IONIZATION (ESI)Mandatory: Compound of interest must be ionized in solution‣ Metallic capilaryneedle surrounded<strong>by</strong> N 2 flow to createspray‣ ESI Needle at +3to 8 kV for +ESI‣ Voltage appliedbetween probe tipand samplingcone(low eV)‣ Heating device tospeed up desolvation
<strong>LC</strong>/<strong>MS</strong>/<strong>MS</strong>-ESIACIDIC DRUGSHC, BarbituratesGC/<strong>MS</strong>Electron Impact<strong>LC</strong>/<strong>MS</strong>/<strong>MS</strong>+ ESIBASIC DRUGSAmphetamineBasic (ammonia)Aq. Solvent PhaseVolatile buffer0.1% formic acidAq. Solvent PhasVolatile buffer
For ESI need low ionic strengths of“soft ions”, i.e., OAc- & NH 4+
“ION SUPRESSION”
Chromatogram Plots
INFUSION to obtain Parent > Daughter and CE’s
- 25 % Control
+ 25% Control
Butorphanol (25 ng/mL cutoff)
Calibrator Mix: <strong>Professional</strong> <strong>Panel</strong>Ketamine 100 ng/mLMeperidine 300 ng/mLTramadol 300 ng/mLPentazocine 25 ng/mLButorphanol 25 ng/mLMeperidine-D4 IS300 ng/mL
LOQ Control
Meperidine + Urine <strong>Screen</strong>
Typical Negative <strong>Screen</strong>
Pentazocine & Butorphanol –25% C
Butorphanol +/- 25% Controls<strong>LC</strong><strong>MS</strong><strong>MS</strong> BUTORPHANOL40353025201510505/2/20055/4/20055/6/20055/8/20055/10/20055/12/20055/14/20055/16/20055/18/20055/20/20055/22/20055/24/20055/26/20055/28/20055/30/2005QC RUN #QC -QC +RATE VALUE (ng/m
140120100806040Ketamine +/- 25% Controls<strong>LC</strong><strong>MS</strong><strong>MS</strong> KETAMINE5/2/20055/4/20055/6/20055/8/20055/10/20055/12/20055/14/20055/16/20055/18/20055/20/20055/22/20055/24/20055/26/20055/28/20055/30/2005DATEQC -QC +RATE VALUE (ng/
450400350300250200150100Meperidine +/- 25% Controls<strong>LC</strong><strong>MS</strong><strong>MS</strong> MEPERIDINE5/2/20055/4/20055/6/20055/8/20055/10/20055/12/20055/14/20055/16/20055/18/20055/20/20055/22/20055/24/20055/26/20055/28/20055/30/2005DATEQC -QC +RATE VALUE (ng/m
DAY-toto-DAY PRECISION<strong>LC</strong><strong>MS</strong><strong>MS</strong> MEPERIDINEVALUES IN ng/mLDAY QC - QC + CAL ZERO QC - QC +5/2 245 381 300 0 82% 127%5/3 222 371 300 0 74% 124%5/4 229 378 300 0 76% 126%5/6 230 373 300 0 77% 124%5/9 226 372 300 0 75% 124%5/10 217 371 300 0 72% 124%5/11 228 371 300 0 76% 124%5/12 219 363 300 0 73% 121%5/13 228 378 300 0 76% 126%5/16 224 369 300 0 75% 123%5/17 222 390 300 0 74% 130%5/18 220 370 300 0 73% 123%5/19 221 374 300 0 74% 125%5/20 220 362 300 0 73% 121%5/23 217 363 300 0 72% 121%5/24 223 369 300 0 74% 123%5/25 215 361 300 0 72% 120%5/26 215 360 300 0 72% 120%5/27 223 369 300 0 74% 123%5/31 224 374 300 0 75% 125%MEAN 223.4 371.0C.V.% 3.0 2.0
450400350300250200150100Meperidine PrecisionMeperidine Precision<strong>LC</strong><strong>MS</strong><strong>MS</strong> MEPERIDINE5/2/20055/4/20055/6/20055/8/20055/10/20055/12/20055/14/20055/16/20055/18/20055/20/20055/22/20055/24/20055/26/20055/28/20055/30/2005DATEQC -QC +RATE VALUE (ng/m
Day-toto-day Precision: Ketamine<strong>LC</strong><strong>MS</strong><strong>MS</strong> KETAMINEALL VALUES IN ng/mLDAY QC - QC + CAL ZERO QC - QC +5/2 81 128 100 0 81% 128%5/3 72 114 100 0 72% 114%5/4 70 128 100 0 70% 128%5/6 79 120 100 0 79% 120%5/9 75 124 100 0 75% 124%5/10 69 119 100 0 69% 119%5/11 77 130 100 0 77% 130%5/12 74 125 100 0 74% 125%5/13 77 126 100 0 77% 126%5/16 74 120 100 0 74% 120%5/17 78 139 100 0 78% 139%5/18 71 127 100 0 71% 127%5/19 75 127 100 0 75% 127%5/20 76 123 100 0 76% 123%5/23 77 122 100 0 77% 122%5/24 70 119 100 0 70% 119%5/25 70 120 100 0 70% 120%5/26 76 123 100 0 76% 123%5/27 74 120 100 0 74% 120%5/31 72 122 100 0 72% 122%MEAN 74.4 123.8C.V.% 4.5 4.3
Pentazocine +/- 25% Controls<strong>LC</strong><strong>MS</strong><strong>MS</strong> PENTAZOCINE403530252015105/2/20055/3/20055/4/20055/5/20055/6/20055/7/20055/8/20055/9/20055/10/20055/11/20055/12/20055/13/20055/14/20055/15/20055/16/20055/17/20055/18/20055/19/20055/20/20055/21/20055/22/20055/23/20055/24/20055/25/20055/26/20055/27/20055/28/20055/29/20055/30/20055/31/2005DATEQC -QC +rate value (ng/m
Day-toto-day Precision: Pentazocine<strong>LC</strong>/<strong>MS</strong>/<strong>MS</strong> PENTAZOCINEall values in ng/mLDAY QC - QC + CAL ZERO QC - QC +5/2 18 31 25 0 72% 124%5/3 19 35 25 0 76% 140%5/4 18 31 25 0 72% 124%5/6 19 29 25 0 76% 116%5/9 19 33 25 0 76% 132%5/10 18 33 25 0 72% 132%5/11 19 34 25 0 76% 136%5/12 16 29 25 0 64% 116%5/13 18 32 25 0 72% 128%5/16 19 34 25 0 76% 136%5/17 16 30 25 0 64% 120%5/18 20 31 25 0 80% 124%5/19 18 31 25 0 72% 124%5/20 18 31 25 0 72% 124%5/23 17 31 25 0 68% 124%5/24 18 30 25 0 72% 120%5/25 18 29 25 0 72% 116%5/26 18 30 25 0 72% 120%5/27 18 30 25 0 72% 120%5/31 19 31 25 0 76% 124%MEAN 18.2 31.3C.V.% 5.4 5.6
450400350300250200150100Tramadol +/- 25% Controls<strong>LC</strong><strong>MS</strong><strong>MS</strong> TRAMADOL5/2/20055/4/20055/6/20055/8/20055/10/20055/12/20055/14/20055/16/20055/18/20055/20/20055/22/20055/24/20055/26/20055/28/20055/30/2005DATEQC -QC +RATE VALUES (ng/
Day-toto-day Precision: Tramadol<strong>LC</strong><strong>MS</strong><strong>MS</strong> TRAMADOLALL VALUES IN ng/mLDAY QC - QC + CAL ZERO QC - QC +5/2 222 352 300 0 74% 117%5/3 234 357 300 0 78% 119%5/4 214 323 300 0 71% 108%5/6 237 344 300 0 79% 115%5/9 235 362 300 0 78% 121%5/10 223 359 300 0 74% 120%5/11 226 359 300 0 75% 120%5/12 238 420 300 0 79% 140%5/13 239 382 300 0 80% 127%5/16 231 364 300 0 77% 121%5/17 222 381 300 0 74% 127%5/18 236 393 300 0 79% 131%5/19 234 379 300 0 78% 126%5/20 234 374 300 0 78% 125%5/23 222 373 300 0 74% 124%5/24 221 354 300 0 74% 118%5/25 214 359 300 0 71% 120%5/26 210 378 300 0 70% 126%5/27 241 380 300 0 80% 127%5/31 235 389 300 0 78% 130%MEAN 228.400 369.100C.V.% 4.079 5.561
Composite Precision: <strong>Professional</strong> <strong>Panel</strong>- 25% Control Precisondate sample id Ketamine MeperidineTramadol PentazocinButorphanol11/1/2004 c1 -25% 73.17 216.84 228.29 17.79 18.6911/1/2004 c1 -25% 71.41 216.52 223.14 18.00 18.4211/1/2004 c1 -25% 68.72 218.76 216.39 16.98 18.4811/1/2004 c1 -25% 72.55 214.72 218.72 17.12 18.2811/1/2004 c1 -25% 75.14 220.59 239.63 17.10 18.7111/1/2004 c1 -25% 75.36 226.73 223.93 17.14 19.0911/1/2004 c1 -25% 76.94 225.17 236.87 17.18 19.6311/1/2004 c1 -25% 75.90 220.33 231.43 16.03 18.2911/1/2004 c1 -25% 69.00 216.04 229.59 16.71 18.2011/1/2004 c1 -25% 70.79 213.29 222.31 17.09 18.3511/1/2004 c1 -25% 75.52 221.50 236.89 18.04 18.8311/1/2004 c1 -25% 74.40 219.46 223.57 16.99 18.9011/1/2004 c1 -25% 74.42 216.00 226.04 16.90 18.3211/1/2004 c1 -25% 74.70 216.62 222.47 16.58 18.6711/1/2004 c1 -25% 69.79 220.03 234.63 17.92 19.0411/1/2004 c1 -25% 72.45 218.54 228.96 18.21 18.5811/1/2004 c1 -25% 70.34 220.61 223.91 18.74 19.0111/1/2004 c1 -25% 72.36 216.04 218.56 18.03 19.4711/1/2004 c1 -25% 70.09 215.93 214.80 17.35 18.4911/1/2004 c1 -25% 73.46 225.58 221.93 17.67 18.7811/1/2004 c1 -25% 71.62 221.62 218.41 17.93 19.3111/1/2004 c1 -25% 72.40 225.16 226.23 17.69 18.98mean 72.8 219.4 225.8 17.4 18.8standard deviation 2.4 3.8 6.9 0.6 0.4%CV 3.2% 1.7% 3.1% 3.6% 2.1%mean + 2 Stdev 77.5 226.9 239.6 18.7 19.5mean - 2 Stdev 68.0 211.8 212.0 16.1 18.0target + 20% 90 270 270 22.5 22.5target - 20% 60 180 180 15 15accuracy 97.0% 97.5% 100.3% 92.9% 100.0%N = 22 22 22 22 22
Composite Precision: <strong>Professional</strong> <strong>Panel</strong>+ 25% Control Precisondate sample id Ketamine MeperidineTramadol PentazocinButorphano11/1/2004 c2 +25% 125.28 380.75 377.12 30.69 31.9611/1/2004 c2 +25% 120.80 367.35 365.17 30.04 31.4011/1/2004 c2 +25% 119.49 367.89 361.77 30.36 31.0211/1/2004 c2 +25% 127.59 371.38 351.33 29.04 30.2311/1/2004 c2 +25% 128.05 366.60 352.01 29.43 30.1211/1/2004 c2 +25% 126.94 368.68 351.96 28.62 29.4011/1/2004 c2 +25% 125.44 366.23 355.27 29.04 30.3911/1/2004 c2 +25% 122.36 367.36 363.37 29.65 31.8511/1/2004 c2 +25% 127.38 359.80 356.23 29.64 31.1011/1/2004 c2 +25% 126.29 362.32 369.91 30.21 31.9911/1/2004 c2 +25% 121.37 364.93 355.43 28.23 30.4111/1/2004 c2 +25% 132.98 365.86 391.33 28.99 31.7111/1/2004 c2 +25% 127.78 367.52 383.45 28.34 30.6111/1/2004 c2 +25% 127.12 363.25 386.97 27.98 30.7611/1/2004 c2 +25% 125.99 367.28 388.75 28.79 31.3511/1/2004 c2 +25% 123.39 363.63 378.56 29.14 30.6711/1/2004 c2 +25% 117.55 360.36 367.91 29.51 30.9511/1/2004 c2 +25% 122.81 359.67 372.55 28.60 30.6911/1/2004 c2 +25% 118.66 361.59 370.49 29.68 31.4211/1/2004 c2 +25% 120.66 354.33 373.45 29.31 31.6911/1/2004 c2 +25% 118.97 343.36 362.05 29.56 31.0011/1/2004 c2 +25% 123.02 351.60 377.96 29.45 31.2011/1/2004 c2 +25% 120.10 349.20 378.35 29.19 30.4211/1/2004 c2 +25% 129.77 353.97 379.12 28.48 30.4311/1/2004 c2 +25% 128.12 359.52 378.81 30.13 31.45mean 124.3 362.6 370.0 29.3 31.0standard deviation 4.0 7.8 12.1 0.7 0.6%CV 3.2% 2.1% 3.3% 2.4% 2.1%mean + 2 Stdev 132.3 378.1 394.2 30.7 32.3mean - 2 Stdev 116.4 347.0 345.7 27.9 29.7target + 20% 150 450 450 38.7 38.7target - 20% 100 300 300 25.8 25.8accuracy 99.5% 96.7% 98.7% 90.8% 96.0%N = 25 25 25 25 25