Dummy and Qualitative Dependent Variables
Dummy and Qualitative Dependent Variables
Dummy and Qualitative Dependent Variables
- No tags were found...

Create successful ePaper yourself
Turn your PDF publications into a flip-book with our unique Google optimized e-Paper software.
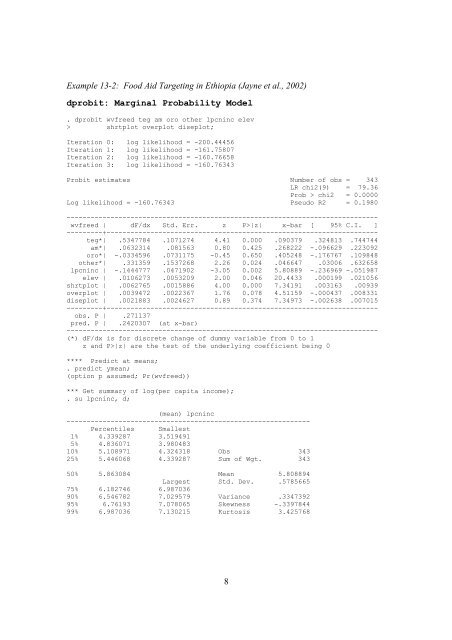
Example 13-2: Food Aid Targeting in Ethiopia (Jayne et al., 2002)dprobit: Marginal Probability Model. dprobit wvfreed teg am oro other lpcninc elev> shrtplot overplot diseplot;Iteration 0: log likelihood = -200.44456Iteration 1: log likelihood = -161.75807Iteration 2: log likelihood = -160.76658Iteration 3: log likelihood = -160.76343Probit estimates Number of obs = 343LR chi2(9) = 79.36Prob > chi2 = 0.0000Log likelihood = -160.76343 Pseudo R2 = 0.1980------------------------------------------------------------------------------wvfreed | dF/dx Std. Err. z P>|z| x-bar [ 95% C.I. ]---------+--------------------------------------------------------------------teg*| .5347784 .1071274 4.41 0.000 .090379 .324813 .744744am*| .0632314 .081563 0.80 0.425 .268222 -.096629 .223092oro*| -.0334596 .0731175 -0.45 0.650 .405248 -.176767 .109848other*| .331359 .1537268 2.26 0.024 .046647 .03006 .632658lpcninc | -.1444777 .0471902 -3.05 0.002 5.80889 -.236969 -.051987elev | .0106273 .0053209 2.00 0.046 20.4433 .000199 .021056shrtplot | .0062765 .0015886 4.00 0.000 7.34191 .003163 .00939overplot | .0039472 .0022367 1.76 0.078 4.51159 -.000437 .008331diseplot | .0021883 .0024627 0.89 0.374 7.34973 -.002638 .007015---------+--------------------------------------------------------------------obs. P | .271137pred. P | .2420307 (at x-bar)------------------------------------------------------------------------------(*) dF/dx is for discrete change of dummy variable from 0 to 1z <strong>and</strong> P>|z| are the test of the underlying coefficient being 0**** Predict at means;. predict ymean;(option p assumed; Pr(wvfreed))*** Get summary of log(per capita income);. su lpcninc, d;(mean) lpcninc-------------------------------------------------------------Percentiles Smallest1% 4.339287 3.5194915% 4.836071 3.98048310% 5.108971 4.324318 Obs 34325% 5.446068 4.339287 Sum of Wgt. 34350% 5.863084 Mean 5.808894Largest Std. Dev. .578566575% 6.182746 6.98703690% 6.546782 7.029579 Variance .334739295% 6.76193 7.078065 Skewness -.339784499% 6.987036 7.130215 Kurtosis 3.4257688