Lab 3: Diffusion and Osmosis - University of Evansville
Lab 3: Diffusion and Osmosis - University of Evansville
Lab 3: Diffusion and Osmosis - University of Evansville
You also want an ePaper? Increase the reach of your titles
YUMPU automatically turns print PDFs into web optimized ePapers that Google loves.
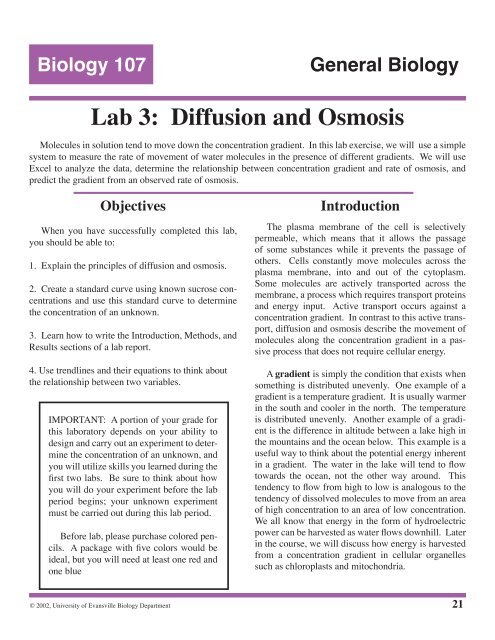
Biology 107General Biology<strong>Lab</strong> 3: <strong>Diffusion</strong> <strong>and</strong> <strong>Osmosis</strong>Molecules in solution tend to move down the concentration gradient. In this lab exercise, we will use a simplesystem to measure the rate <strong>of</strong> movement <strong>of</strong> water molecules in the presence <strong>of</strong> different gradients. We will useExcel to analyze the data, determine the relationship between concentration gradient <strong>and</strong> rate <strong>of</strong> osmosis, <strong>and</strong>predict the gradient from an observed rate <strong>of</strong> osmosis.ObjectivesWhen you have successfully completed this lab,you should be able to:1. Explain the principles <strong>of</strong> diffusion <strong>and</strong> osmosis.2. Create a st<strong>and</strong>ard curve using known sucrose concentrations<strong>and</strong> use this st<strong>and</strong>ard curve to determinethe concentration <strong>of</strong> an unknown.3. Learn how to write the Introduction, Methods, <strong>and</strong>Results sections <strong>of</strong> a lab report.4. Use trendlines <strong>and</strong> their equations to think aboutthe relationship between two variables.IMPORTANT: A portion <strong>of</strong> your grade forthis laboratory depends on your ability todesign <strong>and</strong> carry out an experiment to determinethe concentration <strong>of</strong> an unknown, <strong>and</strong>you will utilize skills you learned during thefirst two labs. Be sure to think about howyou will do your experiment before the labperiod begins; your unknown experimentmust be carried out during this lab period.Before lab, please purchase colored pencils.A package with five colors would beideal, but you will need at least one red <strong>and</strong>one blueIntroductionThe plasma membrane <strong>of</strong> the cell is selectivelypermeable, which means that it allows the passage<strong>of</strong> some substances while it prevents the passage <strong>of</strong>others. Cells constantly move molecules across theplasma membrane, into <strong>and</strong> out <strong>of</strong> the cytoplasm.Some molecules are actively transported across themembrane, a process which requires transport proteins<strong>and</strong> energy input. Active transport occurs against aconcentration gradient. In contrast to this active transport,diffusion <strong>and</strong> osmosis describe the movement <strong>of</strong>molecules along the concentration gradient in a passiveprocess that does not require cellular energy.A gradient is simply the condition that exists whensomething is distributed unevenly. One example <strong>of</strong> agradient is a temperature gradient. It is usually warmerin the south <strong>and</strong> cooler in the north. The temperatureis distributed unevenly. Another example <strong>of</strong> a gradientis the difference in altitude between a lake high inthe mountains <strong>and</strong> the ocean below. This example is auseful way to think about the potential energy inherentin a gradient. The water in the lake will tend to flowtowards the ocean, not the other way around. Thistendency to flow from high to low is analogous to thetendency <strong>of</strong> dissolved molecules to move from an area<strong>of</strong> high concentration to an area <strong>of</strong> low concentration.We all know that energy in the form <strong>of</strong> hydroelectricpower can be harvested as water flows downhill. Laterin the course, we will discuss how energy is harvestedfrom a concentration gradient in cellular organellessuch as chloroplasts <strong>and</strong> mitochondria.© 2002, <strong>University</strong> <strong>of</strong> <strong>Evansville</strong> Biology Department 21
22<strong>Diffusion</strong> is the movement <strong>of</strong> dissolved moleculesfrom a region <strong>of</strong> high concentration to a region <strong>of</strong> lowconcentration. This process tends to spread the moleculesout. Keep in mind that diffusion occurs even inthe absence <strong>of</strong> a membrane.<strong>Osmosis</strong> is the diffusion <strong>of</strong> water molecules acrossa selectively permeable membrane. Selectively permeablemembranes allow some substances, includingwater, to pass freely through the membrane, but blockthe passage <strong>of</strong> others. As in diffusion, the water moleculesmove from a solution with a higher concentration<strong>of</strong> water to a solution with a lower concentration<strong>of</strong> water.In this laboratory exercise, you will learn aboutsome <strong>of</strong> the principles <strong>of</strong> diffusion <strong>and</strong> osmosis. Alongthe way, you will design <strong>and</strong> carry out a simple experiment.The data you collect during this experimentwill, when properly analyzed <strong>and</strong> displayed, allowyou to determine the concentration <strong>of</strong> an unknownsucrose solution.ProceduresSection A - <strong>Diffusion</strong>The movement <strong>of</strong> substances across the plasmamembrane is important to the survival <strong>of</strong> the cell.Certain substances must enter the cell to serve as rawmaterials <strong>and</strong> to provide an energy source. Likewise,waste products must move out <strong>of</strong> the cell. The moleculesin liquid water are in constant motion, collidingwith each other <strong>and</strong> with molecules <strong>of</strong> dissolvedsubstances. This kinetic molecular motion allows diffusionto occur.Think about a shoebox with twenty marbles allstacked against the left side. These marbles representdissolved molecules, with a high concentration at theleft end <strong>of</strong> the box <strong>and</strong> a low (zero) concentrationelsewhere in the box. A concentration gradient exists- high at the left end <strong>of</strong> the box <strong>and</strong> low everywhereelse. Now think about shaking the box. This is wherethe constant motion <strong>of</strong> molecules comes in. Marbleswill tend to move down the concentration gradient,that is from left to right in the above example. Whenyou open the box, the marbles are r<strong>and</strong>omly distributed.The concentration <strong>of</strong> marbles has evened out,<strong>and</strong> a concentration gradient no longer exists.Temperature can affect the rate <strong>of</strong> diffusion. Tosee this, place a drop <strong>of</strong> food coloring into a smallbeaker <strong>of</strong> room temperature water. Count the number<strong>of</strong> seconds required for the dye to be evenly distributedthroughout the beaker. Now repeat the experimentusing a beaker <strong>of</strong> hot water. Allow the water toboil, remove from the heat, let st<strong>and</strong> 30 seconds, thenadd the food coloring <strong>and</strong> record the time requiredfor even distribution. Do the particles move faster orslower in the hot water? Why? (Be sure to includeyour description <strong>of</strong> this activity <strong>and</strong> answer thesequestions in your lab report.)Section B - <strong>Osmosis</strong>Like any molecule, water can be present in high orlow concentrations. While it may at first seem counterintuitiveto imagine one solution with a higher concentration<strong>of</strong> water than another solution, this actuallyhappens all the time. Think about a 5% salt solution.By weight this solution is 5% salt <strong>and</strong> 95% water.Imagine that this solution was placed across a semipermeablemembrane from a distilled (0% salt <strong>and</strong>100% water) water solution. Water molecules wouldmove down their concentration gradient from the highconcentration to the low concentration, i.e., from the100% solution to the 95% solution, but the membranewould prevent the salt molecules from moving. (SeeFigure 8.12 on page 147 in your text.)The following protocol will allow you to determinethe rate at which distilled water crosses a semipermeablemembrane enclosing a sucrose solution. Thinkabout how you would use this method to design anexperiment to determine the concentration <strong>of</strong> a sucrosesolution <strong>of</strong> unknown concentration. Remember thata rate has units such as miles per hour or grams perminute. In this experiment, you will determine therate <strong>of</strong> osmosis by determining the slope <strong>of</strong> a line.1. Each lab group should find 6 lengths <strong>of</strong> dialysistubing, each 5 inches long, at their table. Dialysistubing is a semipermeable membrane that is selectivelyporous <strong>and</strong> allows some molecules to passthrough it. You also have several beakers which youshould label using the red wax marker in your labdrawer. Do not mark glassware on the white frostedmarking area <strong>of</strong> the beaker. Marks made there withwax pencil DO NOT come <strong>of</strong>f.
232. S<strong>of</strong>ten the tubing by soaking each piece in a beaker<strong>of</strong> distilled water for a few minutes. The ends <strong>of</strong> thetubes can now be opened by rubbing them gentlybetween your fingers.3. Seal one end <strong>of</strong> the tube by folding it over <strong>and</strong>tying it <strong>of</strong>f very tightly with dental floss.4. Using a separate funnel <strong>and</strong> graduated cylinder foreach solution, pour about 20 ml <strong>of</strong> each <strong>of</strong> the followingsolutions into the open end <strong>of</strong> each separate bag:distilled water, 1% sucrose, 5% sucrose, 10% sucrose,15% sucrose <strong>and</strong> 20% sucrose. Tie <strong>of</strong>f the open end<strong>of</strong> each bag very tightly, but leave about an inch <strong>of</strong>empty tubing above the top <strong>of</strong> the solution. This extraspace is called “head space” <strong>and</strong> is essential becausewater will enter the bags during the experiment. Notethat all solutions look the same once they are in thebag. Keep careful track <strong>of</strong> which bag is which.5. Rinse the bags with distilled water, gently blot dry,<strong>and</strong> record the mass <strong>of</strong> each bag using the electronicbalance. Leaking bags will give useless data, so besure that your bag is not leaking before you start.H<strong>and</strong>le the bags carefully to ensure that you don’tdamage them in the process <strong>of</strong> blotting <strong>and</strong> weighing.Do not prepare all <strong>of</strong> your bags at once <strong>and</strong> leavethem sitting on the table top while you tie <strong>and</strong> fill therest. Fill one, tie it, weigh it <strong>and</strong> place it in distilledwater immediately. Use the same electronic balancefor each weighing.6. Immerse each bag in a beaker <strong>of</strong> distilled water.Blot <strong>and</strong> reweigh each bag every fifteen minutes foran hour. Record the masses in the table on the nextpage. As you collect your data, construct a singlegraph with scatter plots <strong>of</strong> the mass <strong>of</strong> each bag versustime. Use your colored pencils, with a different colorrepresenting each bag. Can you guess at the trendlinesfor these plots?Make sure you complete the plot, including axislabels. Answer the questions on the following page,<strong>and</strong> get your instructor’s signature before leaving thelaboratory.Later, you will graph these data in Excel <strong>and</strong> determinethe equation for each trendline. The slopes <strong>of</strong>these lines are the rate at which the water moves intothe bags. Recall that the slope <strong>of</strong> a line is the changein y divided by change in x or dy/dx or (y1-y2 / x1-x2). You should produce six lines, one for each percentage<strong>of</strong> sucrose you used.QUESTION: What should you probably be doingwith your unknown at this time?Experiment with an UnknownDesign an experiment to test the concentration <strong>of</strong>an unknown sucrose solution. Outline your experimenton a sheet <strong>of</strong> scratch paper <strong>and</strong> discuss it withyour instructor before you begin. BE CAREFUL!Show your ideas to your instructor as soon as you can.You should run your experiment at the same time asyou are running the experiment above.Record the number <strong>of</strong> your Unknown Solution here:Make sure you refer to it in your lab report.Section C - Data AnalysisAfter taking a few data points, you have probablynoticed that the mass <strong>of</strong> each <strong>of</strong> your dialysis bagstends to increase with time. Use the graph paper onthe previous page to plot the data during the experiment,<strong>and</strong> think about the following questions.1. Does the bag increase in mass at a constant rate?2. What factors might introduce uncertainty into themeasurement <strong>of</strong> this rate?3. Is the rate <strong>of</strong> mass increase related to the concentration(%) <strong>of</strong> sucrose inside the bag?4. How can you determine the rate at which waterenters each bag?5. Are these data good enough to complete yourassignment, or should all <strong>of</strong> the members <strong>of</strong> your labgroup make an appointment to repeat the exercise?
24Contents <strong>of</strong>Dialysis Bags0 % Sucrose(Distilled Water)1 % SucroseTable 1 Mass <strong>of</strong> Dialysis Bags at Timed Intervals0 minutes 15 minutes 30 minutes 45 minutes 60 minutes5 % Sucrose10 % Sucrose15 % Sucrose20 % SucroseFrom these data, what is your first estimation <strong>of</strong> the concentration <strong>of</strong> sucrose in your unknown?Are these data good enough to be sure <strong>of</strong> your unknown concentration?Obtain your instructor’s signature here after completing your graph <strong>and</strong> answering the questions.__________________________________
After leaving the laboratory, use Excel to help youexamine your osmosis data. Keep in mind that therate <strong>of</strong> osmosis means the amount <strong>of</strong> water that entersthe bag per time interval. This rate depends on theconcentration <strong>of</strong> sucrose; the higher the concentration<strong>of</strong> sucrose, the faster water enters the bag. Youcan determine the rate by finding the trendline slopeexpressed in grams per minute.Then, use the rates from the known sucrose concentrationsto graphically determine the relationshipbetween concentration <strong>of</strong> sucrose <strong>and</strong> rate <strong>of</strong> osmosis.Use this relationship to construct a st<strong>and</strong>ard curvewhich can be used to determine the percentage foryour unknown sucrose concentration.Section D - DialysisDialysis involves the selective separation <strong>of</strong> materialsby differential diffusion across a membrane. Theartificial kidney machine, used for patients whose kidneyshave impaired function, works on this principle.The patient’s blood is passed outside <strong>of</strong> the body <strong>and</strong>into a special dialysis chamber bounded by a selectivelypermeable membrane. The chamber is surroundedby a dialysis buffer. Small molecular wasteproducts pass out <strong>of</strong> the blood into the buffer, <strong>and</strong> theconcentration <strong>of</strong> waste products equilibrates acrossthe membrane. Large molecules <strong>and</strong> red blood cellsare retained in the dialysis chamber. The blood is thenreturned to the body with a reduced concentration <strong>of</strong>waste products. As an example <strong>of</strong> differential diffusion,observe the demonstration with a dialysis bagcontaining starch solution, <strong>and</strong> liquid outside the bagcontaining iodine. Iodine stains starch a dark blue.For your lab report: Note the location <strong>of</strong> the bluecolor - is it inside <strong>of</strong> the bag or outside? What gradientsare present? Which diffusion occured? Why?How did that lead to the results you saw?Section E - Reporting your ExperimentThis week, you are to write a lab report, whichwill be due at the beginning <strong>of</strong> class in two weeks.Remember, this is not creative writing. Your goal isto explain your work clearly <strong>and</strong> concisely.25There are many ways to write a scientific report,but all scientific writing has some specific rules.Reports should be organized in labeled sections: (a)Introduction, (b) Methods, (c) Results <strong>and</strong> (d) Discussion.At this point in time, you should begin writingyour Introduction <strong>and</strong> your Methods sections <strong>and</strong>begin developing the graphs for your Results section.After next week’s lab discussion on the ScientificMethod, you’ll be ready to put the finishing toucheson the first parts <strong>of</strong> your lab report <strong>and</strong> also create theDiscussion. A complete discussion <strong>of</strong> how to write asuccessful lab report can be found in the Appendix <strong>of</strong>your laboratory manual.Your introduction should, in your own words,explain the background for your experiment. Then,near the end <strong>of</strong> the introduction, explain your questionor hypothesis. You should use your textbook,your lab manual <strong>and</strong> outside sources to help you writethis section. For the diffusion <strong>and</strong> osmosis lab report,the introduction should include an explanation <strong>of</strong> theprinciples <strong>of</strong> diffusion <strong>and</strong> osmosis <strong>and</strong> how theseinfluenced your experiment. Please cite any outsidereferences in the text <strong>of</strong> your report; use the author’slast name <strong>and</strong> the page number (Smith, p 612). Thecomplete reference should be found at the end <strong>of</strong> thereport in a bibliography section. (Example: Smith,Mary. “The Bacterial Cell Wall.” J. Bacteriology 118:612.)The methods section should explain, briefly, butcompletely, how you did your experiments. Tell yourreader about your experimental design (more on thisnext week).The results section is where you report your data.This is where you place tables <strong>and</strong> graphs, alongwith written explanations <strong>of</strong> what is in them. Forthis experiment, your results section should includeyour data, slope calculations <strong>and</strong> % sucrose <strong>of</strong> theunknown solution. Be sure to include the number <strong>of</strong>the unknown solution you used.A discussion section contains interpretation <strong>of</strong>your data, explaining how it fits into the greater body<strong>of</strong> knowledge. You will hear more about the discussionsection next week.
26<strong>Lab</strong> Assignment - Exercise 3This assignment is to be h<strong>and</strong>ed in at the beginning <strong>of</strong> lab in two weeks (before your quiz).Each student must complete this assignment individually.Your lab report must be typed, doubled spaced <strong>and</strong> you must use a 12 point font. Number your pages <strong>and</strong>label each section. Do not use a title page, simply place the title <strong>of</strong> your report at the top <strong>of</strong> the first page. If youtend to have trouble with your grammar <strong>and</strong> sentence structure, please ask for assistance at the Writing Center.Keep in mind that the Writing Center will not fix your report for you, but they will help you to learn how to fixit yourself. Your lab group worked together to gather data for this experiment, which means that four <strong>of</strong> you willhave identical data. However, each person is responsible for his/her own written presentation <strong>and</strong> analysis. Thismeans each student must create graphs <strong>and</strong> tables on his or her own. Copying will not be tolerated.WHAT DOES THIS MEAN? Turning in others’ work as your own is a violation <strong>of</strong> the Honor Code, <strong>and</strong> willbe punished harshly. Two students who work together <strong>and</strong> submit identical graphs <strong>and</strong> tables are BOTH cheating.To ensure that students are turning in original work, all text materials from this assignment must be submittedelectronically to www.turnitin.com. This procedure usually takes five to ten minutes <strong>and</strong> you must have accessto the internet. Your assignment will not be graded, <strong>and</strong> may be counted late until we receive your originalityreport.1. Point your web browser to http://www.turnitin.com/2. Click on User Login, <strong>and</strong> then click on New User (unless you already have an account at turnitin.com).3. Enter your UE email address <strong>and</strong> choose a password. Remember your password. You will need it. Click thenext button to enter your name <strong>and</strong> address. When you are finished, return to the login page <strong>and</strong> login as a student.You only need to register once. From now on, just login as a student.4. Click on join new class. Join Biology 107. The course ID is 35037, <strong>and</strong> the enrollment password is mitosis.You only need to join Biology 107 once. From now on, just click on your Biology 107 link.5. To submit a paper, click on the turn it in! button. Select an assigmnent (in this case, choose <strong>Diffusion</strong> <strong>and</strong><strong>Osmosis</strong>). Paste all <strong>of</strong> your text for this assigmnent into the text box. You do not need to submit graphs or tables- they disappear when you paste. Press submit, <strong>and</strong> you are done.Let’s recap what is due in two weeks:1. Your osmosis lab report with Introduction, Methods <strong>and</strong> Results <strong>and</strong> Discussion sections, in your portfolio,complete with corrected quizzes..In the Results section, you must indicate which unknownsolution you used <strong>and</strong> its calculated percent sucrose.2. A description <strong>of</strong> the temperature experiment (page 22). What happened <strong>and</strong> what does it mean?3. A description <strong>of</strong> the dialysis demonstration, which should include answers to the questions on page 25.4. Answers to the four questions on the following page.5. All text for this assignmnet submitted to www.turnitin.com on the day you h<strong>and</strong> in the material in class.
Questions:271. After the Punic Wars, Roman general Scipio Aemilianus scattered salt over the fields <strong>of</strong> his defeated enemy,Carthage, so that no plants would grow there. Would this really work? What does this have to do with diffusion<strong>and</strong> osmosis? Complete answers require more than one or two sentences.2. Imagine starting with equal concentrations <strong>of</strong> sucrose on both sides <strong>of</strong> a membrane. Would the construction <strong>of</strong>a sucrose gradient be endergonic or exergonic? How does this compare to the role <strong>of</strong> gradients <strong>and</strong> energy in theprocess <strong>of</strong> oxidative phosphorylation (text Chapter 9)?3. What would happen if human cells were to come into direct contact with distilled water? Is this what happenedwhen your skin contacted the distilled water during this experiment? Why or why not?4. You used a straight line to determine your rate <strong>of</strong> osmosis. Why? Would this linear relationship between mass<strong>and</strong> time continue over long periods <strong>of</strong> time? Why or why not? Include in your answer a sketch <strong>of</strong> the relationship<strong>of</strong> mass <strong>and</strong> time over long time periods.Before you turn in your assignment, go back <strong>and</strong> re-read your instructions - have you forgotten anything? Doesyour report include a sentence like “The concentration <strong>of</strong> unknown #___ is ___%”? Have you made every effortto ensure that your concentration is accurate?Have you labeled, titled <strong>and</strong> properly assembled your portfolio? See page 2 <strong>of</strong> the syllabus for portfolio instructions.Make sure your corrected quizzes are present in your portfolio.Did you use the Appendix material <strong>and</strong> sample evaluation sheets to help you write your report?Did you run the spell checker on your text AND have you pro<strong>of</strong> read it before printing your final copy?Did you number your pages <strong>and</strong> place your name at the beginning <strong>of</strong> the paper?Have you submitted all text material for this assignment to www.turnitin.com?Do you underst<strong>and</strong> what osmosis means? Could you explain diffusion to an accounting major who lives nextdoor to you in the dormitory? Could you explain it on a quiz?Now you are ready to turn in your portfolio. It is due when lab begins, before your quiz.


