Lab 3: Diffusion and Osmosis - University of Evansville
Lab 3: Diffusion and Osmosis - University of Evansville
Lab 3: Diffusion and Osmosis - University of Evansville
You also want an ePaper? Increase the reach of your titles
YUMPU automatically turns print PDFs into web optimized ePapers that Google loves.
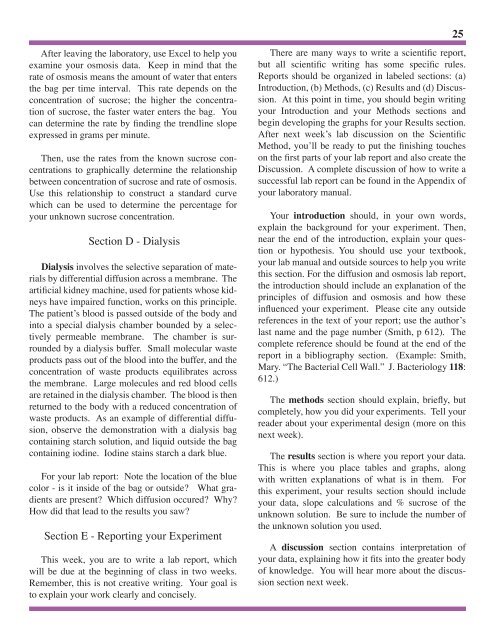
After leaving the laboratory, use Excel to help youexamine your osmosis data. Keep in mind that therate <strong>of</strong> osmosis means the amount <strong>of</strong> water that entersthe bag per time interval. This rate depends on theconcentration <strong>of</strong> sucrose; the higher the concentration<strong>of</strong> sucrose, the faster water enters the bag. Youcan determine the rate by finding the trendline slopeexpressed in grams per minute.Then, use the rates from the known sucrose concentrationsto graphically determine the relationshipbetween concentration <strong>of</strong> sucrose <strong>and</strong> rate <strong>of</strong> osmosis.Use this relationship to construct a st<strong>and</strong>ard curvewhich can be used to determine the percentage foryour unknown sucrose concentration.Section D - DialysisDialysis involves the selective separation <strong>of</strong> materialsby differential diffusion across a membrane. Theartificial kidney machine, used for patients whose kidneyshave impaired function, works on this principle.The patient’s blood is passed outside <strong>of</strong> the body <strong>and</strong>into a special dialysis chamber bounded by a selectivelypermeable membrane. The chamber is surroundedby a dialysis buffer. Small molecular wasteproducts pass out <strong>of</strong> the blood into the buffer, <strong>and</strong> theconcentration <strong>of</strong> waste products equilibrates acrossthe membrane. Large molecules <strong>and</strong> red blood cellsare retained in the dialysis chamber. The blood is thenreturned to the body with a reduced concentration <strong>of</strong>waste products. As an example <strong>of</strong> differential diffusion,observe the demonstration with a dialysis bagcontaining starch solution, <strong>and</strong> liquid outside the bagcontaining iodine. Iodine stains starch a dark blue.For your lab report: Note the location <strong>of</strong> the bluecolor - is it inside <strong>of</strong> the bag or outside? What gradientsare present? Which diffusion occured? Why?How did that lead to the results you saw?Section E - Reporting your ExperimentThis week, you are to write a lab report, whichwill be due at the beginning <strong>of</strong> class in two weeks.Remember, this is not creative writing. Your goal isto explain your work clearly <strong>and</strong> concisely.25There are many ways to write a scientific report,but all scientific writing has some specific rules.Reports should be organized in labeled sections: (a)Introduction, (b) Methods, (c) Results <strong>and</strong> (d) Discussion.At this point in time, you should begin writingyour Introduction <strong>and</strong> your Methods sections <strong>and</strong>begin developing the graphs for your Results section.After next week’s lab discussion on the ScientificMethod, you’ll be ready to put the finishing toucheson the first parts <strong>of</strong> your lab report <strong>and</strong> also create theDiscussion. A complete discussion <strong>of</strong> how to write asuccessful lab report can be found in the Appendix <strong>of</strong>your laboratory manual.Your introduction should, in your own words,explain the background for your experiment. Then,near the end <strong>of</strong> the introduction, explain your questionor hypothesis. You should use your textbook,your lab manual <strong>and</strong> outside sources to help you writethis section. For the diffusion <strong>and</strong> osmosis lab report,the introduction should include an explanation <strong>of</strong> theprinciples <strong>of</strong> diffusion <strong>and</strong> osmosis <strong>and</strong> how theseinfluenced your experiment. Please cite any outsidereferences in the text <strong>of</strong> your report; use the author’slast name <strong>and</strong> the page number (Smith, p 612). Thecomplete reference should be found at the end <strong>of</strong> thereport in a bibliography section. (Example: Smith,Mary. “The Bacterial Cell Wall.” J. Bacteriology 118:612.)The methods section should explain, briefly, butcompletely, how you did your experiments. Tell yourreader about your experimental design (more on thisnext week).The results section is where you report your data.This is where you place tables <strong>and</strong> graphs, alongwith written explanations <strong>of</strong> what is in them. Forthis experiment, your results section should includeyour data, slope calculations <strong>and</strong> % sucrose <strong>of</strong> theunknown solution. Be sure to include the number <strong>of</strong>the unknown solution you used.A discussion section contains interpretation <strong>of</strong>your data, explaining how it fits into the greater body<strong>of</strong> knowledge. You will hear more about the discussionsection next week.


