Ice Core Tomography with Laser Ultrasonics - Colorado School of ...
Ice Core Tomography with Laser Ultrasonics - Colorado School of ...
Ice Core Tomography with Laser Ultrasonics - Colorado School of ...

Create successful ePaper yourself
Turn your PDF publications into a flip-book with our unique Google optimized e-Paper software.
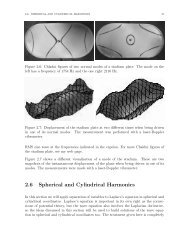
MIKESELL ET AL.: ICE CORE TOMOGRAPHY X - 33. ResultsFirst results are taken on man-made ice cores. This manufacturedtest core is composed <strong>of</strong> a pure ice section anda sand/ice mixture section. In the sand/ice section, it isunknown how close the sand grains are to each other. Thegrains are placed in the column while the water is still inliquid form. Figure 4 shows the reproducibility <strong>of</strong> the tomographicmeasurement: three transmission measurements<strong>with</strong> the source and receiver in the same position, are takenover a span <strong>of</strong> two hours while leaving the ice in the coldchamber. This particular experiment is performed in thepure-ice section <strong>of</strong> the core. The similarity <strong>of</strong> the wave formsshow that the source laser and the cold chamber have no significanteffect on the elastic wave propagation in the sample:the first arrival time and phases match trace for trace, evenat late times. Maybe more surprisingly, the source laser doesnot visually damage the face <strong>of</strong> the core, either.Figure 5 is a comparison <strong>of</strong> the wave forms in the pureice and sand/ice mixture. The overall signatures <strong>of</strong> the wavefields vary in terms <strong>of</strong> frequency content and amplitude, becausethe thermoelastic expansion <strong>of</strong> the ice/sand mixturetime (ms)00.010.020.030.04Figure 5. Wave fields excited and detected in ice (left)and a sand/ice mixture (right) show that the speed <strong>of</strong>the elastic waves, frequency content and amplitude varysignificantly for these two samples.time (ms)00.030.050.08distance (mm)50 100 150 200 250Figure 6. Top panel contains the individual wave fieldsalong a 25 cm ice core from Antarctica. The gray scalebar is our interpretation <strong>of</strong> layering. After these recordingsand interpretation was made, layers in the ice wereobserved visually and are indicated by the arrows. Notethat not only the variations in the first arrival time matchthe layers, but that the entire wave field characteristicsare different from layer to layer.is quite different than that <strong>of</strong> the pure ice. The figure alsoshows that the sand/ice mixture has a later arrival time forthe first (P-)wave than does the pure ice section. Similarslowing effects have been observed for elastic waves whenice contains a large amount <strong>of</strong> salt, diminishing the totalYoung’s modulus [Rajan et al., 1993].An ultrasonic tomogram <strong>of</strong> a 250-mm long ice core froma depth <strong>of</strong> 124 m below the ice surface at the South Pole,Antarctica is shown in Figure 6. Overall, this section <strong>of</strong>core contains layers that cannot be easily identified visually.At first glance, this core looks homogeneous throughout<strong>with</strong> a very constant grain size and color. The transmissionmeasurements are taken every 5 mm along the core, and thedata is bandpass filtered between 20 and 50 kHz. It is seen inthis plot that the average arrival times for P-waves is around12 µs. With the ice core having an approximate width <strong>of</strong>3.9 cm in the location where the transmission measurementis made, the resulting apparent velocity is 3250 m/s. Thisis well <strong>with</strong>in the range <strong>of</strong> acoustic velocities expected [e.g.,Gagnon et al., 1990]. We see variations up to a magnitude<strong>of</strong> 5 µs in first arrival time along the core. This implies smalldifferences in the elastic properties, as expected from annuallayering. In addition, larger variations in the wave forms occurat later times: while the first 70 mm <strong>of</strong> the core presentsstrong scattering or resonances, between 70 and 110 mm thecore only shows a clean first arrival. This alternating patternpersists in the rest <strong>of</strong> the core. Since waves arriving at latertimes have effectively sampled more <strong>of</strong> the core, variationsin the late-time wave forms are enhanced [Snieder et al.,2002]. Alternatively, the larger variations can be the result<strong>of</strong> different thermoelastic response <strong>of</strong> individual layers to ourlaser source. In either case, characteristics <strong>of</strong> the first-arrivaltime and overall wave forms are consistent in five distinctiveregions <strong>of</strong> the core. These regions are depicted in Figure 6<strong>with</strong> the gray scale bar. After this interpretation, a morecareful visual inspection <strong>of</strong> the core confirms three <strong>of</strong> thetransitions between layers. These transition layers are seenat 4 cm, 11 cm, and 21 cm and annotated <strong>with</strong> the blackarrows. A change in wave form is easily seen in Figure 6at 11 cm and 21 cm while the transition at 4 cm is harderto decipher from the wave forms. On the other hand, distinctchanges in the waveforms at 7 and 18 cm cannot beconfirmed visually. However, these layerings correlate wellto what is known about overall layering thicknesses at thisdepth in this area <strong>of</strong> Antarctica. This suggests that ourmethod can complement a visual inspection.4. Conclusions and discussionWith a relatively simple data acquisition system, we areable to detect annual layering in ice cores, using noncontactinglaser ultrasonics. This method explores small variationsin the elastic parameters caused by annual layeringin the ice. This method is nondestructive, and can readilycontribute to existing dating methods, and further studies<strong>with</strong> laser ultrasonics might provide other pieces <strong>of</strong> informationfor ice core research, such as contamination and (shear)strength <strong>of</strong> the ice. The latter could more easily be obtainedby measuring the horizontal components <strong>of</strong> the wave field[Fukushima et al., 2003] in future experiments. The nextgeneration system will include a cold chamber that will beable to hold cores <strong>of</strong> the standard borehole dimensions (7.5-12 cm diameter x 1 m length). The cold chamber we usehere is smaller than normal cores, so the sample must be cutdown prior to being placed in the cold chamber. This cuttingresults in alteration <strong>of</strong> the core, affecting further testingby other methods. A computer automated translation stagefor the cold chamber will allow for sub-mm precise movement<strong>of</strong> the core and thus higher spatial resolution for thetomographic measurement. Finally, a more powerful laser
X - 4MIKESELL ET AL.: ICE CORE TOMOGRAPHYdetector will not need the reflective beads for good signalquality, increasing overall speed and accuracy <strong>of</strong> the experiment.With this new system in place, we will be able tomap elastic properties <strong>of</strong> entire sections <strong>of</strong> standard ice core<strong>with</strong> sub-mm resolution in a matter <strong>of</strong> minutes.Gow et al. [1997] briefly discuss the effect <strong>of</strong> hydrostaticcompression on core density. Compaction from the overburdencould act to smooth the density contrast <strong>of</strong> small icelayers as the core is buried deeper over time. In this instance,the tomography may be unable to aid in the datingprocess. However, depending on where the equalization <strong>of</strong>the air bubble pressures and overburden meet the tomographymethod may be adequate. In the GISP2 core this e-qualization pressure was reached at 300 m [Gow et al., 1997].According to Weertman [1968], if the core was buried at aslow enough rate coalescence <strong>of</strong> bubbles will not occur andthe bubble concentration remains constant. If this were thecase, at depths reached after the equalization we could assumethat the tomography method measures accurately thewavefield affected by bubbles and density.Another affect <strong>of</strong> compression is the realigning <strong>of</strong> the crystalfabric (e.g., crystal alignment and c-axis orientation).Gow et al. [1997] studied the crystal fabric to determinehow ice had responded to changes in stress fields over time.With our tomography method we create a technique thatrapidly characterizes the velocity field and the thus givesclues to paleostresses through the relation <strong>of</strong> elastic wavevelocity to c-axis alignment. This could be an interestingtool when considering paleoloading <strong>of</strong> the ice core. The tomographydata could aid in backing out the total thickness<strong>of</strong> the ice during a certain point in time, which might proveuseful in areas where ice is melting and paleothicknesses arecurrently unknown.Acknowledgments. We thank Marcus Fauth for all his timeand effort in the construction the cold chamber system, Dave Fidelmanfor his help in designing the cold chamber system, andJohn Scales and Mike Batzle for helpful discussions. KvW is supportedby the National Science Foundation (EAR-0337379) andthe Army Research Office (DAAD19-03-1-0292).Notes1. Personal communication <strong>of</strong> AVK <strong>with</strong> Todd Sowers in 2006.ReferencesAlley, R. B., E. S. Saltzman, K. M. Cuffey, and J. J. Fitzpatrick(1990), Summertime formation <strong>of</strong> depth hoar in central Greenland,Geophys. Res. Lett., 17 (13), 2393–2396.Alley, R. B., et al. (1997), Visual stratigraphic dating <strong>of</strong> the GIS-P2 ice core: Basis, reproducability and application, J. Geophys.Res. Oceans Atmos., 102 (C12), 26,367–26,381.Boas, D. A., L. E. Campbell, and A. G. Yodh (1995), Scatteringand imaging <strong>with</strong> diffusing temporal field correlations, PhysicalReview Letters, 75, 1855–1858.Dixon, D., P. A. Mayewski, S. Kaspari, K. Kreutz, G. Hamilton,K. Maasch, S. Sneed, and M. Handley (2004), A 200-year sulfaterecord a from 16 Antarctic ice cores and associations <strong>with</strong>Southern Ocean sea ice extent, Ann. Glaciol., 39, 545–556.Donarummo Jr., J., M. Ram, and E. F. Stoermer (2003), Possibledeposit <strong>of</strong> soil dust from the 1930’s U.S. dustbowl identified inGreenland ice, Geophys. Res. Lett., 30, 2–1–2–4.Fukushima, Y., O. Nishizawa, H. Sato, and M. Ohtake (2003),Laboratory study on scattering characteristics <strong>of</strong> shear wavesin rock samples, Bulletin <strong>of</strong> the Seismological Society <strong>of</strong> America,93 (1), 253–263.Gagnon, R. E., H. Kiefte, and M. J. Clouter (1990), Acousticvelocities and densities <strong>of</strong> polycrystalline ice ih,ii,iii,v, and viby brillouin spectroscopy, Journal <strong>of</strong> Chemical Physics, 92,1909–1914.Gow, A. J., D. A. Meese, R. B. Alley, J. J. Fitzpatrick, S. Anandakrishnan,G. A. Woods, and B. C. Elder (1997), Physicaland structural properties <strong>of</strong> the Greenland <strong>Ice</strong> Sheet Project 2ice core: A review, J. Geophys. Res., 102 (C12), 26,559–26,575.Hammer, C. U. (1980), Acidity <strong>of</strong> polar ice cores in relation toabsolute dating, past volcanism, and radio-echoes, J. Glaciol.,25, 359–372.Hammer, C. U. (1983), Initial direct current in the build up <strong>of</strong>space charges and the acidity <strong>of</strong> ice cores, J. Physical Chemistry,87 (21), 4099–4103.Levshin, A. L., T. B. Yanovskaya, A. V. Lander, B. G. Bukchin,M. P. Barmin, L. I. Ratnikova, and E. N. Its (1989), SeismicSurface Waves in Laterally Inhomogeneous Earth, KluwerPubl.Meese, D. A., A. J. Gow, R. B. Alley, G. A. Zielinski, P. M.Grootes, M. Ram, K. C. Taylor, P. A. Mayewski, and J. F.Bolzan (1997), The Greenland ice sheet project 2 depth-agescale: Methods and results, Geophys. Res. Lett., 102, 26,411–26,423.Nishizawa, O., T. Satoh, X. Lei, and Y. Kuwahara (1997), Laboratorystudies <strong>of</strong> seismic wave propagation in inhomogeneousmedia using a laser Doppler vibrometer, Bulletin <strong>of</strong> the SeismologySociety <strong>of</strong> America, 87 (4), 809–823.Pouet, B. F., and N. J. P. Rasol<strong>of</strong>osaon (1993), Measurement<strong>of</strong> broadband intrinsic ultrasonic attenuation and dispersionin solids <strong>with</strong> laser techniques, The Journal <strong>of</strong> the AcousticalSociety <strong>of</strong> America, 93 (3), 1286–1292.Rajan, S. D., G. V. Frisk, J. A. Doutt, and C. J. Sellers (1993),Determination <strong>of</strong> compressional wave and shear wave speedpr<strong>of</strong>iles in sea ice by crosshole tomography— Theory and experiment,The Journal <strong>of</strong> the Acoustical Society <strong>of</strong> America,93 (2), 721–738.Ram, M., and M. Illing (1994), Polar ice stratigraphy from laserlightscattering: Scattering from meltwater, Jour. Glaciol., 40,504–508.Scales, J. A., and A. E. Malcolm (2003), <strong>Laser</strong> characterization<strong>of</strong> ultrasonic wave propagation in random media, Physical Review,67, 046,618–1–046,618–7.Scales, J. A., and K. van Wijk (1999), Multiple scattering attenuationand anisotropy <strong>of</strong> ultrasonic surface waves, App. Phys.Lett., 74, 3899–3901.Scruby, C. B., and L. E. Drain (1990), <strong>Laser</strong> <strong>Ultrasonics</strong>: Techniquesand Applications, Adam Hilger.Snieder, R., A. Grêt, H. Douma, and J. A. Scales (2002), Codawave interferometry for estimating nonlinear behavior inseismic velocity, Science, 295, 2253–2255.Taylor, K., et al. (2004), Dating the Siple Dome (Antarctica) icecore by manual and computer interpretation <strong>of</strong> annual layering,J. Glaciol., 50 (170), 453–461.Taylor, K. C., R. B. Alley, J. Fiacco, P. M. Grootes, G. Lamorey,P. A. Mayewski, and M. J. Spencer (1992), <strong>Ice</strong>-core datingand chemistry by direct-current electrical conductivity, Jour.Glaciol., 38, 325–332.Taylor, K. C., et al. (1993), Electrical conductivity measurementsfrom the GISP2 and GRIP Greenland ice cores, Nature, 366,549–552.van Wijk, K., J. A. Scales, T. D. Mikesell, and J. R. Peacock(2005), Toward noncontacting seismology, Geophys. Res. Lett.,32, 1–4.Weertman, J. (1968), Bubble coalesence in ice as a tool for thestudy <strong>of</strong> its deformation history, Jour. Glaciol., 7 (50), 155–159.T. Dylan Mikesell, Physical Acoustics Laboratory, Department<strong>of</strong> Geophysics, 1500 Illinois St., Golden, CO 80401 (tmikesel@mines.edu)