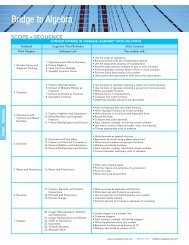
GEORGIA MATHEMATICS 1 - Carnegie Learning
GEORGIA MATHEMATICS 1 - Carnegie Learning
GEORGIA MATHEMATICS 1 - Carnegie Learning

Create successful ePaper yourself
Turn your PDF publications into a flip-book with our unique Google optimized e-Paper software.
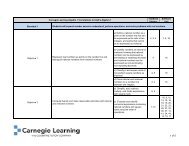
Post-Test PAGE 26. Create a graph of the quadratic function in Question 5 on the grid below. First chooseyour bounds and intervals. Be sure to label your graph clearly.Answers may vary. A sample answer has been provided below.Variable quantity Lower bound Upper bound Intervalxy–9 9 1–4 14 1y13121131098761y = x9254321−8 −7 −6 −5 −4 −3 −2 −1 O 1 2 3 4 5 6 7 8−1−2−37. Identify the domain and range of the quadratic function that you graphed in Question 6.The domain is all real numbers, and the range is all positive real numbers.x© 2008 <strong>Carnegie</strong> <strong>Learning</strong>, Inc.230 Chapter 3 ■ Assessments Georgia Mathematics 1