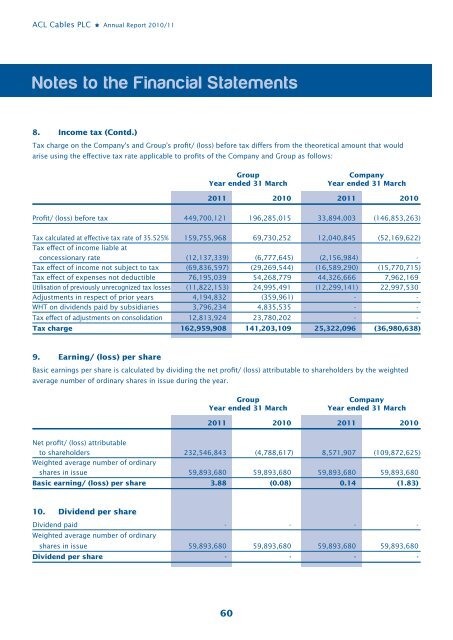
<strong>ACL</strong> <strong>Cables</strong> <strong>PLC</strong> <strong>Annual</strong> <strong>Report</strong> 20<strong>10</strong>/<strong>11</strong>Notes to the Financial Statements8. Income tax (Contd.) arise using the effective tax rate applicable to profits of the Company and Group as follows:GroupYear ended 31 MarchCompanyYear ended 31 March20<strong>11</strong> 20<strong>10</strong> 20<strong>11</strong> 20<strong>10</strong>Profit/ (loss) before tax 449,700,121 196,285,015 33,894,003 (146,853,263)Tax calculated at effective tax rate of 35.525% 159,755,968 69,730,252 12,040,845 (52,169,622)Tax effect of income liable atconcessionary rate (12,137,339) (6,777,645) (2,156,984) -Tax effect of income not subject to tax (69,836,597) (29,269,544) (16,589,290) (15,770,715)Tax effect of expenses not deductible 76,195,039 54,268,779 44,326,666 7,962,169Utilisation of previously unrecognized tax losses (<strong>11</strong>,822,153) 24,995,491 (12,299,141) 22,997,530Adjustments in respect of prior years 4,194,832 (359,961) - -WHT on dividends paid by subsidiaries 3,796,234 4,835,535 - -Tax effect of adjustments on consolidation 12,813,924 23,780,202 - -Tax charge 162,959,908 141,203,<strong>10</strong>9 25,322,096 (36,980,638)9. Earning/ (loss) per shareBasic earnings per share is calculated by dividing the net profit/ (loss) attributable to shareholders by the weightedaverage number of ordinary shares in issue during the year.GroupYear ended 31 MarchCompanyYear ended 31 March20<strong>11</strong> 20<strong>10</strong> 20<strong>11</strong> 20<strong>10</strong>Net profit/ (loss) attributableto shareholders 232,546,843 (4,788,617) 8,571,907 (<strong>10</strong>9,872,625)Weighted average number of ordinaryshares in issue 59,893,680 59,893,680 59,893,680 59,893,680Basic earning/ (loss) per share 3.88 (0.08) 0.14 (1.83)<strong>10</strong>. Dividend per shareDividend paid - - - -Weighted average number of ordinaryshares in issue 59,893,680 59,893,680 59,893,680 59,893,680Dividend per share - - - -60
<strong>ACL</strong> <strong>Cables</strong> <strong>PLC</strong> <strong>Annual</strong> <strong>Report</strong> 20<strong>10</strong>/<strong>11</strong><strong>11</strong>. Property, plant and equipment(a) GroupFurniture, fittingsLand and Plant, machinery Equipment, tools and office Motorbuildings and accessories and implements equipment vehicles TotalAt 31 March 2009Cost / valuation 1,090,542,294 1,271,215,207 95,244,558 88,374,906 71,3<strong>11</strong>,513 2,616,688,478Accumulated depreciation (58,021,050) (876,467,255) (56,539,262) (58,631,3<strong>10</strong>) (47,205,365) (1,096,864,242)Net book amount 1,032,521,244 394,747,952 38,705,296 29,743,596 24,<strong>10</strong>6,148 1,519,824,236Year ended 31 March 20<strong>10</strong>Opening net book amount 1,032,521,244 394,747,952 38,705,296 29,743,596 24,<strong>10</strong>6,148 1,519,824,236Additions 986,243 49,281,626 4,486,069 2,934,283 3,796,339 61,484,560Revaluation surplus 367,340,918 - - - - 367,340,918Disposal - cost - - (156,522) - - (156,522)- depreciation - - 156,522 - - 156,522Transfer from WIP (Note 12) 790,748 26,334,336 - - - 27,125,084Depreciation charge (Note 5) (23,695,<strong>11</strong>9) (73,247,908) (5,348,095) (<strong>10</strong>,042,879) (8,776,336) (121,1<strong>10</strong>,337)Closing net book amount 1,377,944,034 397,<strong>11</strong>6,006 37,843,270 22,635,000 19,126,151 1,854,664,461At 31 March 20<strong>10</strong>Cost / valuation 1,459,660,203 1,346,831,169 99,574,<strong>10</strong>5 91,309,189 75,<strong>10</strong>7,852 3,072,482,518Accumulated depreciation (81,716,169) (949,715,163) (61,730,835) (68,674,189) (55,981,701) (1,217,818,057)Net book amount 1,377,944,034 397,<strong>11</strong>6,006 37,843,270 22,635,000 19,126,151 1,854,664,461Year ended 31 March 20<strong>11</strong>Opening net book amount 1,377,944,034 397,<strong>11</strong>6,006 37,843,270 22,635,000 19,126,151 1,854,664,461Additions 61,727,985 34,148,962 3,621,057 9,434,259 424,<strong>10</strong>6 <strong>10</strong>9,356,369Revaluation surplus 71,762,099 - - - - 71,762,099Transfer from WIP (Note 12) - 25,408,6<strong>11</strong> - - - 25,408,6<strong>11</strong>Disposal - cost - - - - (2,0<strong>10</strong>,678) (2,0<strong>10</strong>,678)- depreciation - - - - 2,0<strong>10</strong>,678 2,0<strong>10</strong>,678Depreciation charge (note 05) (25,269,586) (72,587,543) (2,570,607) (8,544,401) (8,625,282) (<strong>11</strong>7,597,420)Closing net book amount 1,486,164,532 384,086,035 38,893,721 23,524,858 <strong>10</strong>,924,975 1,943,594,120At 31 March 20<strong>11</strong>Cost / valuation 1,593,150,287 1,406,388,742 <strong>10</strong>3,195,162 <strong>10</strong>0,743,448 73,521,280 3,276,998,919Accumulated depreciation (<strong>10</strong>6,985,755) (1,022,302,706) (64,301,442) (77,218,590) (62,596,305) (1,333,404,799)Net book amount 1,486,164,532 384,086,035 38,893,721 23,524,858 <strong>10</strong>,924,975 1,943,594,12061