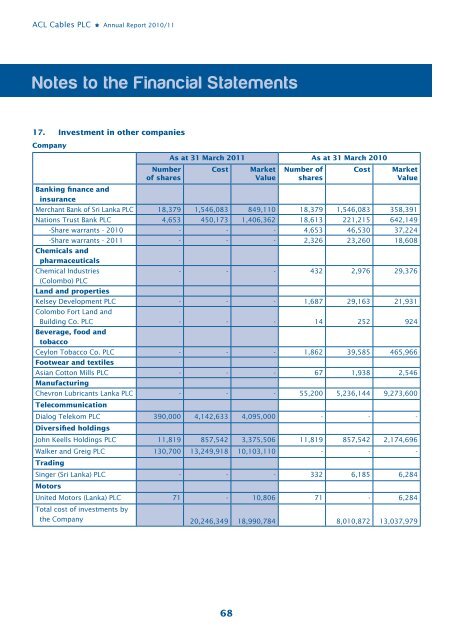
<strong>ACL</strong> <strong>Cables</strong> <strong>PLC</strong> <strong>Annual</strong> <strong>Report</strong> 20<strong>10</strong>/<strong>11</strong>Notes to the Financial Statements17. Investment in other companiesCompanyNumberof sharesAs at 31 March 20<strong>11</strong> As at 31 March 20<strong>10</strong>CostMarketValueNumber ofsharesCostMarketValueBanking finance andinsuranceMerchant Bank of Sri Lanka <strong>PLC</strong> 18,379 1,546,083 849,1<strong>10</strong> 18,379 1,546,083 358,391Nations Trust Bank <strong>PLC</strong> 4,653 450,173 1,406,362 18,613 221,215 642,149-Share warrants - 20<strong>10</strong> - - - 4,653 46,530 37,224-Share warrants - 20<strong>11</strong> - - - 2,326 23,260 18,608Chemicals andpharmaceuticalsChemical Industries- - - 432 2,976 29,376(Colombo) <strong>PLC</strong>Land and propertiesKelsey Development <strong>PLC</strong> - - - 1,687 29,163 21,931Colombo Fort Land andBuilding Co. <strong>PLC</strong> - - - 14 252 924Beverage, food andtobaccoCeylon Tobacco Co. <strong>PLC</strong> - - - 1,862 39,585 465,966Footwear and textilesAsian Cotton Mills <strong>PLC</strong> - - - 67 1,938 2,546ManufacturingChevron Lubricants Lanka <strong>PLC</strong> - - - 55,200 5,236,144 9,273,600TelecommunicationDialog Telekom <strong>PLC</strong> 390,000 4,142,633 4,095,000 - - -Diversified holdingsJohn Keells Holdings <strong>PLC</strong> <strong>11</strong>,819 857,542 3,375,506 <strong>11</strong>,819 857,542 2,174,696Walker and Greig <strong>PLC</strong> 130,700 13,249,918 <strong>10</strong>,<strong>10</strong>3,1<strong>10</strong> - - -TradingSinger (Sri Lanka) <strong>PLC</strong> - - - 332 6,185 6,284MotorsUnited Motors (Lanka) <strong>PLC</strong> 71 - <strong>10</strong>,806 71 - 6,284Total cost of investments bythe Company 20,246,349 18,990,784 8,0<strong>10</strong>,872 13,037,97968
<strong>ACL</strong> <strong>Cables</strong> <strong>PLC</strong> <strong>Annual</strong> <strong>Report</strong> 20<strong>10</strong>/<strong>11</strong>17. Investment in other companies (Contd.)Investments by subsidiary companiesNumberof sharesAs at 31 March 20<strong>11</strong> As at 31 March 20<strong>10</strong>CostMarketValueNumber ofof sharesCostMarketValueBanking, finance andinsuranceNDB Bank <strong>PLC</strong> - - - 22,500 4,005,229 4,725,000Asia Capital <strong>PLC</strong> - - - 20,000 294,<strong>11</strong>2 260,000Nations Trust Bank <strong>PLC</strong> 25,592 512,005 1,952,670 23,266 407,335 814,3<strong>10</strong>- Share warrants - 20<strong>11</strong> - - - 2,326 23,260 81,4<strong>10</strong>DFCC Bank <strong>PLC</strong> 13 2,300 2,233 13 2,000 2,346PlantationMaskeliya Plantations <strong>PLC</strong> 8,200 374,258 230,420 8,200 374,258 243,950Watawala Plantations <strong>PLC</strong> 20,000 1,252,041 500,000 20,000 1,252,041 3,520,000Hapugastenna Plantations <strong>PLC</strong> - - - 5,000 233,275 190,000Kegalle Plantations <strong>PLC</strong> - - - 20,000 1,014,000 940,000Kotagala Plantations <strong>PLC</strong> <strong>10</strong>,000 476,580 1,680,000 <strong>10</strong>,000 476,580 447,500Diversified holdingsHayleys <strong>PLC</strong> 38,907 2,952,614 14,866,365 96,268 7,305,684 21,660,300Total cost of investments bysubsidiaries 5,569,798 19,231,688 15,387,774 32,884,816Total cost of investmentby Group 25,816,147 38,222,473 23,398,646 45,922,79318. InventoriesGroupAs at 31 MarchCompanyAs at 31 March20<strong>11</strong> 20<strong>10</strong> 20<strong>11</strong> 20<strong>10</strong>Raw materials 1,130,219,3<strong>11</strong> 734,693,742 783,833,295 500,269,937Work-in-progress 685,720,660 519,956,056 431,191,229 256,232,439Finished goods 1,325,414,628 1,279,377,259 724,879,432 717,963,243Goods in transit 176,768,141 174,917,236 157,483 -Other stocks 163,653,465 134,798,868 78,539,902 59,903,6003,481,776,206 2,843,743,161 2,018,601,341 1,534,369,218Provision for obsolete stock [18.(i)] (67,<strong>11</strong>5,197) (62,381,648) (30,000,000) (30,000,000)Net book amount 3,414,661,009 2,781,361,513 1,988,601,341 1,504,369,21818. (i) Provision for obsolete stockBalance at 1 April 62,381,648 56,8<strong>10</strong>,372 30,000,000 30,000,000Provision during the year 4,733,549 5,571,276 - -Balance at 31st March 67,<strong>11</strong>5,197 62,381,648 30,000,000 30,000,00069