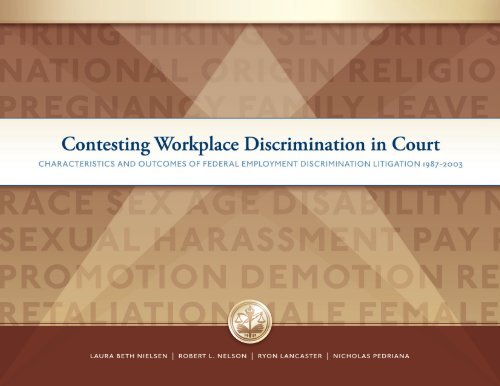
Contesting Workplace Discrimination in Court - American Bar ...
Contesting Workplace Discrimination in Court - American Bar ...
Contesting Workplace Discrimination in Court - American Bar ...

You also want an ePaper? Increase the reach of your titles
YUMPU automatically turns print PDFs into web optimized ePapers that Google loves.
<strong>Contest<strong>in</strong>g</strong> <strong>Workplace</strong> <strong>Discrim<strong>in</strong>ation</strong> <strong>in</strong> <strong>Court</strong>characteristics and outcomes of federal employment discrim<strong>in</strong>ation litigation 1987-2003<strong>American</strong> <strong>Bar</strong> FoundationChicago, ILISBN: 0-9822236-0-9©<strong>American</strong> <strong>Bar</strong> FoundationPrepared October 29, 2008The research summarized <strong>in</strong> this report was conducted with the generous f<strong>in</strong>ancial support of theNational Science Foundation (grant #SES-0417389), the <strong>American</strong> <strong>Bar</strong> Foundation, and the Searle Foundation.The authors benefited from participation <strong>in</strong> the <strong>Discrim<strong>in</strong>ation</strong> Research Group, which is a jo<strong>in</strong>t effort funded by the <strong>American</strong> <strong>Bar</strong> Foundation,the Center for Advanced Study <strong>in</strong> the Behavioral Sciences at Stanford University, and the Ford Foundation (grant #1045-0189).The authors contributed equally to the report. The tremendous work of data collection, clean<strong>in</strong>g, and cod<strong>in</strong>g would not have been possible withouta team of excellent research assistants <strong>in</strong>clud<strong>in</strong>g Amy Bashore, Aaron Beim, Heather Benzmiller, Michael Cramer, Zeh-Sheena Ekono, Seth Friedman,Jeff Hall, Tom Hill, David Harr<strong>in</strong>gton, Steve Hoffman, Evan Lowney, Bri McGriff, Brent Nakamura, Nicole Ouellette, Tanya Vega, G<strong>in</strong>ger Witherspoon,Diana Yoon, and Charles Yu. Creative Direction by Bradley Sexton Designs. The irreplaceable Ellen Berrey managed the project.Any op<strong>in</strong>ions, f<strong>in</strong>d<strong>in</strong>gs, conclusions, or recommendations expressed <strong>in</strong> this report are those of the authorsand do not necessarily reflect the views of the National Science Foundation (NSF) or any other fund<strong>in</strong>g agency.For questions about the report or the larger project, please contact:Laura Beth Nielsen, Research Professor, <strong>American</strong> <strong>Bar</strong> Foundation,750 N. Lake Shore Drive, 4th Floor, Chicago, IL 60611 (312) 988-6574 or lnielsen@abfn.org.-ii-
<strong>Contest<strong>in</strong>g</strong> <strong>Workplace</strong> <strong>Discrim<strong>in</strong>ation</strong> In <strong>Court</strong>CHARACTERISTICS AND OUTCOMES OF FEDERAL EMPLOYMENT DISCRIMINATION LITIGATION 1987-2003executive summaryAnalysis of 1788 randomly selected federal employment discrim<strong>in</strong>ation cases reveal several core f<strong>in</strong>d<strong>in</strong>gs and patterns:• After a relative lull <strong>in</strong> the late 1980s, the overall number of employment discrim<strong>in</strong>ation claims filed began to risesharply <strong>in</strong> the early 1990s, reached a high po<strong>in</strong>t around 1996, and steadily decl<strong>in</strong>ed throughout the late 1990s beforelevel<strong>in</strong>g off <strong>in</strong> the early 2000s.• The highest percentage of cases claim racial discrim<strong>in</strong>ation, followed by claims of sex, age, and disability discrim<strong>in</strong>ation.• <strong>Discrim<strong>in</strong>ation</strong> <strong>in</strong> fir<strong>in</strong>g and employer retaliation are by wide marg<strong>in</strong>s the most frequently challenged employer practices.• Settlement is the most frequent outcome of an employment discrim<strong>in</strong>ation case, whereas trials are extremely rare.• The overwhelm<strong>in</strong>g majority of employment discrim<strong>in</strong>ation cases consist of a solitary pla<strong>in</strong>tiff. Cases <strong>in</strong>volv<strong>in</strong>gmultiple pla<strong>in</strong>tiffs, class actions, and representation by the EEOC or a public <strong>in</strong>terest law firm are extremely rare butpla<strong>in</strong>tiffs <strong>in</strong> these cases have more favorable outcomes.• Dismissal is the most likely outcome when the compla<strong>in</strong>ant files pro se, account<strong>in</strong>g for an enormous 40 percent of allsuch cases (compared to an 11 percent dismissal rate when the pla<strong>in</strong>tiff has representation).• Just 20 (well under 1 percent) cases <strong>in</strong> our entire sample were certified class actions.• Trials—<strong>in</strong>variably the least common EDL outcome—become <strong>in</strong>creas<strong>in</strong>gly <strong>in</strong>frequent throughout the entire1987-2003 period.-iii-
Table of Contents and Figurespart 1 | <strong>in</strong>troduction 1Figure 1: Total Number Of Civil Cases And Employment <strong>Discrim<strong>in</strong>ation</strong> Cases Filed In Federal <strong>Court</strong>, 1972-2006 1part 2 | employment discrim<strong>in</strong>ation case characteristics 3Figure 2.1: Number Of EDL Compla<strong>in</strong>ts (Sample Frequencies) 1987-2003 3Figure 2.2: Percent Of Cases By <strong>Discrim<strong>in</strong>ation</strong> Type 4Figure 2.3: Percent Of Cases Alleg<strong>in</strong>g More Than One Type Of <strong>Discrim<strong>in</strong>ation</strong> 5Figure 2.4: Percent Of Race, Sex, Age, Disability, And National Orig<strong>in</strong> Cases That Include At Least One Additional Type Claim 5Figure 2.5: Percent Of Cases By <strong>Discrim<strong>in</strong>ation</strong> Issue 6Figure 2.6: Percent Of Cases With One Or More Issues Claimed 7Figure 2.7: Percent Of Cases With At Least One Additional Issue Claim 7Figure 2.8: Percent Of Cases By Selected Type-Issue Comb<strong>in</strong>ations 8Figure 2.9: Percent Of Cases By Statutory Claim 9Figure 2.10: Percent Of Cases With Multiple Statutory Claims 10Figure 2.11: Percent Of Selected Cases With At Least One Additional Statutory Claim 10Figure 2.12: Percent Of Cases By Cause Of Action 11Figure 2.13: Percent Of Cases By Number Of Pla<strong>in</strong>tiffs 12Figure 2.14: Percent Of Cases In Which Pla<strong>in</strong>tiff Filed Pro Se 13Figure 2.15: Percent Of Cases In Which Pla<strong>in</strong>tiff Was Represented By Public Interest Law Firm 13Figure 2.16: Percent Of Cases By Class Action Status 13Figure 2.17: Percent Of Cases In Which EEOC Made F<strong>in</strong>d<strong>in</strong>g 14Figure 2.18: Percent Of Cases By EEOC F<strong>in</strong>d<strong>in</strong>g 14Figure 2.19: Percent Of Cases In Which EEOC Intervened As Pla<strong>in</strong>tiff 15part 3 | judicial districts 16Figure 3.1: Percent Of <strong>Discrim<strong>in</strong>ation</strong> Type Alleged By Judicial District 16Figure 3.2: Percent Of <strong>Discrim<strong>in</strong>ation</strong> Issues Alleged By Judicial District 17Figure 3.3: Percent Of Cases With A Collective Legal Mobilization Component By Judicial District 18-iv-
Table of Contents and Figurespart 4 | pla<strong>in</strong>tiff characteristics 19Figure 4.1: Race Of Pla<strong>in</strong>tiffs By Percent 19Figure 4.2: Sex Of Pla<strong>in</strong>tiffs By Percent 20Figure 4.3: Pla<strong>in</strong>tiff’s Occupation By Percent 20Figure 4.4: Pla<strong>in</strong>tiff’s Race In Race <strong>Discrim<strong>in</strong>ation</strong> Claims By Percent 21Figure 4.5: Pla<strong>in</strong>tiff’s Sex In Race <strong>Discrim<strong>in</strong>ation</strong> Cases By Percent 22Figure 4.6: Pla<strong>in</strong>tiff’s Occupation In Race <strong>Discrim<strong>in</strong>ation</strong> Cases By Percent 22Figure 4.7: Pla<strong>in</strong>tiff’s Sex In Sex <strong>Discrim<strong>in</strong>ation</strong> Cases By Percent 23Figure 4.8: Race Of Pla<strong>in</strong>tiff In Sex <strong>Discrim<strong>in</strong>ation</strong> Cases By Percent 24Figure 4.9: Pla<strong>in</strong>tiff’s Occupation In Sex <strong>Discrim<strong>in</strong>ation</strong> Cases By Percent 24Figure 4.10: Pla<strong>in</strong>tiff’s Race In Age <strong>Discrim<strong>in</strong>ation</strong> Cases By Percent 25Figure 4.11: Pla<strong>in</strong>tiff’s Sex In Age <strong>Discrim<strong>in</strong>ation</strong> Cases By Percent 26Figure 4.12: Pla<strong>in</strong>tiff’s Occupation In Age <strong>Discrim<strong>in</strong>ation</strong> Cases By Percentage 26Figure 4.13: Pla<strong>in</strong>tiff’s Race In Disability <strong>Discrim<strong>in</strong>ation</strong> Cases By Percent 27Figure 4.14: Pla<strong>in</strong>tiff’s Sex In Disability <strong>Discrim<strong>in</strong>ation</strong> Cases By Percent 28Figure 4.15: Pla<strong>in</strong>tiff’s Occupation In Disability <strong>Discrim<strong>in</strong>ation</strong> Cases By Percentage 28part 5 | employment discrim<strong>in</strong>ation litigation outcomes 29Figure 5.1: EDL Case Outcomes By Percent 29Figure 5.2: Percent Outcomes By Judicial District 30Figure 5.3: Percent Outcomes By <strong>Discrim<strong>in</strong>ation</strong> Type Alleged 31Figure 5.4: Percent Outcomes By <strong>Discrim<strong>in</strong>ation</strong> Issue Alleged 32Figure 5.5: Percent Outcomes By Statute 33Figure 5.6: Percent Outcomes By Legal Theory 34Figure 5.7: Percent Of Case Outcomes By Number Of Pla<strong>in</strong>tiffs 35Figure 5.8: Percentage Of Case Outcomes By Legal Representation 36Figure 5.9: Percent Of Case Outcomes By Collective Action Status 38Figure 5.10: Percent Case Outcomes By EEOC Determ<strong>in</strong>ation 39Figure 5.11: Percent Outcomes When The EEOC Intervenes As Pla<strong>in</strong>tiff 40Figure 5.12: Trial Outcomes By Percent 41Figure 5.13: Percent Trial Results By Jury, Judge, Or Magistrate 42Figure 5.14: Initial Appeal Outcome By Percent 42-v-
Table of Contents and Figurespart 6 | time trends 43Figure 6.1: Percent Of Cases Alleg<strong>in</strong>g <strong>Discrim<strong>in</strong>ation</strong> Type By Time Period 43Figure 6.2: Percent Of Discrim<strong>in</strong>atory Issue Alleged By Time Period 45Figure 6.3: Percent Of Outcomes By Time Period 46part 7 | conclusion 47appendix i | methodology 48-vi-
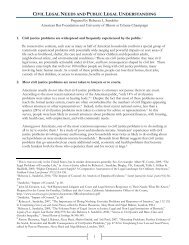
Part 1 | IntroductionS<strong>in</strong>ce the early 1970s, employment discrim<strong>in</strong>ation litigation has steadily occupied a command<strong>in</strong>g presence <strong>in</strong> U.S. civillaw (see Figure 1) and is the largest s<strong>in</strong>gle category of claims <strong>in</strong> federal courts. Then and now, the <strong>in</strong>dividual right to equalemployment opportunity—and access to the federal courts to enforce that right—has become a crucial resource <strong>in</strong> U.S. society’songo<strong>in</strong>g struggle to end employment bias on the basis of race, sex, ethnicity, age, disability, and other protected characteristics.In pursuit of that objective, Congress has enacted multiple statutes s<strong>in</strong>ce the 1960s <strong>in</strong>clud<strong>in</strong>g the Equal Pay Act (EPA, 1963),Title VII of the 1964 Civil Rights Act, the Age <strong>Discrim<strong>in</strong>ation</strong> <strong>in</strong> Employment Act (ADEA, 1968), the Pregnancy <strong>Discrim<strong>in</strong>ation</strong>Act (PDA, 1978), the Rehabilitation Act (1973), the <strong>American</strong>s with Disabilities Act (ADA, 1990), and the Family Medical LeaveAct (FMLA, 1993). Claims of racial discrim<strong>in</strong>ation may also be brought under two Reconstruction-era statutes, §1981 and §1983of the Civil Rights Act of 1871.*figure 1 :total number of civilcases and employmentdiscrim<strong>in</strong>ation casesfiled <strong>in</strong> federal court,1972-2006* A pla<strong>in</strong>tiff may also br<strong>in</strong>g a constitutional claim <strong>in</strong> cases alleg<strong>in</strong>g discrim<strong>in</strong>ation by the state.-1-
This report summarizes the basic characteristics of these cases based on a comprehensive, <strong>in</strong>-depth analysis of employmentdiscrim<strong>in</strong>ation litigation (hereafter EDL) for the time period 1987-2003. We explored the patterns, characteristics, trends,and outcomes of 1788 randomly selected cases from seven federal judicial districts.**The<strong>in</strong>dividual rightto equalemploymentopportunity—and access to thefederal courts toenforcethat right—has become a crucialresource<strong>in</strong> U.S. society’songo<strong>in</strong>g struggleto endemployment bias.We considered a wide range of case characteristics and variables, <strong>in</strong>clud<strong>in</strong>g:• Type of discrim<strong>in</strong>ation claimed (race, sex, age, national orig<strong>in</strong>, disability, etc.)• Alleged discrim<strong>in</strong>atory issues or practices (hir<strong>in</strong>g, fir<strong>in</strong>g, promotion, sexual harassment, etc.)• Case comparisons across judicial districts• Pla<strong>in</strong>tiff characteristics (race, sex, age, etc.)• Pla<strong>in</strong>tiff representation (s<strong>in</strong>gle or multiple pla<strong>in</strong>tiffs, class-actions, public <strong>in</strong>terest litigation support, etc.)• Case outcomes (settlement, trial, etc.)• Over-time trends <strong>in</strong> EDL case characteristics and outcomesEach of the nearly 2,000 cases has been coded for hundreds of variables, but this report summarizes and presents the data <strong>in</strong> themost straightforward and understandable terms possible. Our f<strong>in</strong>d<strong>in</strong>gs are generally depicted as simple graphics or figures ratherthan tables loaded with raw numbers and percentages. Also consistent with the purpose of the report to describe the caseloadsimply, we leave formal tests of statistical significance for future analysis. Our large sample size (n=1788) often would f<strong>in</strong>dstatistically significant differences, but <strong>in</strong> ways that would likely obscure and needlessly complicate the broader contours ofEDL cases that we want to convey <strong>in</strong> this report.The rema<strong>in</strong>der of the report is organized as follows. Part II explores the general characteristics of all EDL cases, <strong>in</strong>clud<strong>in</strong>g(but not limited to) those listed <strong>in</strong> the above bullet po<strong>in</strong>ts. Part III compares many of these characteristics across the sevenjudicial districts from which our sample was drawn. Part IV takes a closer look at pla<strong>in</strong>tiff characteristics, both <strong>in</strong> general, andwith respect to particular case characteristics. Part V turns our attention to case outcomes—and the case characteristics that <strong>in</strong>fluencethose outcomes—rang<strong>in</strong>g from early case dismissal to trials and appeals. Part VI exam<strong>in</strong>es whether and to what extent thebroader characteristics and outcomes of EDL cases have changed over the course of the study’s time horizon (1987-2003). F<strong>in</strong>ally,Part VII summarizes our key f<strong>in</strong>d<strong>in</strong>gs and suggests some cautious conclusions about the nature, reach, and impact of EDL<strong>in</strong> the last decade and a half, and where this crucial dimension of U.S. civil rights policy might be headed <strong>in</strong> the near-future.** Northern District of Ill<strong>in</strong>ois (NDIL); Southern District of New York (SDNY); Northern District of Georgia (NDGA); Northern District of California(NDCA); Northern District of Texas (NDTX); Eastern District of Louisiana (EDLA); Eastern District of Pennsylvania (EDPA).-2-
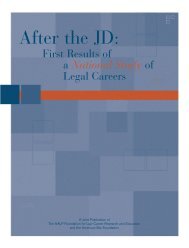
Part 2 | Employment <strong>Discrim<strong>in</strong>ation</strong> Case CharacteristicsVOLUME OF COMPLAINTS 1987-2003In thefour years between1993-96(the first Cl<strong>in</strong>tonadm<strong>in</strong>istration),the numberof compla<strong>in</strong>ts<strong>in</strong>creasedsignificantlyfrom theprior six-year(1987-1992)period.We beg<strong>in</strong> our analysis by not<strong>in</strong>g trends <strong>in</strong> the frequency of compla<strong>in</strong>ts for the 1987-2003 period. We broke down thisseventeen-year period <strong>in</strong>to four discrete time blocks: 1987-1992; 1993-96; 1997-2000; and 2001-2003. Each time block roughlycorresponds to prior presidential adm<strong>in</strong>istrations, but two exceptions should be kept <strong>in</strong> m<strong>in</strong>d. First, we <strong>in</strong>cluded compla<strong>in</strong>tsfrom 1987 and 1988 (Reagan adm<strong>in</strong>istration) to the first time-period cover<strong>in</strong>g the tenure of the first President Bush (1989-1992).Second, s<strong>in</strong>ce our data base ends with 2003 cases, the f<strong>in</strong>al time block (2001-03) covers just the first three years of the secondPresident Bush’s first term. Such considerations notwithstand<strong>in</strong>g, Figure 2.1 shows a clear pattern <strong>in</strong> the volume of EDLcompla<strong>in</strong>ts over time. In the four years between 1993-96 (the first Cl<strong>in</strong>ton adm<strong>in</strong>istration), the number of compla<strong>in</strong>ts <strong>in</strong>creasedsignificantly from the prior six-year (1987-1992) period. The volume of compla<strong>in</strong>ts then rose even higher and peaked dur<strong>in</strong>gCl<strong>in</strong>ton’s second adm<strong>in</strong>istration. This trend was then reversed dur<strong>in</strong>g George W. Bush’s first term, as the volume of compla<strong>in</strong>ts shotdown to roughly 1987-1992 levels (keep<strong>in</strong>g <strong>in</strong> m<strong>in</strong>d that this excludes compla<strong>in</strong>ts from 2004, the f<strong>in</strong>al year of Bush’s first term).figure 2.1 :number of edl compla<strong>in</strong>ts(sample frequencies) 1987-2003(n=1788)-3-
TYPES OF DISCRIMINATIONAbout40 percent ofcases <strong>in</strong>volve arace claim,while 37 percentof all cases <strong>in</strong>volvea sex claim.Federal law prohibits employment discrim<strong>in</strong>ation on the basis of various employee characteristics, <strong>in</strong>clud<strong>in</strong>g race, sex, nationalorig<strong>in</strong>, religion, age and disability. It also bans discrim<strong>in</strong>ation because of pregnancy and aga<strong>in</strong>st those tak<strong>in</strong>g authorized familyleave. As depicted <strong>in</strong> Figure 2.2, race and sex claims are the most common types of EDL cases. About 40 percent of cases <strong>in</strong>volvea race claim, while 37 percent of all cases <strong>in</strong>volve a sex claim. Claims based on age and disability are the next most common,mak<strong>in</strong>g up about 22 and 20 percent, respectively, of all EDL cases. A third tier of claims <strong>in</strong>volve discrim<strong>in</strong>ation because ofnational orig<strong>in</strong>, account<strong>in</strong>g for about 12 percent of all cases. The rema<strong>in</strong><strong>in</strong>g types of discrim<strong>in</strong>ation, because of religion(four percent), pregnancy (four percent), and family leave (three percent) are considerably more rare.figure 2.2 :percent of casesby discrim<strong>in</strong>ation type *(n=1788)*Percentages add to >100% due to multiple claims <strong>in</strong> a s<strong>in</strong>gle case.-4-
MULTIPLE TYPE CLAIMSQuotes will gohere. Quotes willgo here. Quoteswill go here.Quotes will gohere. Quotes willgo here. Quoteswill go here.Quotes willCompla<strong>in</strong>ants may make claims based on more than one characteristic. For example, a pla<strong>in</strong>tiff may claim that she wasdiscrim<strong>in</strong>ated aga<strong>in</strong>st because of her race and sex or on account of his age and disability. Just over one-third of all EDL cases(35 percent) <strong>in</strong>volve more than one type of discrim<strong>in</strong>ation claim (see Figure 2.3). We also looked to see if particular types ofclaims were likely to <strong>in</strong>clude additional claims. The data illustrated <strong>in</strong> Figure 2.4 show that claims based on race, sex, age, anddisability each have about a 50/50 likelihood of <strong>in</strong>clud<strong>in</strong>g at least one other type of claim. National orig<strong>in</strong> appears to be anoutlier <strong>in</strong> this regard; over 80 percent of national orig<strong>in</strong> cases <strong>in</strong>clude at least one additional type claim.figure 2.3 :percent of cases alleg<strong>in</strong>gmore than one type of discrim<strong>in</strong>ationone type allegedmore than one type alleged(n=1788)65%35%figure 2.4 :percent of race, sex, age,disability, and national orig<strong>in</strong>cases that <strong>in</strong>clude at least oneadditional type claim-5-
figure 2.6 :percent of cases withone or more issues claimedone issuemore than one issue45%(n=1785)55%figure 2.7 :percent of caseswith at least oneadditional issue claim-7-
TYPE-ISSUE COMBINATIONSAn important question <strong>in</strong> EDL cases is whether discrim<strong>in</strong>ation based on particular employee characteristics tends to align withparticular issue claims. For example, is unlawful fir<strong>in</strong>g more of a problem <strong>in</strong> race, as opposed to sex or age cases? Are claims ofdiscrim<strong>in</strong>atory promotion more prevalent <strong>in</strong> sex cases than <strong>in</strong> disability cases? Although formal tests of statistical significance arenecessary to answer such questions, the data nonetheless reveal—<strong>in</strong> a general sense—substantial uniformity <strong>in</strong> the breakdownof cases by type and issue. With just two exceptions, race, sex, age, disability, and national orig<strong>in</strong> cases follow a strik<strong>in</strong>gly similarpattern <strong>in</strong> the proportion of issue claims: unlawful fir<strong>in</strong>g is the most prevalent, followed (<strong>in</strong> order) by claims of discrim<strong>in</strong>atoryretaliation, promotion, pay, and hir<strong>in</strong>g. Figure 2.8 shows that the one major exception to this pattern is sex cases, <strong>in</strong> which theproportion of retaliation claims (54 percent of all sex cases) is slightly higher than that for fir<strong>in</strong>g claims (50 percent). In broadterms, this suggests that there exists a consistent hierarchy <strong>in</strong> the frequency of claims about unlawful employer practices.Moreover, discrim<strong>in</strong>atory fir<strong>in</strong>g and employer retaliation are, by substantial marg<strong>in</strong>s, the two greatest concerns of all pla<strong>in</strong>tiffs,regardless of their race, sex, age, disability, or national orig<strong>in</strong>.figure 2.8 :percent of cases by selectedtype-issue comb<strong>in</strong>ationsfir<strong>in</strong>gretaliationpromotionpayhir<strong>in</strong>g-8-
STATUTESFigure 2.9 displays the percentage of cases filed under the various EDL statutes. Not surpris<strong>in</strong>gly, the vast majority ofEDL cases (73 percent) <strong>in</strong>voke Title VII of the 1964 Civil Rights Act. Age cases brought under the ADEA are the next mostcommon (20 percent) followed by §1981 (19 percent) and disability cases under the ADA (17 percent). Claims based on therema<strong>in</strong><strong>in</strong>g statutes are considerably less common; §1983 claims make up about 7 percent of cases, followed by claims with aconstitutional dimension (five percent), family leave (FMLA) and equal pay cases (EPA) (about three percent each),the Rehabilitation Act (two percent), and pregnancy cases (PDA) (one percent).figure 2.9 :percent of casesby statutory claim *(n=1785)*Percentages add to >100 due to multiple statutory claims <strong>in</strong> a s<strong>in</strong>gle case.-9-
MULTIPLE STATUTORY CLAIMSAbout43 percentof cases<strong>in</strong>volved multiplestatutory claims(Figure 2.10).As with discrim<strong>in</strong>atory types and issues discussed above, a compla<strong>in</strong>ant is permitted to br<strong>in</strong>g multiple statutory claims <strong>in</strong> a s<strong>in</strong>glecase. About 43 percent of cases <strong>in</strong>volved multiple statutory claims (Figure 2.10). Also, as Figure 2.11 shows, certa<strong>in</strong> statutorycases are more likely than others to <strong>in</strong>clude additional claims. For example, both §1983 and §1981 cases virtually always<strong>in</strong>clude additional statutory claims (98 and 91 percent, respectively). ADA cases are also quite likely to <strong>in</strong>clude additionalclaims (65 percent), while ADEA cases have an exactly 50/50 likelihood of do<strong>in</strong>g so. F<strong>in</strong>ally, about 47 percent of Title VIIcases <strong>in</strong>clude at least one additional statutory claim.figure 2.10 :percent of cases withmultiple statutory claimsone claimmore than one claim57%43%(n=1785)figure 2.11 :percent of selectedcases with at least oneadditional statutory claim-10-
THEORY OF THE CASEThere are two theories of discrim<strong>in</strong>ation available to EDL compla<strong>in</strong>ants: disparate treatment and disparate impact.Disparate treatment cases require a show<strong>in</strong>g of discrim<strong>in</strong>atory <strong>in</strong>tent; disparate impact cases, by contrast, <strong>in</strong>volve faciallyneutral employment practices that have a statistically disproportionate effect on a protected group. The employer’s motivation or<strong>in</strong>tent is irrelevant <strong>in</strong> disparate impact cases. EDL almost universally <strong>in</strong>volves disparate treatment claims. Over 98 percent of caseswere such cases, whereas just four percent of cases brought a disparate impact cause of action (Figure 2.12). And although EDLlaw permits a pla<strong>in</strong>tiff to <strong>in</strong>voke both causes of action, compla<strong>in</strong>ants do so <strong>in</strong> less than three percent of all cases. In short, itappears as though employees mobilize EDL law more or less exclusively <strong>in</strong> response to an employer’s specific and <strong>in</strong>tentional acts.They do not challenge the broader structural disadvantages embedded <strong>in</strong> rout<strong>in</strong>ized employment practices.figure 2.12 :percent of casesby cause of action(n=1779)*Percentages add to >100 because of multiple causes of action <strong>in</strong> a s<strong>in</strong>gle case.-11-
PLAINTIFFS AND PLAINTIFF REPRESENTATIONEDL compla<strong>in</strong>ts may <strong>in</strong>volve a s<strong>in</strong>gle <strong>in</strong>dividual, multiple <strong>in</strong>dividuals, or a class action. Furthermore, pla<strong>in</strong>tiffs may file acompla<strong>in</strong>t pro se while some seek representation from a Public Interest Law Firm (PILF). Despite these options, the data stronglysuggest that EDL compla<strong>in</strong>ts almost exclusively <strong>in</strong>volve a s<strong>in</strong>gle compla<strong>in</strong>ant/pla<strong>in</strong>tiff act<strong>in</strong>g alone. As Figure 2.13 illustrates,over 93 percent of all sampled cases are brought by a sole <strong>in</strong>dividual. Only about six percent of cases <strong>in</strong>clude between two andten pla<strong>in</strong>tiffs, and a scant .05 percent of all cases have more than ten pla<strong>in</strong>tiffs. A sizeable proportion (23 percent) of cases arefiled pro se (Figure 2.14), whereas PILFs represent pla<strong>in</strong>tiffs <strong>in</strong> under one percent of cases (Figure 2.15). F<strong>in</strong>ally, class actions areextremely rare. In about 97% of cases, pla<strong>in</strong>tiffs do not seek class action certification, and overall, a class action is certified <strong>in</strong> justone percent of all EDL cases (Figure 2.16).figure 2.13 :percent of casesby number of pla<strong>in</strong>tiffs(n=1788)-12-
figure 2.14 :percent of cases <strong>in</strong>which pla<strong>in</strong>tiff filed pro sefiled pro sedid not file pro sefigure 2.15 :percent of cases <strong>in</strong> whichpla<strong>in</strong>tiff was represented bypublic <strong>in</strong>terest law firmrepresented by pilfnot represented by pilf(n=1782)23%(n=1764)99%77%1%figure 2.16 :percent of cases byclass action status(n=1775)-13-
THE EEOCThe Equal Employment Opportunity Commission adm<strong>in</strong>isters and partly enforces most EDL statutes <strong>in</strong>clud<strong>in</strong>g Title VII, theADEA, and the ADA. EDL procedures normally require that a formal compla<strong>in</strong>t first be submitted to the EEOC for process<strong>in</strong>g.The EEOC then has 180 days <strong>in</strong> which to <strong>in</strong>vestigate the compla<strong>in</strong>t, make a f<strong>in</strong>d<strong>in</strong>g or non f<strong>in</strong>d<strong>in</strong>g of reasonable cause, and, ifcause is found, to secure a voluntary agreement with the employer. After 180 days, and regardless of the outcome, pla<strong>in</strong>tiffs areauthorized to file a private lawsuit <strong>in</strong> district court. All that said, the EEOC does not typically get very far through the adm<strong>in</strong>istrativeprocess, and only rarely does the EEOC side with the compla<strong>in</strong>ant. As shown <strong>in</strong> Figures 2.17 and 2.18, respectively, theEEOC fails to make a f<strong>in</strong>d<strong>in</strong>g one way or the other <strong>in</strong> nearly 77 percent of all filed compla<strong>in</strong>ts. Of the 23% of claims <strong>in</strong> which af<strong>in</strong>d<strong>in</strong>g was made, the EEOC found that just one <strong>in</strong> five had merit.figure 2.17 :percent of cases <strong>in</strong>which eeoc made f<strong>in</strong>d<strong>in</strong>g23%made f<strong>in</strong>d<strong>in</strong>gno f<strong>in</strong>d<strong>in</strong>g(n=1523)77%figure 2.18 :percent of casesby eeoc f<strong>in</strong>d<strong>in</strong>g21%support on meritsdid not support on merits(n=342)79%-14-
EEOC AS PLAINTIFFThe EEOC’s adm<strong>in</strong>istrative and compla<strong>in</strong>t-process<strong>in</strong>g activities notwithstand<strong>in</strong>g, the agency further possesses prosecutorialauthority, and may br<strong>in</strong>g suit <strong>in</strong> federal court as the pla<strong>in</strong>tiff. It rarely does so. As Figure 2.19 shows, the EEOC <strong>in</strong>tervenes aspla<strong>in</strong>tiff <strong>in</strong> just three percent of all EDL cases.figure 2.19 :percent of cases <strong>in</strong> whicheeoc <strong>in</strong>tervened as pla<strong>in</strong>tiff97%did not <strong>in</strong>tervene<strong>in</strong>tervened(n=1788)3%-15-
Part 3 | Judicial DistrictsThis section explores and compares several key EDL case characteristics across the seven judicial districts from which our samplecases were drawn. We focus specifically on discrim<strong>in</strong>ation type claims, issue claims, and pla<strong>in</strong>tiff representation variables.DISCRIMINATION TYPEFigure 3.1 displays the percentage breakdown of discrim<strong>in</strong>ation type claims by judicial district. With a few exceptions, the basicpattern found across all cases (from the previous section) generally holds for each district: Race cases are most common, followedby sex, age, and disability claims. One major exception is the Eastern District of Pennsylvania, where sex claims slightly outnumberrace claims. Another exception comes from the Northern District of California, which reveals substantially more disabilityclaims than age claims. F<strong>in</strong>ally, the Eastern District of Louisiana shows essentially an equal number of age and disability claims.figure 3.1 :percent of discrim<strong>in</strong>ationtype alleged by judicial districtracesexagedisability-16-
DISCRIMINATION ISSUESThe breakdownof discrim<strong>in</strong>ationissues by judicialdistrict,without exception,is consistent withour coref<strong>in</strong>d<strong>in</strong>g <strong>in</strong> theprevious section:discrim<strong>in</strong>atoryfir<strong>in</strong>g is far andaway the mostfrequent claimmade byEDL pla<strong>in</strong>tiffs.The breakdown of discrim<strong>in</strong>ation issues by judicial district, without exception, is consistent with our core f<strong>in</strong>d<strong>in</strong>g <strong>in</strong> the previoussection: discrim<strong>in</strong>atory fir<strong>in</strong>g is far and away the most frequent claim made by EDL pla<strong>in</strong>tiffs (Figure 3.2). Also consistent withthe general pattern (but with one exception, NDCA), hir<strong>in</strong>g claims are the least frequent (of the five issues presented here).Percentages of promotion and sexual harassment claims are generally comparable, with perhaps a very slight edge to promotion(sexual harassment claims are slightly more frequent <strong>in</strong> NDTX and EDPA). F<strong>in</strong>ally, both promotion and sexual harassment claimsare more common than pay claims, albeit by relatively small marg<strong>in</strong>s. The one exception comes from SDNY, where there wereslightly more pay claims than promotion or sexual harassment claims.figure 3.2 :percent of discrim<strong>in</strong>ationissues alleged by judicial districthir<strong>in</strong>gfir<strong>in</strong>gpaypromotionsexual harassment-17-
PLAINTIFF REPRESENTATIONTheoverwhelm<strong>in</strong>gpercentage of EDLcases <strong>in</strong>volvesa s<strong>in</strong>gle pla<strong>in</strong>tiffact<strong>in</strong>g alone.As was clearly shown <strong>in</strong> Part 2, the overwhelm<strong>in</strong>g percentage of EDL cases <strong>in</strong>volves a s<strong>in</strong>gle pla<strong>in</strong>tiff act<strong>in</strong>g alone. Because ofthe extremely small number of cases that <strong>in</strong>clude more than one pla<strong>in</strong>tiff, PILF representation, and/or certified class actions,we comb<strong>in</strong>ed each of these variables <strong>in</strong>to a new “collective legal mobilization” variable. A case is considered to have collectivelegal mobilization if it meets any of the above criteria (more than one pla<strong>in</strong>tiff, PILF representation, or class action). Yet as Figure3.3 shows, there does not appear to be a great deal of variation across judicial districts on the collective mobilization. The NDCAand EDLA have the highest percentage of such cases, but even here the percentages are quite small (about ten percent of cases).The rema<strong>in</strong><strong>in</strong>g districts oscillate somewhere between four percent and seven percent. In short, and regardless of judicial district,the vast majority of EDL cases are solitary endeavors for pla<strong>in</strong>tiffs.figure 3.3 :percent of cases with acollective legal mobilizationcomponent by judicial district-18-
Part 4 | Pla<strong>in</strong>tiff CharacteristicsForty-fourpercentof all EDLpla<strong>in</strong>tiffs areAfrican <strong>American</strong>,while 33 percentare white.This section explores the distribution of three primary pla<strong>in</strong>tiff characteristics <strong>in</strong> EDL cases: race, sex, and occupation.We first exam<strong>in</strong>e pla<strong>in</strong>tiff characteristics across all cases; Next, we explore the distribution of such characteristics with<strong>in</strong> thefour most common types of alleged discrim<strong>in</strong>ation: race, sex, age, and disability. Figures 4.1 through 4.3 present, respectively,the overall racial, sex, and occupational characteristics of pla<strong>in</strong>tiffs as a percent of all EDL cases. Forty-four percent of all EDLpla<strong>in</strong>tiffs are African <strong>American</strong>, while 33 percent are white. All rema<strong>in</strong><strong>in</strong>g racial categories make up the additional 23 percentof cases.* As for sex demographics, we found essentially equal numbers of male and female pla<strong>in</strong>tiffs (with a very slight edge forwomen, 51 to 49 percent). As for occupation, the largest plurality of cases (48.5 percent) are filed by pla<strong>in</strong>tiffs who work <strong>in</strong> sales,service, or adm<strong>in</strong>istration, followed by those <strong>in</strong> managerial or professional occupations (32.5 percent). The smallest percentage ofEDL cases (19 percent) come from blue collar and/or workers <strong>in</strong> other occupations.figure 4.1 :race of pla<strong>in</strong>tiffs by percent(n=1534)* We could determ<strong>in</strong>e the race of the pla<strong>in</strong>tiff <strong>in</strong> 1,534 of the 1,788 cases. This analysis excludes the “race unknown” category.-19-
figure 4.2 :sex of pla<strong>in</strong>tiffs by percentfemalemale51%(n=1779)49%figure 4.3 :pla<strong>in</strong>tiff’s occupation by percent48.5%sales | service | adm<strong>in</strong>istrativeblue collar | othermanagerial | professional19%(n=1671)32.5%-20-
PLAINTIFF CHARACTERISTICS IN RACE, SEX, AGE, AND DISABILITY CASESEightpercent ofrace casesare filed bywhites.The follow<strong>in</strong>g figures present the race, sex, and occupational characteristics of pla<strong>in</strong>tiffs <strong>in</strong> the four most frequentdiscrim<strong>in</strong>ation type allegations.race casesAlthough federal law protects all races from employment discrim<strong>in</strong>ation, African <strong>American</strong>s account for the overwhelm<strong>in</strong>gproportion of pla<strong>in</strong>tiffs <strong>in</strong> cases alleg<strong>in</strong>g racial bias (80 percent). By contrast, eight percent of race cases are filed by whites;all rema<strong>in</strong><strong>in</strong>g racial groups make up just 11 percent of race-based EDL claims (Figure 4.4). So-called “reverse discrim<strong>in</strong>ation”cases are relatively rare.Turn<strong>in</strong>g to the pla<strong>in</strong>tiff’s sex <strong>in</strong> race cases (Figure 4.5), men are substantially more likely to allege race discrim<strong>in</strong>ation than arewomen (58 percent to 42 percent). As for occupation, Figure 4.6 shows that nearly half (48 percent) of all race cases <strong>in</strong>volvepla<strong>in</strong>tiffs work<strong>in</strong>g <strong>in</strong> sales, services, or adm<strong>in</strong>istration. A sizably smaller proportion of cases are filed by those <strong>in</strong> managerialor professional occupations (30 percent), and is smaller still for those <strong>in</strong> blue collar or other occupations (22 percent).figure 4.4 :pla<strong>in</strong>tiff’s race <strong>in</strong> racediscrim<strong>in</strong>ation claims by percent(n=695)-21-
figure 4.5 :pla<strong>in</strong>tiff’s sex <strong>in</strong> racediscrim<strong>in</strong>ation cases by percentfemalemale42%(n=722)58%figure 4.6 :pla<strong>in</strong>tiff’s occupation <strong>in</strong> racediscrim<strong>in</strong>ation cases by percent48%sales | service | adm<strong>in</strong>istrativeblue collar | othermanagerial | professional22%(n=722)30%-22-
sex casesThe vastmajority ofsex cases(80 percent)are broughtby women.Figures 4.7-4.9 display the same three pla<strong>in</strong>tiff’s characteristics <strong>in</strong> EDL cases alleg<strong>in</strong>g sex discrim<strong>in</strong>ation. Not surpris<strong>in</strong>gly,the vast majority of sex cases (80 percent) are brought by women. When look<strong>in</strong>g at the racial demographics of sex cases(Figure 4.8), we found that white women are most likely to allege sex discrim<strong>in</strong>ation, followed somewhat closely by African<strong>American</strong> women (41 to 35 percent, respectively). F<strong>in</strong>ally, occupational status differs <strong>in</strong> a fundamental respect <strong>in</strong> sex cases than<strong>in</strong> race cases: whereas the largest percentage of race cases <strong>in</strong>volve those <strong>in</strong> sales, service, or adm<strong>in</strong>istration, the largest proportionof sex allegations are brought by those <strong>in</strong> management or professional occupations (50 vs. 37 percent). Like race cases, however,cases filed by blue collar or other workers make up the smallest percentage of pla<strong>in</strong>tiffs <strong>in</strong> sex bias cases (13 percent).figure 4.7 :pla<strong>in</strong>tiff’s sex <strong>in</strong> sexdiscrim<strong>in</strong>ation cases by percent20%malefemale(n=654)80%-23-
figure 4.8 :race of pla<strong>in</strong>tiff <strong>in</strong> sexdiscrim<strong>in</strong>ation cases by percent(n=543)figure 4.9 :pla<strong>in</strong>tiff’s occupation <strong>in</strong>sex discrim<strong>in</strong>ation cases by percent37%13%sales | service | adm<strong>in</strong>istrativeblue collar | othermanagerial | professional(n=615)50%-24-
age casesBy awide marg<strong>in</strong>,whites make upthe largestproportion of agediscrim<strong>in</strong>ationpla<strong>in</strong>tiffs(49 percent).By a wide marg<strong>in</strong>, whites make up the largest proportion of age discrim<strong>in</strong>ation pla<strong>in</strong>tiffs (49 percent). African <strong>American</strong>,Hispanic, and Asian pla<strong>in</strong>tiffs comb<strong>in</strong>ed account for 30 percent of age cases (Figure 4.10). Also, as shown <strong>in</strong> Figure 4.11,male pla<strong>in</strong>tiffs outnumber female pla<strong>in</strong>tiffs by about a two-to-one marg<strong>in</strong>. And f<strong>in</strong>ally, Figure 4.12 depicts the occupationalbreakdown of age discrim<strong>in</strong>ation pla<strong>in</strong>tiffs. Those <strong>in</strong> managerial or professional jobs slightly outnumber those <strong>in</strong> sales, service,and adm<strong>in</strong>istration (45 to 39 percent), while blue collar or other workers make up just 16 percent of such cases.figure 4.10 :pla<strong>in</strong>tiff’s race <strong>in</strong> agediscrim<strong>in</strong>ation cases by percent(n=311)-25-
figure 4.11 :pla<strong>in</strong>tiff’s sex <strong>in</strong> agediscrim<strong>in</strong>ation cases by percent37%femalemale(n=394)63%figure 4.12 :pla<strong>in</strong>tiff’s occupation <strong>in</strong> agediscrim<strong>in</strong>ation cases by percentagesales | service | adm<strong>in</strong>istrativeblue collar | othermanagerial | professional39%16%(n=394)45%-26-
disability casesPla<strong>in</strong>tiff characteristics <strong>in</strong> disability cases show a similar pattern as age cases, at least with respect to the pla<strong>in</strong>tiff’s race andsex. White men and women (49 percent) and men of all races (59 percent) are most likely to allege disability discrim<strong>in</strong>ation(Figures 4.13 and 4.14). Occupational status, however, shows a bit more parity (Figure 4.15). The highest proportion ofsuch cases (43 percent) <strong>in</strong>volve pla<strong>in</strong>tiffs <strong>in</strong> sales, service, or adm<strong>in</strong>istration, while about equal percentages of pla<strong>in</strong>tiffs are<strong>in</strong> managerial/professional (29 percent) and blue collar/other jobs (28 percent).figure 4.13 :pla<strong>in</strong>tiff’s race <strong>in</strong> disabilitydiscrim<strong>in</strong>ation cases by percent(n=296)-27-
figure 4.14 :pla<strong>in</strong>tiff’s sex <strong>in</strong> disabilitydiscrim<strong>in</strong>ation cases by percent41%femalemale(n=334)59%figure 4.15 :pla<strong>in</strong>tiff’s occupation <strong>in</strong>disability discrim<strong>in</strong>ation cases by percentage43%sales | service | adm<strong>in</strong>istrativeblue collar | othermanagerial | professional28%(n=394)29%-28-
Part 5 | Employment <strong>Discrim<strong>in</strong>ation</strong> Litigation OutcomesAcrossall cases,settlement isby far thes<strong>in</strong>gle mostlikely outcome,and . . .trials areextremely rare.EDL cases can conclude <strong>in</strong> various ways. For this study, we focused on four major outcomes: dismissal, trial, summary judgment,and settlement.* The follow<strong>in</strong>g sections summarize case outcomes associated with many of the specific cases characteristics discussed<strong>in</strong> the previous sections. First, however, Figure 5.1 displays the general contours of EDL cases outcomes. Across all cases, settlementis by far the s<strong>in</strong>gle most likely outcome, and occurs <strong>in</strong> 54 percent of cases. Dismissal and summary judgment are about equally likely,with just a slight edge to dismissal (18 to 16 percent, respectively). F<strong>in</strong>ally, trials are extremely rare and are by far the least likelyoutcome <strong>in</strong> EDL cases (about 5.5 percent). As will become clear below, this general outcome pattern is remarkably robust acrossvirtually all case characteristics and dimensions. (For rema<strong>in</strong><strong>in</strong>g figures we do not <strong>in</strong>clude percentage of cases other/still open.)figure 5.1 :edl case outcomes by percent(n=1788)* Refers to cases <strong>in</strong> which the defendant-employer w<strong>in</strong>s summary judgment on all counts, end<strong>in</strong>g the case at the district court level. It does not refer tosummary judgments for procedural or other motions that did not result <strong>in</strong> case dismissal.-29-
JUDICIAL DISTRICTFigure 5.2 shows how outcomes are broken down by each of the seven judicial districts from which our cases were drawn.Regardless of where the case is brought, the general pattern holds. Settlement is the most common outcome by a wide marg<strong>in</strong>,while trials are the least common, also by a wide marg<strong>in</strong>. Dismissal and summary judgment fall <strong>in</strong> between, with dismissal slightlymore likely than summary judgment <strong>in</strong> some districts (four of seven), while <strong>in</strong> other districts (three of seven) summary judgmentis slightly more likely than dismissal. One partial outlier may be the Eastern District of Pennsylvania. While the general outcomepattern holds, two f<strong>in</strong>d<strong>in</strong>gs stand out. First, 68 percent of all EDPA cases end <strong>in</strong> settlement, compared to a 52 percent average forthe other six districts. Also, trials, although still rare, are more common <strong>in</strong> this district (seven percent), compared to a five percentaverage for the other districts. What this seems to suggest is that pla<strong>in</strong>tiffs on average may do somewhat better <strong>in</strong> this district,as cases are less likely to end <strong>in</strong> the two most employer-friendly outcomes: dismissal and summary judgment.figure 5.2 :percent outcomesby judicial districtsettleddismissedsummary judgmenttrial-30-
DISCRIMINATION TYPES AND ISSUESFigure 5.3 shows the breakdown of case outcomes by the type of discrim<strong>in</strong>ation claimed. Aga<strong>in</strong>, the general outcome patternholds; regardless of discrim<strong>in</strong>ation type, settlements are most frequent, trials almost never happen, and dismissal and summaryjudgment take turns <strong>in</strong> the middle. The data further show that, of all discrim<strong>in</strong>ation types, sex cases have the highest percentageof settlements (55 percent compared to a 49.5 percent average for the other types), while national orig<strong>in</strong> cases (not shown <strong>in</strong>figures) have the highest percentage of trials (seven percent) albeit by a very slim marg<strong>in</strong>.figure 5.3 :percent outcomes bydiscrim<strong>in</strong>ation type allegedsettleddismissedsummary judgmenttrial-31-
Turn<strong>in</strong>g to discrim<strong>in</strong>ation issues <strong>in</strong> Figure 5.4, cases <strong>in</strong>volv<strong>in</strong>g sexual harassment have both the greatest likelihood of settlement(65 percent) and the lowest likelihood of go<strong>in</strong>g to trial (slightly under three percent). Claims of discrim<strong>in</strong>atory promotion showthe exact reverse; such cases are the least likely to settle (51 percent) and the most likely to end <strong>in</strong> a trial (about 6.5 percent).Hir<strong>in</strong>g cases stand out somewhat <strong>in</strong> that they too are almost as unlikely to end <strong>in</strong> trial as are sexual harassment cases (just overthree percent). F<strong>in</strong>ally, discrim<strong>in</strong>atory fir<strong>in</strong>g—the most frequent claim <strong>in</strong> EDL cases—appears to fall somewhere <strong>in</strong> between:about 54 percent of fir<strong>in</strong>g cases settle, while just under six percent go to trial.figure 5.4 :percent outcomes bydiscrim<strong>in</strong>ation issue allegedsettleddismissedsummary judgmenttrial-32-
STATUTESThe breakdown of outcomes by statute <strong>in</strong> Figure 5.5 shows no discernible divergence from the general outcome pattern withone exception. Cases brought under §1983 appear to end with substantially fewer settlements than the average for other statutes(44 vs. 54 percent) and with twice as many trials (11 percent compared to just under six percent average for other statutes).figure 5.5 :percent outcomes by statutesettleddismissedsummary judgmenttrial-33-
CAUSE OF ACTIONGiven the extreme disparity <strong>in</strong> the frequency of cases brought under the two general causes of action (disparate treatment andimpact), compar<strong>in</strong>g outcome percentages requires some caution. Nonetheless, Figure 5.6 repeats the same trends. Cases broughtunder each theory of discrim<strong>in</strong>ation are most likely to be settled, and <strong>in</strong> more or less equal proportions (54 percent for disparatetreatment cases, 55 percent for disparate impact cases). And both such cases are highly unlikely to reach the trial stage, aga<strong>in</strong>, <strong>in</strong>almost identical proportions (about five percent likelihood for each cause). To the extent there are any major differences betweenthe two causes, treatment cases appear somewhat more likely than impact cases to be dismissed (18 vs. 12 percent), and somewhatless likely to result <strong>in</strong> summary judgment (17 vs. 19 percent).figure 5.6 :percent outcomesby legal theorysettleddismissedsummary judgmenttrial-34-
PLAINTIFFS AND PLAINTIFF REPRESENTATIONIf an aggrieved<strong>in</strong>dividual canget just oneadditional personto jo<strong>in</strong> the suit,there may bea significantlygreater chanceof recover<strong>in</strong>gsometh<strong>in</strong>g thanis the casewhen a s<strong>in</strong>glecompla<strong>in</strong>antacts alone.Like legal theory just summarized, compar<strong>in</strong>g outcomes by the number of pla<strong>in</strong>tiffs <strong>in</strong> a case is problematic because of thetremendous frequency disparities. As noted earlier, 93 percent (n=1668) of all sampled cases <strong>in</strong>volved a s<strong>in</strong>gle compla<strong>in</strong>ant,just six percent of cases (n=111) had between two and ten pla<strong>in</strong>tiffs, and a m<strong>in</strong>iscule 0.5 percent of cases had more than ten (n=9).To the extent that comparisons are possible, however, there do appear to be some substantial differences between s<strong>in</strong>gle-pla<strong>in</strong>tiffcases and those that <strong>in</strong>volve between two and ten compla<strong>in</strong>ants. As shown <strong>in</strong> Figure 5.7, the latter cases have a substantially higherproportion of settlements (65 percent vs. 53 percent) and a substantially higher proportion of trials (n<strong>in</strong>e percent vs. five percent).Given that even this second category of cases is made up disproportionately of cases with exactly two pla<strong>in</strong>tiffs—which account fornearly 60 percent of all such cases—we might reasonably speculate that if an aggrieved <strong>in</strong>dividual can get just one additionalperson to jo<strong>in</strong> the suit, there may be a significantly greater chance of recover<strong>in</strong>g someth<strong>in</strong>g than is the case when a s<strong>in</strong>glecompla<strong>in</strong>ant acts alone.figure 5.7 :percent of case outcomesby number of pla<strong>in</strong>tiffssettleddismissedsummary judgmenttrial-35-
LEGAL REPRESENTATIONDismissal isthe most likelyoutcome when thecompla<strong>in</strong>ant filespro se, account<strong>in</strong>gfor a enormous 40percent of all suchcases (compared toan 11 percentdismissal ratewhen thepla<strong>in</strong>tiff hasrepresentation).Whether or not a pla<strong>in</strong>tiff files a compla<strong>in</strong>t pro se appears to be one of the few case characteristics that diverges greatly from thegeneral outcome pattern shown repeatedly throughout the preced<strong>in</strong>g sections. As illustrated <strong>in</strong> Figure 5.8, outright dismissal isthe most likely outcome when the compla<strong>in</strong>ant files pro se, account<strong>in</strong>g for an enormous 40 percent of all such cases (comparedto an 11 percent dismissal rate when the pla<strong>in</strong>tiff has representation). Moreover, just 24 percent of pro se cases end <strong>in</strong> settlement,compared to 63 percent when the pla<strong>in</strong>tiff has an attorney. However, legal representation does not seem to affect the likelihoodof go<strong>in</strong>g to trial (about 5.5 percent for both categories). There appears to be an obvious lesson here: when an aggrieved <strong>in</strong>dividualseeks redress for alleged discrim<strong>in</strong>ation, some type of representation is absolutely essential.figure 5.8 :percentage of caseoutcomes by legal representationsettleddismissedsummary judgmenttrial-36-
pilf casesJust 20(well under1 percent) cases<strong>in</strong> our entiresample werecertifiedclass actions.Because the sample frequencies are so small (n=11), we cannot say anyth<strong>in</strong>g def<strong>in</strong>itive about the impact of Public Interest LawFirm representation. Nonetheless, it is <strong>in</strong>terest<strong>in</strong>g to note (figure not shown) that of these 11 cases, 73 percent of them ended <strong>in</strong> asettlement (as opposed to 53% for cases without PILF <strong>in</strong>volvement), and n<strong>in</strong>e percent went to trial (compared to 5.5 percent fornon-PILF cases). Aga<strong>in</strong>, however, these are not mean<strong>in</strong>gful comparisons because of extreme frequency disparities.class actionsJust 20 cases <strong>in</strong> our entire sample were certified class actions. Interest<strong>in</strong>gly, only two outcomes were observed (figure not shown).70 percent of class action cases (n=14) ended <strong>in</strong> settlement, whereas 20 percent (n=4) resulted <strong>in</strong> summary judgment for theemployer (the additional ten percent of cases [n=2] were still pend<strong>in</strong>g).-37-
COLLECTIVE LEGAL MOBILIZATION AND EDL OUTCOMESTurn<strong>in</strong>g to the collective legal mobilization variable we created and first explored <strong>in</strong> Part three, Figure 5.9 displays outcomepercentages for cases that have more than one pla<strong>in</strong>tiff, are class actions, and/or <strong>in</strong>volve PILF representation. The data suggeststhat pla<strong>in</strong>tiffs do somewhat better when their case <strong>in</strong>cludes a collective action component. Settlements are more likely (63 vs. 53percent), as are trials (n<strong>in</strong>e vs. five percent). Moreover, cases are substantially less likely to be dismissed (four vs. 19 percent), andslightly less likely to result <strong>in</strong> summary judgment for the employer (13 vs. 17 percent).figure 5.9 :percent of case outcomesby collective action statussettleddismissedsummary judgmenttrial-38-
THE EEOCAs shown earlier, the EEOC does not often rule on the merits of a claim one way or the other prior to the fil<strong>in</strong>g of aprivate lawsuit. But when it does make a f<strong>in</strong>d<strong>in</strong>g, it is a rather strong predictor of how the case will conclude <strong>in</strong> district court.Figure 5.10 shows clearly that the likelihood of a settlement is significantly higher when the EEOC previously made af<strong>in</strong>d<strong>in</strong>g <strong>in</strong> support of the pla<strong>in</strong>tiff (59 percent of such cases) than when it did not f<strong>in</strong>d the claim to have merit (33 percent).Conversely, pro-employer outcomes—dismissal or summary judgment—are far more likely when the EEOC has not foundthe claim to have merit. However, trials appear to be equally likely for both scenarios (about seven percent).figure 5.10 :percent case outcomesby eeoc determ<strong>in</strong>ationsettleddismissedsummary judgmenttrial-39-
F<strong>in</strong>ally, we exam<strong>in</strong>ed EDL outcomes for cases <strong>in</strong> which the EEOC acted as pla<strong>in</strong>tiff. Although the frequency of such cases isextremely small (48, or three percent of our sample), settlement is almost always the outcome, account<strong>in</strong>g for 85 percent of allsuch cases (compared to 54 percent for all cases). The likelihood of a trial <strong>in</strong> EEOC-as-pla<strong>in</strong>tiff cases is about the same as thatfor all cases (six versus five percent, respectively), while dismissals and summary judgments are far less likely when the EEOC<strong>in</strong>tervenes (two percent each, compared to 18 and 16 percent, respectively across all cases).figure 5.11 :percent outcomes whenthe eeoc <strong>in</strong>tervenes as pla<strong>in</strong>tiff(n=48)-40-
TRIALS AND APPEALSAs is clear from previous sections and figures, EDL cases rarely go to trial. Nonetheless, because trials are often the most dramaticand publicized events <strong>in</strong> EDL law, and because trials have at least the potential to yield far-reach<strong>in</strong>g remedies for discrim<strong>in</strong>ationvictims, we explored how pla<strong>in</strong>tiffs fared when a case did reach a judge or jury. The answer is straightforward: not particularly well.As depicted <strong>in</strong> Figure 5.12, employers are significantly more likely than the pla<strong>in</strong>tiff to w<strong>in</strong> at trial (58 vs. 24 percent). A smallpercentage of cases ended <strong>in</strong> mixed verdicts (four percent), whereas no verdict was rendered <strong>in</strong> 14 percent of trials. These casesmay not have been complete at the time of cod<strong>in</strong>g.Judges decide about 25 percent of EDL cases, juries 68 percent, and magistrates 7 percent (not shown <strong>in</strong> figures), but do differentdecision makers affect outcomes? Figure 5.13 demonstrates that decision makers do affect outcomes. In cases decided by judges,defendants are nearly twice as likely to prevail. Conversely, juries f<strong>in</strong>d for the pla<strong>in</strong>tiff over 30 percent of the time whereas judgesdecide <strong>in</strong> favor of pla<strong>in</strong>tiffs less than 7 percent of the time.F<strong>in</strong>ally, some cases are appealed. While the numbers are very small, only 242 cases <strong>in</strong> our sample, trial court outcomes are revered<strong>in</strong> only 12 percent of cases. Appellate judges are most likely to uphold the trial court decision, as shown <strong>in</strong> figure 5.14.figure 5.12 :trial outcomes by percent(n=122)-41-
figure 5.13 :percent trial resultsby jury, judge, or magistratefor pla<strong>in</strong>tifffor defendantmixedno verdictfigure 5.14 :<strong>in</strong>itial appeal outcome by percent(n=242)-42-
Part 6 | Time TrendsOur f<strong>in</strong>al section explores time trends <strong>in</strong> EDL cases for the 1987-2003 period, focus<strong>in</strong>g on three major case characteristics:discrim<strong>in</strong>ation type alleged, discrim<strong>in</strong>atory issue alleged, and outcomes.DISCRIMINATION TYPEFigure 6.1 plots the proportion of EDL cases that alleged race, sex, age, and disability discrim<strong>in</strong>ation from 1987-2003,broken down by our four discrete time periods.figure 6.1 :percent of cases alleg<strong>in</strong>gdiscrim<strong>in</strong>ation type by time periodracesexagedisability-43-
aceAllegations of race discrim<strong>in</strong>ation peaked dur<strong>in</strong>g the 1987-92 period, decl<strong>in</strong>ed steadily dur<strong>in</strong>g the Cl<strong>in</strong>ton years (1993-2000),then rose aga<strong>in</strong> <strong>in</strong> the early 2000s. Moreover, with the exception of the 1997-2000 period, race discrim<strong>in</strong>ation made up thehighest percentage of all EDL cases <strong>in</strong> each of the rema<strong>in</strong><strong>in</strong>g time periods.sexAllegations of sex discrim<strong>in</strong>ation more or less show the mirror image of race. Sex cases rose steadily between 1993 and 2000,then began to tail off <strong>in</strong> the early 2000s. And as noted, sex allegations eclipsed race allegations <strong>in</strong> the 1997-2000 period.ageAfter peak<strong>in</strong>g dur<strong>in</strong>g the 1987-1992 time period (account<strong>in</strong>g for about 30 percent of EDL cases) claims of age discrim<strong>in</strong>ationabruptly decl<strong>in</strong>ed, then leveled off. S<strong>in</strong>ce 1993, allegations of age discrim<strong>in</strong>ation dipped to about 20 percent of EDL cases,and have rema<strong>in</strong>ed virtually unchanged through 2003.disabilityCases <strong>in</strong>volv<strong>in</strong>g disability discrim<strong>in</strong>ation shot up from about eight percent from 1987-1992 to 24 percent <strong>in</strong> the 1993-97 period.Undoubtedly, much of this <strong>in</strong>crease is attributable to passage of the <strong>American</strong>s with Disabilities Act <strong>in</strong> 1990. Even so, similar toage discrim<strong>in</strong>ation cases , the proportion of EDL cases alleg<strong>in</strong>g disability bias held steady after 1992, account<strong>in</strong>g for about 22-24percent of cases post-1992.-44-
DISCRIMINATION ISSUEFigure 6.2 displays changes <strong>in</strong> discrim<strong>in</strong>atory issues alleged over our time frame. Noteworthy is the general stability of the data,with a few exceptions. Proportions of cases claim<strong>in</strong>g pay, promotion, and hir<strong>in</strong>g discrim<strong>in</strong>ation varied very little for the entire1987-2003 period. Allegations of discrim<strong>in</strong>atory fir<strong>in</strong>g—by far the most common EDL issue claim—are also generally stable,except<strong>in</strong>g a slight dip observed <strong>in</strong> the 1997-2000 period. Sexual harassment is the one discrim<strong>in</strong>atory issue that shows morevolatility. Harassment claims rose steadily between 1987 and 2000 (from around ten percent to a peak of about 25 percentof EDL cases), before dipp<strong>in</strong>g to 17 percent <strong>in</strong> the 2001-03 period.figure 6.2 :percent of discrim<strong>in</strong>atoryissue alleged by time periodhir<strong>in</strong>gfir<strong>in</strong>gpaypromotionsexual harassment-45-
OUTCOMESTrials—<strong>in</strong>variably theleast commonEDL outcome—become<strong>in</strong>creas<strong>in</strong>gly<strong>in</strong>frequentthroughout theentire 1987-2003period.Figure 6.3 shows changes <strong>in</strong> EDL outcomes over time. Each outcome—settlement, dismissal, summary judgment, and trial—reveals a degree of volatility. Settlements <strong>in</strong>creased steadily between 1987 and 2000, before decreas<strong>in</strong>g somewhat sharplybetween 2001-03. Proportions of dismissals and summary judgments stay steady until 2001-03, after which they diverge <strong>in</strong>opposite directions: dismissals go up while summary judgments substantially decrease. And f<strong>in</strong>ally, trials—<strong>in</strong>variably the leastcommon EDL outcome—become <strong>in</strong>creas<strong>in</strong>gly <strong>in</strong>frequent throughout the entire 1987-2003 period. Indeed, after account<strong>in</strong>gfor about 12 percent of all outcome between 1987-92, by 2001-03, that proportion had dropped dramatically to just overone percent of EDL outcomes.figure 6.3 :percent of outcomesby time periodsettleddismissedsummary judgmenttrial-46-
Part 7 | ConclusionOnly through the systematic sampl<strong>in</strong>g of case fil<strong>in</strong>gs, such as that employed <strong>in</strong> this study, is it possible to understand how employmentcivil rights litigation operates. Our f<strong>in</strong>d<strong>in</strong>gs rebut many misconceptions about discrim<strong>in</strong>ation litigation. Most fundamental,we f<strong>in</strong>d that EDL overwhelm<strong>in</strong>gly consists of cases brought by <strong>in</strong>dividual pla<strong>in</strong>tiffs (not class actions, multiple pla<strong>in</strong>tiff cases, orlawsuits by the EEOC or public <strong>in</strong>terest organizations). These <strong>in</strong>dividuals overwhelm<strong>in</strong>gly compla<strong>in</strong> of disparate treatment, ratherthan compla<strong>in</strong> about employer policies as would be the subject of disparate impact cases. A significant percentage of cases arebrought by pla<strong>in</strong>tiffs who do not have the benefit of counsel, and these pla<strong>in</strong>tiffs have their cases dismissed forty percent of thetime. Those claims that are brought by a class, multiple pla<strong>in</strong>tiffs, or the EEOC enjoy much greater chance of success. The mostcommon outcome of a lawsuit is settlement. A significant percentage of pla<strong>in</strong>tiffs lose through a defendant’s motion for summaryjudgment. Very few cases proceed to trial. Pla<strong>in</strong>tiffs prevail <strong>in</strong> less than one-third of trials.Despite some variation across types of legal claims; the time period <strong>in</strong> which a case was brought; the federal district <strong>in</strong> which acase was brought; and the race, gender, age, and disability status of pla<strong>in</strong>tiffs, these patterns are remarkably similar across cases.-47-
Appendix I | MethodologyThis report is based on a random sample of employment civil rights cases filed <strong>in</strong> federal courts between 1988 and 2003.We drew random samples of federal employment civil rights cases from seven regionally diverse federal districts: Atlanta,Chicago, Dallas, New Orleans, New York City, Philadelphia, and San Francisco. These districts conta<strong>in</strong> about 20% of allfil<strong>in</strong>gs, capture variation <strong>in</strong> legal and social context, and, for cost considerations, are located close to federal recordsdepositories. The sample was drawn from the list of all civil employment discrim<strong>in</strong>ation cases filed <strong>in</strong> these districts from1987 to 2003 compiled by the Adm<strong>in</strong>istrative Office of the U.S. <strong>Court</strong>s (AOUSC). We randomly selected 300 cases fromeach district over the time period, yield<strong>in</strong>g a sample of 2,100 cases and derived sampl<strong>in</strong>g weights by district based on the totalnumber of employment discrim<strong>in</strong>ation case fil<strong>in</strong>gs <strong>in</strong> each district. Some cases were miss<strong>in</strong>g key variables, produc<strong>in</strong>g a f<strong>in</strong>alsample for analysis of 1,788 cases. The results presented here are not weighted by district.We developed an extensive cod<strong>in</strong>g form and tra<strong>in</strong>ed teams of coders for each site. The same data collection manager supervisedand tra<strong>in</strong>ed coders <strong>in</strong> each location. 10% of the cases were coded <strong>in</strong>dependently by different coders to allow tests of <strong>in</strong>tercoderreliability. In 94% of cases there was agreement between coders on case outcome.Manually cod<strong>in</strong>g a random sample of case fil<strong>in</strong>gs provides far more valid and representative data, but the approach faces somelimitations. Publicly available files can be <strong>in</strong>complete due to misfil<strong>in</strong>g or poor record keep<strong>in</strong>g. Files also can be substantivelyambiguous even when “complete” because the file itself, like the case it represents, is constructed through an adversarial process.That is to say, documents filed by the pla<strong>in</strong>tiff and the defendant may (and usually do) allege contradictory stories.-48-
Quotes will gohere. Quotes willgo here. Quoteswill go here.Quotes will gohere. Quotes willgo here. Quoteswill go here.Quotes willAMERICAN BAR FOUNDATION750 N. Lake Shore Drive, 4th Floor, Chicago, IL 60611*This is where the footnote copy goes for the above paragraph.-0-