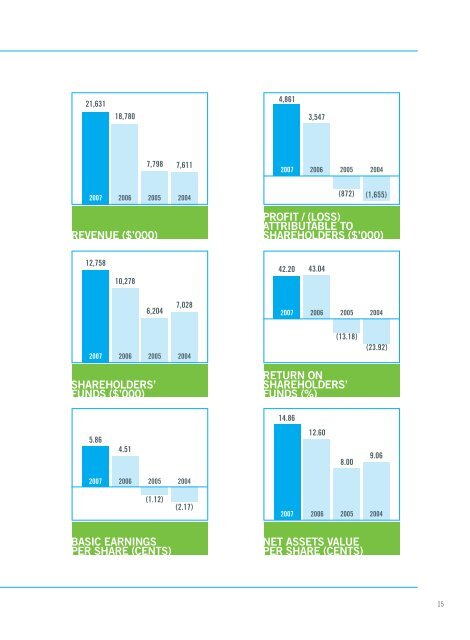
FINANCIALHIGHLIGHTSFY<strong>2007</strong> FY2006 FY2005 FY2004Financial Results ($’000)Revenue 21,631 18,780 7,798 7,611Gross Profit 12,141 10,013 2,677 1,429Profit / (loss) before tax 6,076 4,598 (659) (1,684)Profit / (loss) after tax ,247 3,913 (770) (1,684)Minority interest 386 366 102 29Profit / (loss) attributable to shareholders 4,861 3,547 (872) (1,655)Balance Sheet ($’000)Property, plant and equipment 7,167 6,659 6,607 ,418Cash and cash equivalents 7,400 4,662 1,048 2,000Current assets 14,847 11,015 4,069 ,893Total assets 22,562 18,393 10,829 11,469Current liabilities 7,632 ,794 2,850 2,988Total liabilities 9,006 7,068 4,344 4,441Working capital 7,21 ,221 1,219 2,905Shareholders’ funds 12,758 10,278 6,204 7,028RatiosCurrent ratio (times) 1.95 1.90 1.43 1.97Return on shareholders’ funds (%)* 42.20 43.04 (13.18) (23.92)Returns on assets (%)* 23.74 24.28 (7.82) (16.89)Basic earnings per share (cents) .86 4.51 (1.12) (2.17)Net assets value per share (cents) 14.86 12.60 8.00 9.06Debt / Equity ratio (net of cash) (times) (0.42) (0.25) 0.23 0.01* In calculating return on shareholders’ funds and return on assets, the average basis has been used.14 • <strong>ecoWise</strong> <strong>Holdings</strong> <strong>Limited</strong> • <strong>Annual</strong> <strong>Report</strong> <strong>2007</strong>
21,63118,7804,8613,5477,7987,611<strong>2007</strong> 2006 20052004<strong>2007</strong> 2006 2005 2004(872)(1,655)REVENUE ($’000)PROFIT / (LOSS)ATTRIBUTABLE TOSHAREHOLDERS ($’000)12,75810,27842.20 43.046,2047,028<strong>2007</strong> 2006 20052004<strong>2007</strong> 2006 2005 2004SHAREHOLDERS’FUNDS ($’000)(13.18)RETURN ONSHAREHOLDERS’FUNDS (%)(23.92)14.865.864.5112.608.009.06<strong>2007</strong> 2006 20052004(1.12)(2.17)<strong>2007</strong> 2006 20052004BASIC EARNINGSPER SHARE (CENTS)NET ASSETS VALUEPER SHARE (CENTS)15