PDF - 359KB - Truworths
PDF - 359KB - Truworths
PDF - 359KB - Truworths

You also want an ePaper? Increase the reach of your titles
YUMPU automatically turns print PDFs into web optimized ePapers that Google loves.
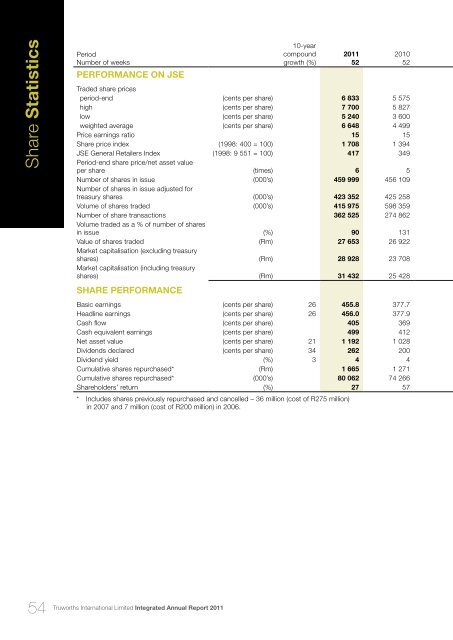
Share StatisticsPeriodNumber of weeksPERFORMANCE ON JSE10-yearcompoundgrowth (%)201152201052Traded share pricesperiod-end (cents per share) 6 833 5 575high (cents per share) 7 700 5 827low (cents per share) 5 240 3 600weighted average (cents per share) 6 648 4 499Price earnings ratio 15 15Share price index (1998: 400 = 100) 1 708 1 394JSE General Retailers Index (1998: 9 551 = 100) 417 349Period-end share price/net asset valueper share (times) 6 5Number of shares in issue (000’s) 459 999 456 109Number of shares in issue adjusted fortreasury shares (000’s) 423 352 425 258Volume of shares traded (000’s) 415 975 598 359Number of share transactions 362 525 274 862Volume traded as a % of number of sharesin issue (%) 90 131Value of shares traded (Rm) 27 653 26 922Market capitalisation (excluding treasuryshares) (Rm) 28 928 23 708Market capitalisation (including treasuryshares) (Rm) 31 432 25 428SHARE PERFORMANCEBasic earnings (cents per share) 26 455.8 377.7Headline earnings (cents per share) 26 456.0 377.9Cash flow (cents per share) 405 369Cash equivalent earnings (cents per share) 499 412Net asset value (cents per share) 21 1 192 1 028Dividends declared (cents per share) 34 262 200Dividend yield (%) 3 4 4Cumulative shares repurchased* (Rm) 1 665 1 271Cumulative shares repurchased* (000’s) 80 062 74 266Shareholders’ return (%) 27 57* Includes shares previously repurchased and cancelled – 36 million (cost of R275 million)in 2007 and 7 million (cost of R200 million) in 2006.54<strong>Truworths</strong> International Limited Integrated Annual Report 2011