PDF - 359KB - Truworths
PDF - 359KB - Truworths
PDF - 359KB - Truworths

Create successful ePaper yourself
Turn your PDF publications into a flip-book with our unique Google optimized e-Paper software.
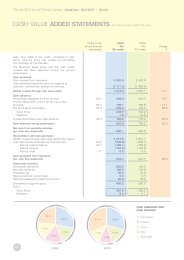
ANALYSIS OF FINANCIAL PERFORMANCESTATEMENTS OF COMPREHENSIVE INCOMEThe following review of the Group’s financial performance for the 52-week period ended 26 June 2011 should be readtogether with the audited abridged financial statements which follow on pages 118 to 126, and the supplementaryinformation contained in the audited annual financial statements which are available on the Group’s website.Sale of merchandiseGroup sale of merchandise, comprising retail and franchise sales, and after accounting reclassifications, increased13% to R7.9 billion (2010: R6.9 billion). Sales for the first half (H1) of the period increased by 15% and slowed togrowth of 12% in the second half (H2). Historically there has been no material seasonal variation in trading patternsbetween the first and second halves of the financial period.Divisional sales2011Rm2010RmChange onprior period%2011 H1% change2011 H2% change<strong>Truworths</strong> ladieswear 3 068 2 727 13 14 11<strong>Truworths</strong> menswear 1 581 1 372 15 18 13Identity 1 127 966 17 15 19Daniel Hechter 972 871 12 13 9Elements 403 385 5 8 1Inwear 386 355 9 11 6LTD 312 247 26 31 20Other* 231 195 18 28 9Retail sales 8 080 7 118 14 15 12Franchise sales 35 30 17 6 33Accounting reclassifications (257) (211) 22 33 11Sale of merchandise 7 858 6 937 13 15 12YDE agency sales 250 238 5 8 2* Includes cellular phone, <strong>Truworths</strong> Jewellery and <strong>Truworths</strong> Living divisions.Retail sales grew by 14% to R8.1 billion (2010: R7.1 billion), with comparable store retail sales increasing by 9%(2010: 4%). Credit retail sales increased by 16% to R5.7 billion (2010: R5.0 billion) and cash retail sales were 9%higher at R2.4 billion (2010: R2.2 billion). Credit retail sales accounted for 71% (2010: 70%) of retail sales for theperiod.Product inflation remained low in the first six months and averaged approximately 1% for the first half,before increasing to 7% for the second half, and averaging 4% for the full financial period (2010: 4%).Trading space increased by 5% to approximately 256 000 m² following the opening of 20 (net) new storesand the extension, upgrading or relocation of a further 32 stores. The Group’s trading density increased 8% toR32 979 per m².Retail sales growthanalysisRetail salesRmRetail salesgrowth%Comparablestore growth%Productinflation%Unit growth:comparablestores%Unit growth:new stores%June 2011 8 080 14 9 4 5 5June 2010 7 118 11 4 4 – 7June 2009 6 441 12 5 10 (5) 7June 2008 5 751 13 6 6 – 7June 2007 5 087 26 17 4 13 9Franchise sales recovered after a challenging period in 2010 and increased by 17% to R35 million. The franchisenetwork was expanded to 18 stores following the opening of <strong>Truworths</strong> stores in Zambia and Kenya during theperiod. Refer to the Store Report for further information on page 80.<strong>Truworths</strong> International Limited Integrated Annual Report 201145