Contents
Contents
Contents
- No tags were found...

Create successful ePaper yourself
Turn your PDF publications into a flip-book with our unique Google optimized e-Paper software.
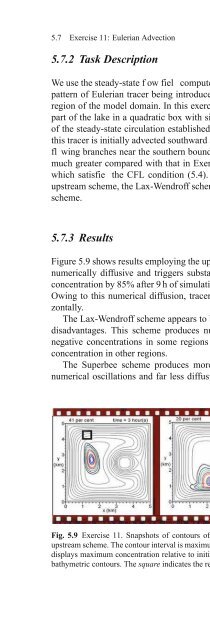
5.7 Exercise 11: Eulerian Advection 1075.7.2 Task DescriptionWe use the steady-state f ow fiel computed in Exercise 10 to predict the movementpattern of Eulerian tracer being introduced at a concentration of unity in a certainregion of the model domain. In this exercise, tracer is released in the northwesternpart of the lake in a quadratic box with side lengths of 0.5 km. With an inspectionof the steady-state circulation established in the lake (see Fig. 5.8), we expect thatthis tracer is initially advected southward and separates into westward and eastwardfl wing branches near the southern boundary. With “frozen” dynamics, a time stepmuch greater compared with that in Exercise 10 can be used. I used Δt = 200 s,which satisfie the CFL condition (5.4). Advection schemes being tested are theupstream scheme, the Lax-Wendroff scheme, the Superbee scheme and the Super-Cscheme.5.7.3 ResultsFigure 5.9 shows results employing the upstream scheme. This scheme is extremelynumerically diffusive and triggers substantial artificia decrease of the maximumconcentration by 85% after 9 h of simulation corresponding to 162 simulation steps.Owing to this numerical diffusion, tracer concentration is vigorously mixed horizontally.The Lax-Wendroff scheme appears to be less diffusive (Fig. 5.10), but has otherdisadvantages. This scheme produces numerical oscillations, leading to slightlynegative concentrations in some regions and concentrations exceeding the initialconcentration in other regions.The Superbee scheme produces more convincing results (Fig. 5.11) void ofnumerical oscillations and far less diffusive compared with the upstream scheme.Fig. 5.9 Exercise 11. Snapshots of contours of tracer concentration (coloured lines) using theupstream scheme. The contour interval is maximum tracer concentration divided by 10. The headerdisplays maximum concentration relative to initial concentration in per cent. Thin black lines arebathymetric contours. The square indicates the release area of the tracer