Stroke volume variation does not predict fluid responsiveness in ...
Stroke volume variation does not predict fluid responsiveness in ...
Stroke volume variation does not predict fluid responsiveness in ...

You also want an ePaper? Increase the reach of your titles
YUMPU automatically turns print PDFs into web optimized ePapers that Google loves.
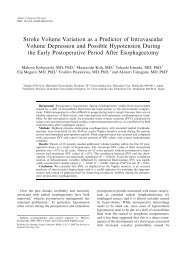
Acta Anaesthesiol Scand 2006; 50: 1068–1073<br />
Pr<strong>in</strong>ted <strong>in</strong> S<strong>in</strong>gapore. All rights reserved<br />
<strong>Stroke</strong> <strong>volume</strong> <strong>variation</strong> <strong>does</strong> <strong>not</strong> <strong>predict</strong> <strong>fluid</strong><br />
<strong>responsiveness</strong> <strong>in</strong> patients with septic shock<br />
on pressure support ventilation<br />
A. PERNER 1 and T. FABER 2<br />
1 Department of Anaesthesia, Rigshospitalet and 2 Herlev Hospital, University of Copenhagen, Copenhagen, Denmark<br />
Background: <strong>Stroke</strong> <strong>volume</strong> <strong>variation</strong> (SVV) – as measured by<br />
the pulse contour cardiac output (PiCCO Ò ) system – <strong>predict</strong>s the<br />
cardiac output response to a <strong>fluid</strong> challenge <strong>in</strong> patients on<br />
controlled ventilation. Whether this applies to patients on pressure<br />
support ventilation is unknown.<br />
Methods: Thirty consecutive patients with septic shock were<br />
<strong>in</strong>cluded. All were on pressure support ventilation, monitored<br />
us<strong>in</strong>g the PiCCO Ò system and receiv<strong>in</strong>g 500 ml of colloid on<br />
cl<strong>in</strong>ical <strong>in</strong>dications. Arterial pulse contour SVV and the transpulmonary<br />
thermodilution cardiac <strong>in</strong>dex were measured before<br />
and after <strong>fluid</strong> challenge.<br />
Results: Forty-seven per cent of the patients were def<strong>in</strong>ed as <strong>fluid</strong><br />
responders by an observed <strong>in</strong>crease of > 10% <strong>in</strong> the cardiac <strong>in</strong>dex<br />
after <strong>fluid</strong>. Prior to <strong>fluid</strong> challenge, the cardiac <strong>in</strong>dex was lower <strong>in</strong><br />
responders compared with non-responders (mean SD, 3.0 0.6<br />
vs. 4.0 1.2 l/m<strong>in</strong>/m 2 , P < 0.01). In contrast, pre-<strong>in</strong>fusion values<br />
THERE are few safe and effective methods to guide<br />
<strong>fluid</strong> resuscitation. The traditionally used cardiac<br />
fill<strong>in</strong>g pressures do <strong>not</strong> <strong>predict</strong> <strong>fluid</strong> <strong>responsiveness</strong><br />
(i.e. an <strong>in</strong>crease <strong>in</strong> cardiac output on <strong>fluid</strong> challenge) <strong>in</strong><br />
critically ill patients (1). Alternative methods, which<br />
assess dynamic changes <strong>in</strong> cardiac stroke <strong>volume</strong><br />
dur<strong>in</strong>g controlled ventilation, may <strong>predict</strong> <strong>fluid</strong><br />
<strong>responsiveness</strong>. The pulse contour cardiac output<br />
system (PiCCO Ò ; Pulsion Medical Systems AG,<br />
Munich, Germany) calculates the stroke <strong>volume</strong> <strong>variation</strong><br />
(SVV) by cont<strong>in</strong>uous analysis of the arterial<br />
pulse contour. Variations <strong>in</strong> stroke <strong>volume</strong> may occur<br />
<strong>in</strong> the case of cardiac preload reserve, if preload is<br />
altered by the changes <strong>in</strong> pleural pressures dur<strong>in</strong>g<br />
ventilation (2). Several studies have shown that<br />
<strong>in</strong>creased SVV is a marker of <strong>fluid</strong> <strong>responsiveness</strong> <strong>in</strong><br />
critically ill patients (3–10), but all were performed <strong>in</strong><br />
patients on strictly controlled mechanical ventilation.<br />
This study was presented <strong>in</strong> part at the 18th Annual Congress of<br />
the European Society of Intensive Care <strong>in</strong> Amsterdam 2005.<br />
1068<br />
Copyright # Acta Anaesthesiol Scand 2006<br />
ACTA ANAESTHESIOLOGICA SCANDINAVICA<br />
doi: 10.1111/j.1399-6576.2006.01120.x<br />
of SVV were similar between subsequent responders and nonresponders<br />
(13 5vs.16 6%, P ¼ 0.26). The mean areas under the<br />
ROC curves were 0.77 (95% confidence <strong>in</strong>terval, 0.60–0.94) and<br />
0.52 (0.30–0.73) for pre-<strong>fluid</strong> cardiac <strong>in</strong>dex and SVV, respectively,<br />
<strong>in</strong>dicat<strong>in</strong>g a <strong>predict</strong>ive power of only the cardiac <strong>in</strong>dex.<br />
Conclusions: SVV did <strong>not</strong> <strong>predict</strong> the response <strong>in</strong> cardiac output<br />
to <strong>fluid</strong> challenge <strong>in</strong> patients with septic shock on pressure<br />
support ventilation.<br />
Accepted for publication 15 May 2006<br />
Key words: blood <strong>volume</strong>; cardiac output; plasma <strong>volume</strong><br />
expanders; septic shock; stroke <strong>volume</strong>.<br />
# Acta Anaesthesiologica Scand<strong>in</strong>avica (2006)<br />
In patients on pressure support ventilation, heart–<br />
lung <strong>in</strong>teractions are more complex, because the<br />
sw<strong>in</strong>gs <strong>in</strong> pleural pressures may be <strong>in</strong>sufficient to<br />
change cardiac preload even <strong>in</strong> <strong>fluid</strong> responsive<br />
patients. Moreover, the duration of respiratory cycle<br />
and tidal <strong>volume</strong>s are <strong>not</strong> fixed, which potentially<br />
hampers the use of any dynamic marker of <strong>fluid</strong><br />
<strong>responsiveness</strong>. On the other hand, there are no<br />
cl<strong>in</strong>ical data to reject the concept of dynamic <strong>volume</strong><br />
monitor<strong>in</strong>g <strong>in</strong> these patients.<br />
The aim of the present study was therefore to<br />
assess if SVV <strong>predict</strong>ed an <strong>in</strong>crease <strong>in</strong> cardiac output<br />
<strong>in</strong> response to <strong>fluid</strong> challenge <strong>in</strong> patients with septic<br />
shock on pressure support ventilation.<br />
Materials and methods<br />
The ethics committee of Copenhagen County<br />
approved the study. Consent was waived because<br />
all <strong>in</strong>terventions and measurements were cl<strong>in</strong>ically<br />
required.
Patients<br />
Patients were enrolled consecutively when meet<strong>in</strong>g<br />
the follow<strong>in</strong>g <strong>in</strong>clusion criteria: (i) persistent septic<br />
shock (11) 12 h after the <strong>in</strong>itial <strong>fluid</strong> resuscitation,<br />
(ii) stable s<strong>in</strong>us rhythm, (iii) mechanical ventilation via<br />
a cuffed endotracheal tube, (iv) monitored us<strong>in</strong>g the<br />
PiCCO Ò system on cl<strong>in</strong>ical <strong>in</strong>dication, and (v) due to<br />
receive a <strong>fluid</strong> bolus as decided by the treat<strong>in</strong>g<br />
cl<strong>in</strong>ician. The <strong>in</strong>dications for <strong>fluid</strong> challenge <strong>in</strong>cluded<br />
signs of hypoperfusion (cold extremities and/or susta<strong>in</strong>ed<br />
hyperlactatemia) or susta<strong>in</strong>ed need for norep<strong>in</strong>ephr<strong>in</strong>e.<br />
There were no exclusion criteria. All patients<br />
were ventilated with pressure support ventilation<br />
with or without supplementary bilevel positive airway<br />
pressure (BiPAP mode) (Evita XL; Dräger Medical AG,<br />
Lübeck, Germany). If required, patients were sedated<br />
by a cont<strong>in</strong>uous propofol <strong>in</strong>fusion supplemented with<br />
fentanyl if necessary. Source control had been obta<strong>in</strong>ed<br />
by antibiotics and/or dra<strong>in</strong>age, and all patients<br />
received hydrocortisone (300 mg/day). Norep<strong>in</strong>ephr<strong>in</strong>e<br />
was <strong>in</strong>fused to ma<strong>in</strong>ta<strong>in</strong> a mean arterial blood<br />
pressure above 70 mmHg, and if the cardiac <strong>in</strong>dex was<br />
below 2.5 l/m<strong>in</strong>/m 2 , dobutam<strong>in</strong>e was adm<strong>in</strong>istered<br />
to atta<strong>in</strong> this level. Immediately prior to the study, the<br />
motor activity assessment scale (MAAS) (12) and<br />
sequential organ failure assessment (SOFA) scores<br />
(13) were registered.<br />
Protocol<br />
A s<strong>in</strong>gle bolus of 500 ml of 6% Dextran 70 <strong>in</strong> sal<strong>in</strong>e<br />
was <strong>in</strong>fused over 30 m<strong>in</strong> with the patient positioned<br />
sup<strong>in</strong>e. Dur<strong>in</strong>g this period, no changes <strong>in</strong> ventilation,<br />
sedation or vasoactive treatments were performed,<br />
and no other <strong>fluid</strong>s were given except for nutrition.<br />
Immediately prior to and after the <strong>fluid</strong> adm<strong>in</strong>istration,<br />
the cardiac <strong>in</strong>dex was measured by transpulmonary<br />
thermodilution by repeated <strong>in</strong>jections of 20 ml<br />
of cold sal<strong>in</strong>e (4 8C) <strong>in</strong>to the superior caval ve<strong>in</strong> until<br />
three measurements with a <strong>variation</strong> of less than 10%<br />
had been obta<strong>in</strong>ed. The mean value of these three<br />
measurements was used <strong>in</strong> the analyses and registered<br />
with the concurrently displayed SVV. As the<br />
SVV value given on the monitor is a runn<strong>in</strong>g 30-s<br />
average, both the electrocardiogram and the pulse<br />
curve were observed and the SVV of the first 30-s<br />
period of stable cardiac rhythm was registered. This<br />
was done immediately after the thermodilution analysis<br />
to avoid potential drift of the calibration of the<br />
pulse contour analysis. In addition, heart rate, thermodilution<br />
stroke <strong>volume</strong> and <strong>in</strong>trathoracic blood<br />
<strong>volume</strong> <strong>in</strong>dexes, mean arterial blood pressure, ventilator<br />
modus, airway pressures, tidal <strong>volume</strong> and<br />
the dose of the cont<strong>in</strong>uously <strong>in</strong>fused drugs were<br />
registered. Fluid responders were def<strong>in</strong>ed as the<br />
patients who had an <strong>in</strong>crease <strong>in</strong> cardiac <strong>in</strong>dex of<br />
more than 10% after the <strong>fluid</strong> challenge, because the<br />
reproducibility of cardiac <strong>in</strong>dex measurements has<br />
been observed to be around 4% (14).<br />
Statistics<br />
The sample size was calculated (2a 0.05 and b 0.2) to<br />
detect a difference <strong>in</strong> SVV of 5% (SD 5%) between<br />
<strong>fluid</strong> responders and non-responders. This estimate<br />
was based on previous data <strong>in</strong> septic patients (3). The<br />
results are expressed as mean SD or 95% confidence<br />
<strong>in</strong>tervals (95% CI) and analyses were carried<br />
out us<strong>in</strong>g the Student’s t-tests for unpaired or paired<br />
variables or receiver operat<strong>in</strong>g characteristic (ROC)<br />
curve or l<strong>in</strong>ear regression analyses where appropriate.<br />
P-values less than 0.05 (two-tailed) were considered<br />
statistically significant.<br />
Results<br />
Patient characteristics are given <strong>in</strong> Table 1. All patients<br />
received norep<strong>in</strong>ephr<strong>in</strong>e, which was supplemented<br />
with dobutam<strong>in</strong>e <strong>in</strong> only two patients.<br />
Thirteen patients were sedated with propofol and<br />
seven received fentanyl, six of whom were treated<br />
with both drugs. All patients were ventilated with<br />
a positive end expiratory pressure (PEEP) of 5 cm<br />
H2O or greater and negative airway pressures were<br />
<strong>not</strong> observed dur<strong>in</strong>g the study.<br />
Table 1<br />
Patient characteristics.<br />
Gender (male/female) 18 (60)/12 (40)<br />
Age (years) 67 11<br />
SOFA score 13 3<br />
ICU mortality<br />
Source of sepsis<br />
16 (53)<br />
Pulmonary/abdom<strong>in</strong>al/ur<strong>in</strong>ary 15 (50)/12 (40)/2 (7)/1 (3)<br />
tract/uncerta<strong>in</strong><br />
SVV <strong>in</strong> patients with septic shock<br />
Norep<strong>in</strong>ephr<strong>in</strong>e dose (mg/kg/m<strong>in</strong>) 0.17 0.17<br />
MAAS 1.3 1.0<br />
Propofol 13 (43)<br />
Dosage, mg/h, n ¼ 13 98 97<br />
Fentanyl 7 (23)<br />
Dosage, mg/h, n ¼ 7 0.1 0.03<br />
Ventilator sett<strong>in</strong>gs<br />
PSV/PSV þ BIPAP 16 (53)/14 (47)<br />
Peak pressure/PEEP, cmH 2O 25 10/11 4<br />
Tidal <strong>volume</strong>, ml/kg bodyweight 8.7 2.4<br />
Data are numbers of patients (percentages) or means SD, n ¼<br />
30. PSV, pressure support ventilation; BIPAP, bilevel positive<br />
airway pressure; MAAS, motor activity assessment scale; PEEP,<br />
positive end expiratory pressure; SOFA, sequential organ failure<br />
assessment.<br />
1069
A. Perner and T. Faber<br />
Fourteen patients (47%) were <strong>fluid</strong> responders and<br />
these had a lower basel<strong>in</strong>e cardiac <strong>in</strong>dex compared<br />
with the 16 (53%) non-responders (Table 2). In contrast,<br />
SVV prior to <strong>fluid</strong> challenge was <strong>not</strong> different <strong>in</strong><br />
<strong>fluid</strong> responders and non-responders (P ¼ 0.26, see<br />
Fig. 1 and Table 2). The area under the ROC curve<br />
(AUC) for the cardiac <strong>in</strong>dex was different from<br />
0.5 [mean (95% CI) 0.77 (0.60–0.94)] <strong>in</strong> contrast<br />
to AUC for SVV, which was 0.52 (0.30–0.73)<br />
(Fig. 2). SVV prior to <strong>fluid</strong> challenge was unrelated<br />
to the changes <strong>in</strong> cardiac <strong>in</strong>dex after <strong>fluid</strong> challenge<br />
(Fig. 3).<br />
The adm<strong>in</strong>istration of <strong>fluid</strong> <strong>in</strong>creased the mean<br />
arterial blood pressure <strong>in</strong> both groups whereas the<br />
<strong>in</strong>trathoracic blood <strong>volume</strong> <strong>in</strong>dex (ITBVI) only<br />
<strong>in</strong>creased <strong>in</strong> the <strong>fluid</strong> responders (Table 2). In contrast,<br />
SVV was unaltered by <strong>fluid</strong> (Table 2).<br />
For SVV, additional ROC curves were constructed<br />
for patients stratified for tidal <strong>volume</strong>s, PEEP or<br />
motor activity assessment scale (MAAS) above or<br />
below the overall mean values. The AUC’s were 0.52<br />
(0.19–0.85) and 0.63 (0.33–0.92) for tidal <strong>volume</strong>s<br />
below and above 8 ml/kg, respectively, 0.57 (0.30–<br />
0.83) and 0.58 (0.18–0.97) for PEEP below and above<br />
11 cm H2O, respectively, and 0.64 (0.34–0.94) and 0.58<br />
(0.27–0.89) for MAAS below 2 and MAAS of 2 or<br />
above, respectively.<br />
Discussion<br />
In patients with septic shock on pressure support<br />
ventilation, we found that SVV did <strong>not</strong> discrim<strong>in</strong>ate<br />
between those who would or would <strong>not</strong> <strong>in</strong>crease the<br />
cardiac <strong>in</strong>dex <strong>in</strong> response to a colloid challenge. In<br />
the present study, neither the group comparisons,<br />
ROC curve nor regression analysis showed any<br />
<strong>predict</strong>iveness of SVV for the response of the cardiac<br />
<strong>in</strong>dex to <strong>fluid</strong>. Moreover, similar results were obta<strong>in</strong>ed<br />
if patients were stratified by sedation scores or<br />
Table 2<br />
ventilation with high tidal <strong>volume</strong>s or high PEEP.<br />
The only <strong>predict</strong>or of <strong>fluid</strong> <strong>responsiveness</strong> <strong>in</strong> the<br />
present study was cardiac <strong>in</strong>dex. However, the<br />
sensitivity and specificity was low with values<br />
around 70% for a cut-off value of 3.3 l/m<strong>in</strong>/m 2 .<br />
In contrast to our observations, others have found<br />
that the SVV may <strong>predict</strong> <strong>fluid</strong> <strong>responsiveness</strong>. The<br />
reasons for these discrepancies are most likely differences<br />
<strong>in</strong> ventilation and sedation. The study by Marx<br />
and coworkers (3) is the only one on septic shock. In<br />
10 sedated patients on controlled ventilation, basel<strong>in</strong>e<br />
SVV correlated positively with the change <strong>in</strong><br />
cardiac output after <strong>fluid</strong> challenge. There are several<br />
studies on the <strong>predict</strong>iveness of SVV <strong>in</strong> the perioperative<br />
period. Patients have been assessed dur<strong>in</strong>g<br />
bra<strong>in</strong> surgery (4) and before (5,6,9,10) and after<br />
(7,8,10) cardiac surgery; all these patients were<br />
anaesthetized and on controlled ventilation. The<br />
majority of these studies found a <strong>predict</strong>ive power<br />
of SVV for <strong>fluid</strong> <strong>responsiveness</strong> either by group<br />
comparison or correlation analysis. The study by<br />
Wiesenack and colleagues (5) failed to show a relationship<br />
between basel<strong>in</strong>e SVV and the change <strong>in</strong><br />
cardiac <strong>in</strong>dex upon <strong>fluid</strong> load<strong>in</strong>g, but a group comparison<br />
was <strong>not</strong> made <strong>in</strong> that study. To our knowledge,<br />
the present study is the first to assess the<br />
validity of SVV as a marker of <strong>fluid</strong> <strong>responsiveness</strong><br />
<strong>in</strong> patients on pressure support ventilation. In addition,<br />
our patients were less sedated, but stratify<strong>in</strong>g<br />
the data by sedation scores did <strong>not</strong> improve the<br />
<strong>predict</strong>iveness of SVV. Although the secondary analyses<br />
carried a high risk of a type 2 error, it is likely<br />
that the mode of ventilation with trigger<strong>in</strong>g by<br />
spontaneous breath<strong>in</strong>g expla<strong>in</strong>s why SVV had no<br />
<strong>predict</strong>ive power <strong>in</strong> our patients. Other results may<br />
be obta<strong>in</strong>ed with the use of higher tidal <strong>volume</strong>s<br />
and airway pressures, which would <strong>in</strong>duce larger<br />
changes <strong>in</strong> pleural pressures and thereby cardiac<br />
preload. But aga<strong>in</strong>, our secondary analyses of<br />
Haemodynamic data and response to <strong>fluid</strong> challenge <strong>in</strong> subsequent <strong>fluid</strong> ‘responders’ and ‘non-responders’.<br />
Fluid ‘responders’, n ¼ 14 Fluid ‘non-responders’, n ¼ 16<br />
Basel<strong>in</strong>e After <strong>fluid</strong> Paired t-test Basel<strong>in</strong>e After <strong>fluid</strong> Paired t-test<br />
Heart rate (beats/m<strong>in</strong>) 92 16 91 17 P ¼ 0.64 98 14 97 13 P ¼ 0.16<br />
Mean arterial blood pressure (mmHg) 70 10 78 12 P ¼ 0.02 69 10 74 10 P ¼ 0.02<br />
Cardiac <strong>in</strong>dex (l/m<strong>in</strong>/m 2 ) 3.0 0.6* 3.7 0.6 P < 0.01 4.0 1.2 3.9 1.2 P ¼ 0.10<br />
<strong>Stroke</strong> <strong>volume</strong> <strong>in</strong>dex (ml/m 2 ) 35 11 42 12 P < 0.01 42 14 41 15 P ¼ 0.35<br />
Intrathoracic blood <strong>volume</strong> <strong>in</strong>dex (ml/m 2 ) 1059 149 1125 204 P < 0.01 1120 152 1099 185 P ¼ 0.43<br />
<strong>Stroke</strong> <strong>volume</strong> <strong>variation</strong> (%) 15 5 12 5 P ¼ 0.08 15 6 13 6 P ¼ 0.07<br />
Data are means SD.<br />
*P < 0.01 compared with the basel<strong>in</strong>e value of ‘non-responders’ us<strong>in</strong>g the unpaired Student’s t-test.<br />
1070
Fig. 1. Values of stroke <strong>volume</strong> <strong>variation</strong> (SVV) prior to <strong>fluid</strong><br />
challenge <strong>in</strong> patients with septic shock on pressure support<br />
ventilation. Patients who <strong>in</strong>creased more than 10% <strong>in</strong> the cardiac<br />
<strong>in</strong>dex after 500 ml of colloid were categorized as <strong>fluid</strong> ‘responders’<br />
and those who did <strong>not</strong> as ‘non-responders’. Dots and bars represent<br />
values of s<strong>in</strong>gle patients and means, respectively.<br />
patients ventilated with high tidal <strong>volume</strong>s or PEEP<br />
do <strong>not</strong> support this <strong>not</strong>ion.<br />
In the present study, all patients had undergone<br />
<strong>in</strong>itial blood <strong>volume</strong> resuscitation, and this may<br />
expla<strong>in</strong> why values of SVV were lower than previously<br />
observed <strong>in</strong> patients with sepsis (3). Nevertheless,<br />
half of our patients responded to <strong>fluid</strong>, and <strong>in</strong><br />
these patients the average <strong>in</strong>crease <strong>in</strong> cardiac <strong>in</strong>dex<br />
was 23%. The fact that half the patients had a very<br />
SVV <strong>in</strong> patients with septic shock<br />
significant <strong>in</strong>crease <strong>in</strong> cardiac <strong>in</strong>dex illustrates the<br />
difficulty of guid<strong>in</strong>g <strong>fluid</strong> therapy <strong>in</strong> septic patients<br />
who rema<strong>in</strong> on vasopressors after the <strong>in</strong>itial resuscitation.<br />
A recent study of experimental hemorrhagic<br />
shock showed that norep<strong>in</strong>ephr<strong>in</strong>e may blunt pulse<br />
pressure <strong>variation</strong> (15), which is a marker of SVV. In<br />
theory, this may <strong>not</strong> apply to SVV (16), but it is<br />
currently unknown if norep<strong>in</strong>ephr<strong>in</strong>e alters SVV as<br />
measured by pulse-contour analysis. If so, this could<br />
have affected our results.<br />
Intrathoracic blood <strong>volume</strong> <strong>in</strong>creased <strong>in</strong> <strong>fluid</strong> responders,<br />
but was unchanged <strong>in</strong> non-responders. This<br />
may be as a result of low sensitivity of the s<strong>in</strong>gle<br />
<strong>in</strong>dicator technique of <strong>in</strong>trathoracic blood <strong>volume</strong><br />
measurement for the detection of changes. Alternatively,<br />
rapid extravasation of <strong>fluid</strong> may have<br />
occurred <strong>in</strong> the non-responders. Also, mathematical<br />
coupl<strong>in</strong>g may contribute, because <strong>in</strong>trathoracic blood<br />
<strong>volume</strong> and cardiac <strong>in</strong>dex is calculated from the same<br />
thermodilution curve. On the other hand, it can<strong>not</strong> be<br />
excluded that the non-responders had to be filled<br />
more if they were to <strong>in</strong>crease <strong>in</strong> cardiac output, which<br />
questions the use of a fixed <strong>fluid</strong> bolus to all patients.<br />
A fixed <strong>volume</strong> was chosen, because there are no firm<br />
data to support the design of a titration protocol.<br />
Moreover, studies of related methods <strong>in</strong> patients with<br />
septic shock have used a fixed <strong>fluid</strong> bolus (17,18).<br />
Interest<strong>in</strong>gly, we found a small <strong>in</strong>crease <strong>in</strong> blood<br />
pressure on <strong>fluid</strong> challenge even <strong>in</strong> patients classified<br />
Fig. 2. Receiver operat<strong>in</strong>g characteristic curves for the ability of cardiac <strong>in</strong>dex (CI, dashed l<strong>in</strong>e with open dots) and stroke <strong>volume</strong> <strong>variation</strong><br />
(SVV, solid l<strong>in</strong>e with solid dots) prior to <strong>fluid</strong> challenge to discrim<strong>in</strong>ate between responders and non-responders to <strong>fluid</strong> challenge. The areas<br />
under the curves were 0.77 (P ¼ 0.01, compared with an area of 0.5) for the cardiac <strong>in</strong>dex and 0.51 (P ¼ 0.90) for stroke <strong>volume</strong> <strong>variation</strong><br />
(SVV).<br />
1071
A. Perner and T. Faber<br />
Fig. 3. Relationship <strong>in</strong> patients with septic shock on pressure support ventilation between stroke <strong>volume</strong> <strong>variation</strong> (SVV) prior to <strong>fluid</strong><br />
challenge and the subsequent change <strong>in</strong> cardiac <strong>in</strong>dex (Ä-CI) caused by 500 ml of colloid. Dots represent values of s<strong>in</strong>gle patients. No<br />
statistically significant relationship was found by l<strong>in</strong>ear regression analysis (P ¼ 0.86).<br />
as non-responders as observed by others (4,19).<br />
Vascular tone is probably <strong>not</strong> affected by <strong>fluid</strong><br />
load<strong>in</strong>g, suggest<strong>in</strong>g that errors <strong>in</strong> cardiac output<br />
measurements or spontaneous changes may have<br />
occurred <strong>in</strong> some patients. Also the stratification<br />
us<strong>in</strong>g a fixed cut-off value for the <strong>in</strong>crease <strong>in</strong> cardiac<br />
<strong>in</strong>dex may have contributed. Although there is no<br />
def<strong>in</strong>ite answer to expla<strong>in</strong> this unexpected f<strong>in</strong>d<strong>in</strong>g,<br />
this may also happen <strong>in</strong> everyday cl<strong>in</strong>ical life. Thus<br />
the addition of <strong>in</strong>dependent measures, such as central<br />
venous oxygen saturation, may be of value, but<br />
this should be confirmed <strong>in</strong> future studies.<br />
F<strong>in</strong>ally, the 30 s used by the PiCCO Ò system to<br />
calculate SVV may <strong>in</strong>clude confound<strong>in</strong>g <strong>variation</strong>s <strong>in</strong><br />
tidal <strong>volume</strong>s or airway pressures. If so, assessment<br />
with<strong>in</strong> a s<strong>in</strong>gle respiratory cycle or averag<strong>in</strong>g of these<br />
confounders by calculat<strong>in</strong>g SVV over an even longer<br />
time period may improve its performance <strong>in</strong> patients<br />
on pressure support ventilation. These matters<br />
deserve further study, but until then we recommend<br />
that cl<strong>in</strong>icians do <strong>not</strong> use SVV to guide <strong>fluid</strong> resuscitation<br />
<strong>in</strong> patients on pressure support ventilation.<br />
References<br />
1. Bendjelid K, Romand JA. Fluid <strong>responsiveness</strong> <strong>in</strong> mechanically<br />
ventilated patients: a review of <strong>in</strong>dices used <strong>in</strong> <strong>in</strong>tensive<br />
care. Intensive Care Med 2003; 29: 352–60.<br />
2. P<strong>in</strong>sky MR. Assessment of <strong>in</strong>dices of preload and <strong>volume</strong><br />
<strong>responsiveness</strong>. Curr Op<strong>in</strong> Crit Care 2005; 11: 235–9.<br />
1072<br />
3. Marx G, Cope T, McCrossan L, Swaraj S, Cowan C, Mostafa<br />
SM et al. Assess<strong>in</strong>g <strong>fluid</strong> <strong>responsiveness</strong> by stroke <strong>volume</strong><br />
<strong>variation</strong> <strong>in</strong> mechanically ventilated patients with severe<br />
sepsis. Eur J Anaesthesiol 2004; 21: 132–8.<br />
4. Berkenstadt H, Margalit N, Hadani M, Friedman Z, Segal E,<br />
Villa Y et al. <strong>Stroke</strong> <strong>volume</strong> <strong>variation</strong> as a <strong>predict</strong>or of <strong>fluid</strong><br />
<strong>responsiveness</strong> <strong>in</strong> patients undergo<strong>in</strong>g bra<strong>in</strong> surgery. Anesth<br />
Analg 2001; 92: 984–9.<br />
5. Wiesenack C, Prasser C, Rodig G, Keyl C. <strong>Stroke</strong> <strong>volume</strong><br />
<strong>variation</strong> as an <strong>in</strong>dicator of <strong>fluid</strong> <strong>responsiveness</strong> us<strong>in</strong>g pulse<br />
contour analysis <strong>in</strong> mechanically ventilated patients. Anesth<br />
Analg 2003; 96: 1254–7.<br />
6. Hofer CK, Müller SM, Furrer L, Klaghofer R, Genoni M,<br />
Zoll<strong>in</strong>ger A. <strong>Stroke</strong> <strong>volume</strong> and pulse pressure <strong>variation</strong> for<br />
<strong>predict</strong>ion of <strong>fluid</strong> <strong>responsiveness</strong> <strong>in</strong> patients undergo<strong>in</strong>g<br />
off-pump coronary artery bypass graft<strong>in</strong>g. Chest 2005; 128:<br />
848–54.<br />
7. Reuter DA, Felb<strong>in</strong>ger TW, Kilger E, Schmidt C, Lamm P,<br />
Goetz AE. Optimiz<strong>in</strong>g <strong>fluid</strong> therapy <strong>in</strong> mechanically ventilated<br />
patients after cardiac surgery by on-l<strong>in</strong>e monitor<strong>in</strong>g of<br />
left ventricular stroke <strong>volume</strong> <strong>variation</strong>s. Comparison with<br />
aortic systolic pressure <strong>variation</strong>s. Br J Anaesth 2002; 88: 124–6.<br />
8. Reuter DA, Felb<strong>in</strong>ger TW, Schmidt C, Kilger E, Goedje O,<br />
Lamm P et al. <strong>Stroke</strong> <strong>volume</strong> <strong>variation</strong>s for assessment of<br />
cardiac <strong>responsiveness</strong> to <strong>volume</strong> load<strong>in</strong>g <strong>in</strong> mechanically<br />
ventilated patients after cardiac surgery. Intensive Care Med<br />
2002; 28: 392–8.<br />
9. Wiesenack C, Fiegl C, Keyser A, Prasser C, Keyl C. Assessment<br />
of <strong>fluid</strong> <strong>responsiveness</strong> <strong>in</strong> mechanically ventilated<br />
cardiac surgical patients. Eur J Anaesthesiol 2005; 22: 658–65.<br />
10. Preisman S, Kogan S, Berkenstadt H, Perel A. Predict<strong>in</strong>g <strong>fluid</strong><br />
<strong>responsiveness</strong> <strong>in</strong> patients undergo<strong>in</strong>g cardiac surgery: functional<br />
haemodynamic parameters <strong>in</strong>clud<strong>in</strong>g the Respiratory<br />
Systolic Variation Test and static preload <strong>in</strong>dicators. Br J<br />
Anaesth 2005; 95: 746–55.<br />
11. American College of Chest Physicians/Society of Critical<br />
Care Medic<strong>in</strong>e Consensus Conference. Def<strong>in</strong>itions for sepsis
and organ failure and guidel<strong>in</strong>es for the use of <strong>in</strong>novative<br />
therapies <strong>in</strong> sepsis. Crit Care Med 1992; 20: 864–74.<br />
12. Devl<strong>in</strong> JW, Boleski G, Mlynarek M, Nerenz DR, Peterson E,<br />
Jankowski M et al. Motor Activity Assessment Scale: a valid<br />
and reliable sedation scale for use with mechanically ventilated<br />
patients <strong>in</strong> an adult surgical <strong>in</strong>tensive care unit. Crit Care<br />
Med 1999; 27: 1271–5.<br />
13. V<strong>in</strong>cent JL, Moreno R, Takala J, Willatts S, De MA, Bru<strong>in</strong><strong>in</strong>g H et<br />
al. The SOFA (sepsis-related organ failure assessment) score to<br />
describe organ dysfunction/failure. On behalf of the Work<strong>in</strong>g<br />
Group on sepsis-related problems of the European Society of<br />
Intensive Care Medic<strong>in</strong>e. Intensive Care Med 1996; 22: 707–10.<br />
14. Michard F, Alaya S, Zarka V, Bahloul M, Richard C, Teboul JL.<br />
Global end-diastolic <strong>volume</strong> as an <strong>in</strong>dicator of cardiac preload<br />
<strong>in</strong> patients with septic shock. Chest 2003; 124: 1900–8.<br />
15. Nouira S, Elatrous S, Dimassi S, Besbes L, Boukef R,<br />
Mohamed B et al. Effects of norep<strong>in</strong>ephr<strong>in</strong>e on static and<br />
dynamic preload <strong>in</strong>dicators <strong>in</strong> experimental hemorrhagic<br />
shock. Crit Care Med 2005; 33: 2339–43.<br />
16. P<strong>in</strong>sky MR. The dynamic <strong>in</strong>terface between hemodynamic<br />
variables and autonomic tone. Crit Care Med 2005; 33: 2437–8.<br />
17. Tavernier B, Makhot<strong>in</strong>e O, Lebuffe G, Dupont J, Scherpereel P.<br />
Systolic pressure <strong>variation</strong> as a guide to <strong>fluid</strong> therapy <strong>in</strong><br />
patients with sepsis-<strong>in</strong>duced hypotension. Anesthesiology<br />
1998; 89: 1313–21.<br />
18. Michard F, Boussat S, Chemla D, Anguel N, Mercat A,<br />
Lecarpentier Y et al. Relation between respiratory changes<br />
<strong>in</strong> arterial pulse pressure and <strong>fluid</strong> <strong>responsiveness</strong> <strong>in</strong> septic<br />
patients with acute circulatory failure. Am J Respir Crit Care<br />
Med 2000; 162: 134–8.<br />
19. De Backer D, Heenen S, Piagnerelli M, Koch M, V<strong>in</strong>cent JL.<br />
Pulse pressure <strong>variation</strong>s to <strong>predict</strong> <strong>fluid</strong> <strong>responsiveness</strong>:<br />
<strong>in</strong>fluence of tidal Volume. Intensive Care Med 2005; 31: 517–23.<br />
Address:<br />
Anders Perner<br />
Department of Intensive Care 4131<br />
Rigshospitalet<br />
Blegdamsvej<br />
DK-2100 Copenhagen<br />
Denmark<br />
e-mail: ap@dadlnet.dk<br />
SVV <strong>in</strong> patients with septic shock<br />
1073