SUPPLEMENTARY EXERCISES for ... - WH Freeman
SUPPLEMENTARY EXERCISES for ... - WH Freeman
SUPPLEMENTARY EXERCISES for ... - WH Freeman
- No tags were found...

You also want an ePaper? Increase the reach of your titles
YUMPU automatically turns print PDFs into web optimized ePapers that Google loves.
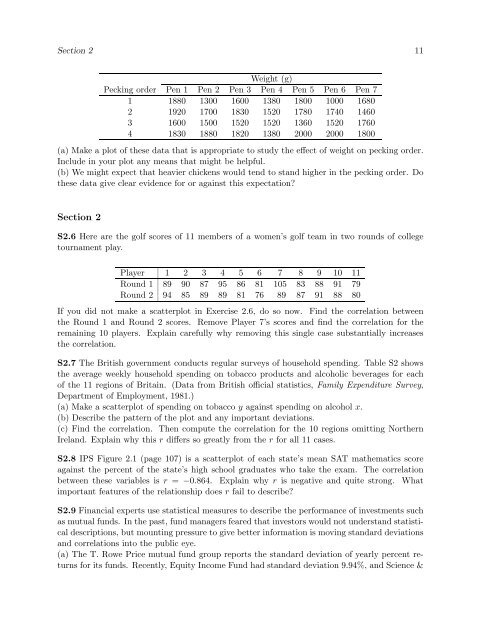
Section 2 11Weight (g)Pecking order Pen 1 Pen 2 Pen 3 Pen 4 Pen 5 Pen 6 Pen 71 1880 1300 1600 1380 1800 1000 16802 1920 1700 1830 1520 1780 1740 14603 1600 1500 1520 1520 1360 1520 17604 1830 1880 1820 1380 2000 2000 1800(a) Make a plot of these data that is appropriate to study the effect of weight on pecking order.Include in your plot any means that might be helpful.(b) We might expect that heavier chickens would tend to stand higher in the pecking order. Dothese data give clear evidence <strong>for</strong> or against this expectation?Section 2S2.6 Here are the golf scores of 11 members of a women’s golf team in two rounds of collegetournament play.Player 1 2 3 4 5 6 7 8 9 10 11Round 1 89 90 87 95 86 81 105 83 88 91 79Round 2 94 85 89 89 81 76 89 87 91 88 80If you did not make a scatterplot in Exercise 2.6, do so now. Find the correlation betweenthe Round 1 and Round 2 scores. Remove Player 7’s scores and find the correlation <strong>for</strong> theremaining 10 players. Explain carefully why removing this single case substantially increasesthe correlation.S2.7 The British government conducts regular surveys of household spending. Table S2 showsthe average weekly household spending on tobacco products and alcoholic beverages <strong>for</strong> eachof the 11 regions of Britain. (Data from British official statistics, Family Expenditure Survey,Department of Employment, 1981.)(a) Make a scatterplot of spending on tobacco y against spending on alcohol x.(b) Describe the pattern of the plot and any important deviations.(c) Find the correlation. Then compute the correlation <strong>for</strong> the 10 regions omitting NorthernIreland. Explain why this r differs so greatly from the r <strong>for</strong> all 11 cases.S2.8 IPS Figure 2.1 (page 107) is a scatterplot of each state’s mean SAT mathematics scoreagainst the percent of the state’s high school graduates who take the exam. The correlationbetween these variables is r = −0.864. Explain why r is negative and quite strong. Whatimportant features of the relationship does r fail to describe?S2.9 Financial experts use statistical measures to describe the per<strong>for</strong>mance of investments suchas mutual funds. In the past, fund managers feared that investors would not understand statisticaldescriptions, but mounting pressure to give better in<strong>for</strong>mation is moving standard deviationsand correlations into the public eye.(a) The T. Rowe Price mutual fund group reports the standard deviation of yearly percent returns<strong>for</strong> its funds. Recently, Equity Income Fund had standard deviation 9.94%, and Science &