SUPPLEMENTARY EXERCISES for ... - WH Freeman
SUPPLEMENTARY EXERCISES for ... - WH Freeman
SUPPLEMENTARY EXERCISES for ... - WH Freeman
- No tags were found...
You also want an ePaper? Increase the reach of your titles
YUMPU automatically turns print PDFs into web optimized ePapers that Google loves.
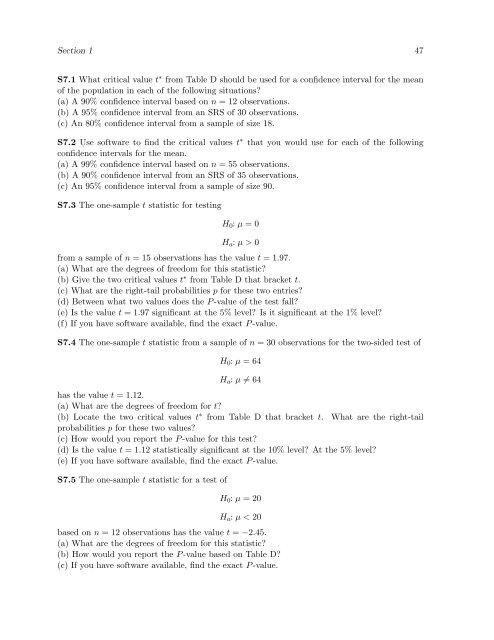
Section 1 47S7.1 What critical value t ∗ from Table D should be used <strong>for</strong> a confidence interval <strong>for</strong> the meanof the population in each of the following situations?(a) A 90% confidence interval based on n = 12 observations.(b) A 95% confidence interval from an SRS of 30 observations.(c) An 80% confidence interval from a sample of size 18.S7.2 Use software to find the critical values t ∗ that you would use <strong>for</strong> each of the followingconfidence intervals <strong>for</strong> the mean.(a) A 99% confidence interval based on n = 55 observations.(b) A 90% confidence interval from an SRS of 35 observations.(c) An 95% confidence interval from a sample of size 90.S7.3 The one-sample t statistic <strong>for</strong> testingH 0 : µ = 0H a : µ > 0from a sample of n = 15 observations has the value t = 1.97.(a) What are the degrees of freedom <strong>for</strong> this statistic?(b) Give the two critical values t ∗ from Table D that bracket t.(c) What are the right-tail probabilities p <strong>for</strong> these two entries?(d) Between what two values does the P -value of the test fall?(e) Is the value t = 1.97 significant at the 5% level? Is it significant at the 1% level?(f) If you have software available, find the exact P -value.S7.4 The one-sample t statistic from a sample of n = 30 observations <strong>for</strong> the two-sided test ofH 0 : µ = 64H a : µ ≠ 64has the value t = 1.12.(a) What are the degrees of freedom <strong>for</strong> t?(b) Locate the two critical values t ∗ from Table D that bracket t. What are the right-tailprobabilities p <strong>for</strong> these two values?(c) How would you report the P -value <strong>for</strong> this test?(d) Is the value t = 1.12 statistically significant at the 10% level? At the 5% level?(e) If you have software available, find the exact P -value.S7.5 The one-sample t statistic <strong>for</strong> a test ofH 0 : µ = 20H a : µ < 20based on n = 12 observations has the value t = −2.45.(a) What are the degrees of freedom <strong>for</strong> this statistic?(b) How would you report the P -value based on Table D?(c) If you have software available, find the exact P -value.


