Performance of High Rise Buildings under the February 27th 2010 ...
Performance of High Rise Buildings under the February 27th 2010 ...
Performance of High Rise Buildings under the February 27th 2010 ...

Create successful ePaper yourself
Turn your PDF publications into a flip-book with our unique Google optimized e-Paper software.
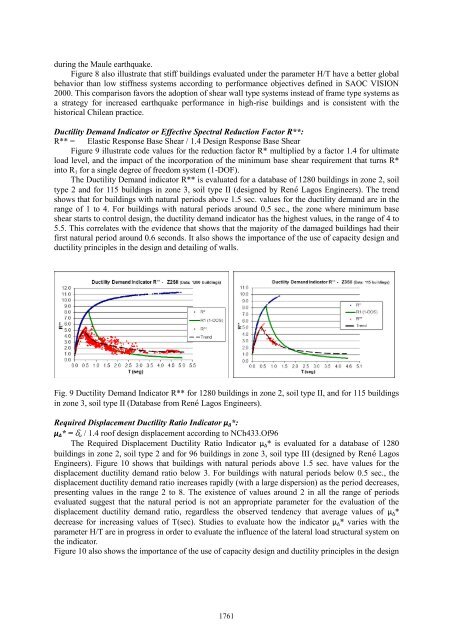
during <strong>the</strong> Maule earthquake.Figure 8 also illustrate that stiff buildings evaluated <strong>under</strong> <strong>the</strong> parameter H/T have a better globalbehavior than low stiffness systems according to performance objectives defined in SAOC VISION2000. This comparison favors <strong>the</strong> adoption <strong>of</strong> shear wall type systems instead <strong>of</strong> frame type systems asa strategy for increased earthquake performance in high-rise buildings and is consistent with <strong>the</strong>historical Chilean practice.Ductility Demand Indicator or Effective Spectral Reduction Factor R**:R** = Elastic Response Base Shear / 1.4 Design Response Base ShearFigure 9 illustrate code values for <strong>the</strong> reduction factor R* multiplied by a factor 1.4 for ultimateload level, and <strong>the</strong> impact <strong>of</strong> <strong>the</strong> incorporation <strong>of</strong> <strong>the</strong> minimum base shear requirement that turns R*into R 1 for a single degree <strong>of</strong> freedom system (1-DOF).The Ductility Demand indicator R** is evaluated for a database <strong>of</strong> 1280 buildings in zone 2, soiltype 2 and for 115 buildings in zone 3, soil type II (designed by René Lagos Engineers). The trendshows that for buildings with natural periods above 1.5 sec. values for <strong>the</strong> ductility demand are in <strong>the</strong>range <strong>of</strong> 1 to 4. For buildings with natural periods around 0.5 sec., <strong>the</strong> zone where minimum baseshear starts to control design, <strong>the</strong> ductility demand indicator has <strong>the</strong> highest values, in <strong>the</strong> range <strong>of</strong> 4 to5.5. This correlates with <strong>the</strong> evidence that shows that <strong>the</strong> majority <strong>of</strong> <strong>the</strong> damaged buildings had <strong>the</strong>irfirst natural period around 0.6 seconds. It also shows <strong>the</strong> importance <strong>of</strong> <strong>the</strong> use <strong>of</strong> capacity design andductility principles in <strong>the</strong> design and detailing <strong>of</strong> walls.Fig. 9 Ductility Demand Indicator R** for 1280 buildings in zone 2, soil type II, and for 115 buildingsin zone 3, soil type II (Database from René Lagos Engineers).Required Displacement Ductility Ratio Indicator µ Δ *:µ Δ * = δ u / 1.4 ro<strong>of</strong> design displacement according to NCh433.Of96The Required Displacement Ductility Ratio Indicator µ Δ * is evaluated for a database <strong>of</strong> 1280buildings in zone 2, soil type 2 and for 96 buildings in zone 3, soil type III (designed by René LagosEngineers). Figure 10 shows that buildings with natural periods above 1.5 sec. have values for <strong>the</strong>displacement ductility demand ratio below 3. For buildings with natural periods below 0.5 sec., <strong>the</strong>displacement ductility demand ratio increases rapidly (with a large dispersion) as <strong>the</strong> period decreases,presenting values in <strong>the</strong> range 2 to 8. The existence <strong>of</strong> values around 2 in all <strong>the</strong> range <strong>of</strong> periodsevaluated suggest that <strong>the</strong> natural period is not an appropriate parameter for <strong>the</strong> evaluation <strong>of</strong> <strong>the</strong>displacement ductility demand ratio, regardless <strong>the</strong> observed tendency that average values <strong>of</strong> µ Δ *decrease for increasing values <strong>of</strong> T(sec). Studies to evaluate how <strong>the</strong> indicator µ Δ * varies with <strong>the</strong>parameter H/T are in progress in order to evaluate <strong>the</strong> influence <strong>of</strong> <strong>the</strong> lateral load structural system on<strong>the</strong> indicator.Figure 10 also shows <strong>the</strong> importance <strong>of</strong> <strong>the</strong> use <strong>of</strong> capacity design and ductility principles in <strong>the</strong> design1761