A review of studies examining the relationship between progression ...
A review of studies examining the relationship between progression ...
A review of studies examining the relationship between progression ...

You also want an ePaper? Increase the reach of your titles
YUMPU automatically turns print PDFs into web optimized ePapers that Google loves.
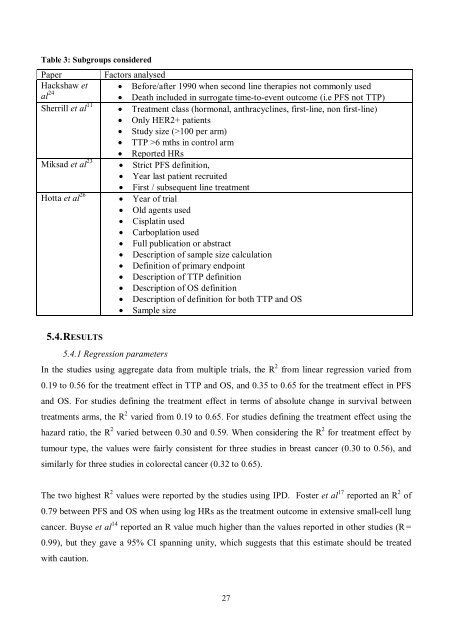
Table 3: Subgroups consideredPaper Factors analysedHackshaw et Before/after 1990 when second line <strong>the</strong>rapies not commonly usedal 24 Death included in surrogate time-to-event outcome (i.e PFS not TTP)Sherrill et al 11 Treatment class (hormonal, anthracyclines, first-line, non first-line) Only HER2+ patients Study size (>100 per arm) TTP >6 mths in control arm Reported HRsMiksad et al 23 Strict PFS definition, Year last patient recruited First / subsequent line treatmentHotta et al 26 Year <strong>of</strong> trial Old agents used Cisplatin used Carboplation used Full publication or abstract Description <strong>of</strong> sample size calculation Definition <strong>of</strong> primary endpoint Description <strong>of</strong> TTP definition Description <strong>of</strong> OS definition Description <strong>of</strong> definition for both TTP and OS Sample size5.4. RESULTS5.4.1 Regression parametersIn <strong>the</strong> <strong>studies</strong> using aggregate data from multiple trials, <strong>the</strong> R 2 from linear regression varied from0.19 to 0.56 for <strong>the</strong> treatment effect in TTP and OS, and 0.35 to 0.65 for <strong>the</strong> treatment effect in PFSand OS. For <strong>studies</strong> defining <strong>the</strong> treatment effect in terms <strong>of</strong> absolute change in survival <strong>between</strong>treatments arms, <strong>the</strong> R 2 varied from 0.19 to 0.65. For <strong>studies</strong> defining <strong>the</strong> treatment effect using <strong>the</strong>hazard ratio, <strong>the</strong> R 2 varied <strong>between</strong> 0.30 and 0.59. When considering <strong>the</strong> R 2 for treatment effect bytumour type, <strong>the</strong> values were fairly consistent for three <strong>studies</strong> in breast cancer (0.30 to 0.56), andsimilarly for three <strong>studies</strong> in colorectal cancer (0.32 to 0.65).The two highest R 2 values were reported by <strong>the</strong> <strong>studies</strong> using IPD. Foster et al 17 reported an R 2 <strong>of</strong>0.79 <strong>between</strong> PFS and OS when using log HRs as <strong>the</strong> treatment outcome in extensive small-cell lungcancer. Buyse et al 14 reported an R value much higher than <strong>the</strong> values reported in o<strong>the</strong>r <strong>studies</strong> (R =0.99), but <strong>the</strong>y gave a 95% CI spanning unity, which suggests that this estimate should be treatedwith caution.27