Astral Foods Annual Report 2008
Astral Foods Annual Report 2008
Astral Foods Annual Report 2008

You also want an ePaper? Increase the reach of your titles
YUMPU automatically turns print PDFs into web optimized ePapers that Google loves.
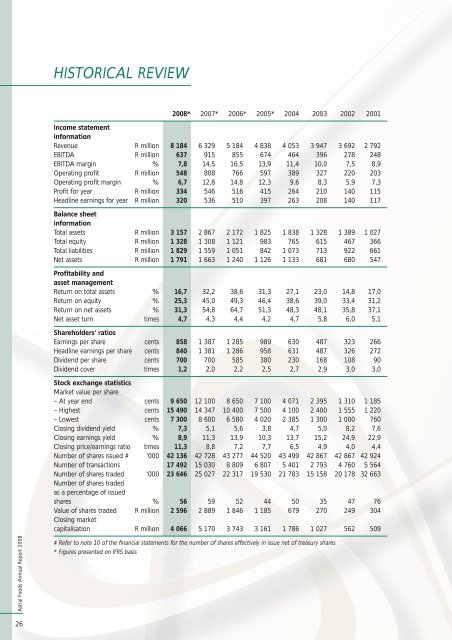
HISTORICAL REVIEW<strong>2008</strong>* 2007* 2006* 2005* 2004 2003 2002 2001Income statementinformationRevenue R million 8 184 6 329 5 184 4 838 4 053 3 947 3 692 2 792EBITDA R million 637 915 855 674 464 396 278 248EBITDA margin % 7,8 14,5 16,5 13,9 11,4 10,0 7,5 8,9Operating profit R million 548 808 766 597 389 327 220 203Operating profit margin % 6,7 12,8 14,8 12,3 9,6 8,3 5,9 7,3Profit for year R million 334 546 516 415 264 210 140 115Headline earnings for year R million 320 536 510 397 263 208 140 117Balance sheetinformationTotal assets R million 3 157 2 867 2 172 1 825 1 838 1 328 1 389 1 027Total equity R million 1 328 1 308 1 121 983 765 615 467 366Total liabilities R million 1 829 1 559 1 051 842 1 073 713 922 661Net assets R million 1 791 1 663 1 240 1 126 1 133 681 680 547Profitability andasset managementReturn on total assets % 16,7 32,2 38,6 31,3 27,1 23,0 14,8 17,0Return on equity % 25,3 45,0 49,3 46,4 38,6 39,0 33,4 31,2Return on net assets % 31,3 54,8 64,7 51,3 48,3 48,1 35,8 37,1Net asset turn times 4,7 4,3 4,4 4,2 4,7 5,8 6,0 5,1Shareholders' ratiosEarnings per share cents 858 1 387 1 285 989 630 487 323 266Headline earnings per share cents 840 1 381 1 286 958 631 487 326 272Dividend per share cents 700 700 585 380 230 168 108 90Dividend cover times 1,2 2,0 2,2 2,5 2,7 2,9 3,0 3,0Stock exchange statisticsMarket value per share– At year end cents 9 650 12 100 8 650 7 100 4 071 2 395 1 310 1 185– Highest cents 15 490 14 347 10 400 7 500 4 100 2 400 1 555 1 220– Lowest cents 7 300 8 600 6 580 4 020 2 385 1 300 1 000 760Closing dividend yield % 7,3 5,1 5,6 3,8 4,7 5,0 8,2 7,6Closing earnings yield % 8,9 11,3 13,9 10,3 13,7 15,2 24,9 22,9Closing price/earnings ratio times 11,3 8,8 7,2 7,7 6,5 4,9 4,0 4,4Number of shares issued # '000 42 136 42 728 43 277 44 520 43 499 42 867 42 867 42 924Number of transactions 17 492 15 030 8 809 6 807 5 401 2 793 4 760 5 564Number of shares traded '000 23 646 25 027 22 317 19 530 21 783 15 158 20 178 32 663Number of shares tradedas a percentage of issuedshares % 56 59 52 44 50 35 47 76Value of shares traded R million 2 596 2 889 1 846 1 185 679 270 249 304Closing marketcapitalisation R million 4 066 5 170 3 743 3 161 1 786 1 027 562 509<strong>Astral</strong> <strong>Foods</strong> <strong>Annual</strong> <strong>Report</strong> <strong>2008</strong># Refer to note 10 of the financial statements for the number of shares effectively in issue net of treasury shares* Figures presented on IFRS basis26