Astral Foods Annual Report 2008
Astral Foods Annual Report 2008
Astral Foods Annual Report 2008

You also want an ePaper? Increase the reach of your titles
YUMPU automatically turns print PDFs into web optimized ePapers that Google loves.
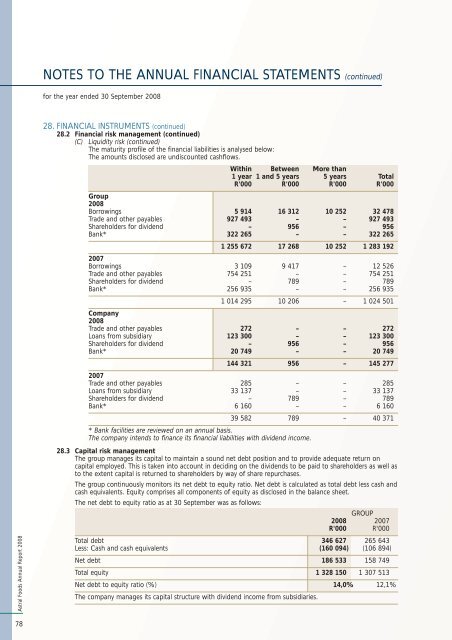
NOTES TO THE ANNUAL FINANCIAL STATEMENTS (continued)for the year ended 30 September <strong>2008</strong><strong>Astral</strong> <strong>Foods</strong> <strong>Annual</strong> <strong>Report</strong> <strong>2008</strong>28. FINANCIAL INSTRUMENTS (continued)28.2 Financial risk management (continued)(C) Liquidity risk (continued)The maturity profile of the financial liabilities is analysed below:The amounts disclosed are undiscounted cashflows.Within Between More than1 year 1 and 5 years 5 years TotalR'000 R'000 R'000 R'000Group<strong>2008</strong>Borrowings 5 914 16 312 10 252 32 478Trade and other payables 927 493 – – 927 493Shareholders for dividend – 956 – 956Bank* 322 265 – – 322 2651 255 672 17 268 10 252 1 283 1922007Borrowings 3 109 9 417 – 12 526Trade and other payables 754 251 – – 754 251Shareholders for dividend – 789 – 789Bank* 256 935 – – 256 9351 014 295 10 206 – 1 024 501Company<strong>2008</strong>Trade and other payables 272 – – 272Loans from subsidiary 123 300 – – 123 300Shareholders for dividend – 956 – 956Bank* 20 749 – – 20 749144 321 956 – 145 2772007Trade and other payables 285 – – 285Loans from subsidiary 33 137 – – 33 137Shareholders for dividend – 789 – 789Bank* 6 160 – – 6 16039 582 789 – 40 371* Bank facilities are reviewed on an annual basis.The company intends to finance its financial liabilities with dividend income.28.3 Capital risk managementThe group manages its capital to maintain a sound net debt position and to provide adequate return oncapital employed. This is taken into account in deciding on the dividends to be paid to shareholders as well asto the extent capital is returned to shareholders by way of share repurchases.The group continuously monitors its net debt to equity ratio. Net debt is calculated as total debt less cash andcash equivalents. Equity comprises all components of equity as disclosed in the balance sheet.The net debt to equity ratio as at 30 September was as follows:GROUP<strong>2008</strong> 2007R'000 R'000Total debt 346 627 265 643Less: Cash and cash equivalents (160 094) (106 894)Net debt 186 533 158 749Total equity 1 328 150 1 307 513Net debt to equity ratio (%) 14,0% 12,1%The company manages its capital structure with dividend income from subsidiaries.78