The Metric U explained - Unipart Logistics
The Metric U explained - Unipart Logistics
The Metric U explained - Unipart Logistics

Create successful ePaper yourself
Turn your PDF publications into a flip-book with our unique Google optimized e-Paper software.
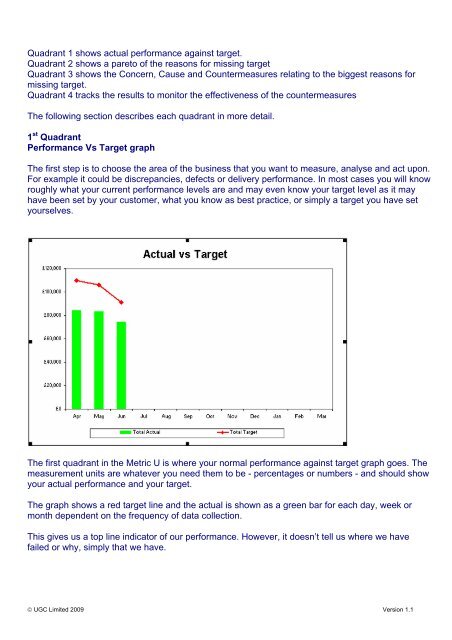
Quadrant 1 shows actual performance against target.Quadrant 2 shows a pareto of the reasons for missing targetQuadrant 3 shows the Concern, Cause and Countermeasures relating to the biggest reasons formissing target.Quadrant 4 tracks the results to monitor the effectiveness of the countermeasures<strong>The</strong> following section describes each quadrant in more detail.1 st QuadrantPerformance Vs Target graph<strong>The</strong> first step is to choose the area of the business that you want to measure, analyse and act upon.For example it could be discrepancies, defects or delivery performance. In most cases you will knowroughly what your current performance levels are and may even know your target level as it mayhave been set by your customer, what you know as best practice, or simply a target you have setyourselves.<strong>The</strong> first quadrant in the <strong>Metric</strong> U is where your normal performance against target graph goes. <strong>The</strong>measurement units are whatever you need them to be - percentages or numbers - and should showyour actual performance and your target.<strong>The</strong> graph shows a red target line and the actual is shown as a green bar for each day, week ormonth dependent on the frequency of data collection.This gives us a top line indicator of our performance. However, it doesn’t tell us where we havefailed or why, simply that we have.© UGC Limited 2009 Version 1.1