

PDF: 1050 KB - Bureau of Infrastructure, Transport and Regional ...
PDF: 1050 KB - Bureau of Infrastructure, Transport and Regional ...
PDF: 1050 KB - Bureau of Infrastructure, Transport and Regional ...
- No tags were found...

Create successful ePaper yourself
Turn your PDF publications into a flip-book with our unique Google optimized e-Paper software.
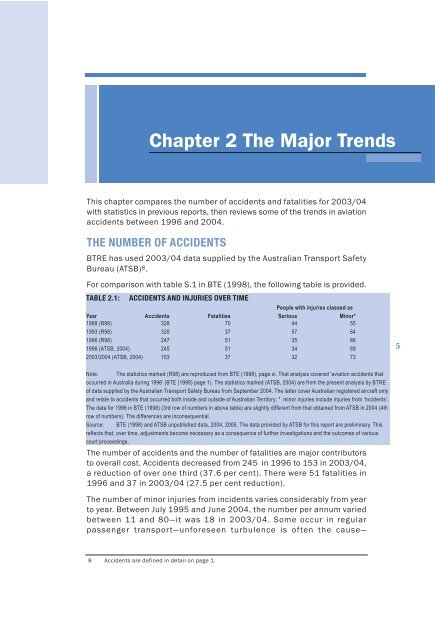
Chapter 2 The Major TrendsThis chapter compares the number <strong>of</strong> accidents <strong>and</strong> fatalities for 2003/04with statistics in previous reports, then reviews some <strong>of</strong> the trends in aviationaccidents between 1996 <strong>and</strong> 2004.THE NUMBER OF ACCIDENTSBTRE has used 2003/04 data supplied by the Australian <strong>Transport</strong> Safety<strong>Bureau</strong> (ATSB) 8 .For comparison with table S.1 in BTE (1998), the following table is provided.TABLE 2.1: ACCIDENTS AND INJURIES OVER TIMEPeople with injuries classed asYear Accidents Fatalities Serious Minor*1988 (R98) 328 70 44 551993 (R98) 320 37 57 641996 (R98) 247 51 35 861996 (ATSB, 2004) 245 51 34 892003/2004 (ATSB, 2004) 153 37 32 735Note: The statistics marked (R98) are reproduced from BTE (1998), page xi. That analysis covered ‘aviation accidents thatoccurred in Australia during 1996’ (BTE (1998) page 1). The statistics marked (ATSB, 2004) are from the present analysis by BTRE<strong>of</strong> data supplied by the Australian <strong>Transport</strong> Safety <strong>Bureau</strong> from September 2004. The latter cover Australian registered aircraft only<strong>and</strong> relate to accidents that occurred both inside <strong>and</strong> outside <strong>of</strong> Australian Territory; * minor injuries include injuries from ‘Incidents’.The data for 1996 in BTE (1998) (3rd row <strong>of</strong> numbers in above table) are slightly different from that obtained from ATSB in 2004 (4throw <strong>of</strong> numbers). The differences are inconsequential.Source: BTE (1998) <strong>and</strong> ATSB unpublished data, 2004, 2005. The data provided by ATSB for this report are preliminary. Thisreflects that, over time, adjustments become necessary as a consequence <strong>of</strong> further investigations <strong>and</strong> the outcomes <strong>of</strong> variouscourt proceedings.The number <strong>of</strong> accidents <strong>and</strong> the number <strong>of</strong> fatalities are major contributorsto overall cost. Accidents decreased from 245 in 1996 to 153 in 2003/04,a reduction <strong>of</strong> over one third (37.6 per cent). There were 51 fatalities in1996 <strong>and</strong> 37 in 2003/04 (27.5 per cent reduction).The number <strong>of</strong> minor injuries from incidents varies considerably from yearto year. Between July 1995 <strong>and</strong> June 2004, the number per annum variedbetween 11 <strong>and</strong> 80—it was 18 in 2003/04. Some occur in regularpassenger transport—unforeseen turbulence is <strong>of</strong>ten the cause—8 Accidents are defined in detail on page 1.


